Understanding the long-legged doji candlestick pattern: a comprehensive guide

What is a long-legged doji?
A long-legged doji is a candlestick pattern that forms when the opening and closing prices are very close or virtually identical. Its defining feature is the presence of long upper and lower shadows, also called wicks. These long shadows indicate that prices moved significantly during the trading period, but closed near the opening level. This creates a cross-shaped appearance on the chart.
It differs from the standard doji
A standard doji shares similar characteristics, with opening and closing prices that are nearly equal. The main distinction lies in the length of the shadows. A standard doji has shorter shadows, while the long-legged doji’s are substantially longer. These extended shadows reflect higher price volatility and offer insight into the balance between buyers and sellers. The longer wicks suggest a stronger struggle for control during the session.
Psychology behind the pattern
The long-legged doji signals market indecision. During the session, buyers pushed prices higher, while sellers drove them lower. Both sides were active, yet neither managed to dominate, resulting in a closing price near the open. This forms a stalemate, indicating uncertainty about the next price movement. It may suggest that the previous trend is losing momentum and can be seen as a pause in market activity. Some traders interpret it as a potential warning sign. Recognising this trading psychology may help improve pattern interpretation.
How the long-legged doji is formed
There are several key aspects to keep in mind when understanding how this pattern forms:
Price action explanation
The pattern forms through specific price movements. The period begins with the opening price. Buyers push the price up, creating a high – forming the upper shadow. Then sellers take control, driving the price down to create a low – forming the lower shadow. Both sides remain active, but by the close, the price returns near the open. The contest ends in a stalemate. This price action produces long shadows and a small real body.
Market conditions that produce it
The long-legged doji typically appears in volatile markets, often following a strong trend that may be losing momentum. It can also emerge around major news events, where increased uncertainty drives indecisive price movement. Higher trading volume often accompanies this pattern, highlighting the intensity of the battle between buyers and sellers. Conversely, lower volume can make the pattern less reliable, suggesting it may represent short-term market noise rather than a meaningful signal.
Red vs green long legged doji
The colour of the small real body has limited interpretative value. It can appear green (bullish) or red (bearish). A green body means the close was slightly above the open, while a red body means it was slightly below. In both cases, the underlying message remains the same – market indecision. The long shadows are the defining element, reflecting the tug of war between buying and selling pressure.
In a breakout scenario, the colour can add subtle context. For instance, a green doji at a resistance level might indicate a tentative attempt to break higher, while a red doji at a support level might imply a cautious move lower. These are secondary observations, as the key takeaway remains market indecision. The broader context – where the doji forms – is more significant than its colour.
When and where long-legged doji occurs
In an uptrend, a long-legged doji can signal that upward momentum may be weakening. Buyers start to lose control while sellers begin to emerge. It often acts as a potential reversal indication, suggesting that buying pressure is easing.
In a downtrend, the pattern may suggest that selling momentum is fading and buyers are returning. The price may be finding temporary support, which could precede a possible reversal. Traders often wait for further confirmation before taking action, as the pattern alone is not decisive.
When prices are moving sideways, the long-legged doji is generally less meaningful. It can appear frequently in range-bound markets, where it mainly reflects indecision. The pattern by itself does not predict a breakout; it simply highlights a period of balance. It is most effective when used alongside other indicators.
As with any candlestick pattern, context remains important. A doji forming near a support or resistance level tends to carry greater analytical weight, as it can help confirm the strength of that level. A doji far from key price areas is typically less informative. The broader trend also affects interpretation – a doji appearing after a sustained move is more relevant than one forming during unclear or erratic price action. Always assess it within the wider market context.
Reliability and accuracy of long-legged doji
Pro traders know several aspects that impact the reliability of this pattern:
Pattern reliability in different markets
The pattern tends to be more dependable in highly liquid markets such as major equities or major forex currency pairs. It is generally less reliable in illiquid markets, where limited trading activity can cause large price swings, forming a doji by chance rather than intent. In deeper markets with substantial volume, the doji is more likely to reflect genuine market balance between buyers and sellers.
Success rate based on backtesting and trader experience
No pattern provides consistent accuracy or a guaranteed outcome. Backtesting and trader observations indicate that the long-legged doji can act as a useful early warning signal, though it does not confirm a reversal on its own. It performs best when supported by complementary analysis or indicators. Traders often report improved reliability when waiting for confirmation before drawing conclusions from the pattern.
Strengthening signal with volume and confirmation
Higher trading volume on the doji candle can enhance its significance, signalling a more pronounced contest between buyers and sellers. Conversely, a low-volume doji is more likely to represent a weak or misleading signal. Confirmation remains essential: a candle closing higher after a bullish doji or lower after a bearish doji provides stronger evidence of potential continuation or reversal. Waiting for confirmation can help minimise false readings.
Past performance is not a reliable indicator of future results.
How to trade using the long-legged doji
You now know the meaning of the long-legged doji candle pattern. Confident in recognising it? Let’s look at how it can be applied in technical analysis.
As a reversal signal: the most common use of this pattern
In an uptrend, observe for a long-legged doji and wait for the following candle to close lower, which may suggest a potential reversal. A short position might be considered, with a stop-loss order* potentially set just above the doji’s high.
In a downtrend, wait for a doji and see if the next candle closes higher, which may indicate a possible shift in direction. A long position might be considered, with a stop-loss set below the doji’s low.
In ranging markets: the doji may mark a boundary reaction
A doji at a support level can indicate a potential upward reaction, while one at a resistance level can point to a possible pullback. This is one of the commonly used trading strategies. A stop-loss is typically placed just outside the range to manage exposure.
With support and resistance levels: strengthening interpretation
A doji forming on a key support level may signal that buyers are defending that price area. Conversely, one forming on a resistance level may suggest that sellers are maintaining control at that point. Recognising these levels can add context and improve the pattern’s reliability.
With moving averages: combining indicators for context
A doji forming near a major moving average (e.g. the 50- or 200-period MA) can add analytical value. It may indicate that the moving average is acting as dynamic support or resistance. The appearance of a doji at this point can signal a pause in momentum, offering additional perspective on potential price behaviour.
*Stop-loss orders are not guaranteed. Guaranteed stop-loss orders incur a fee if activated.
Explore this pattern in a risk-free environment by using a demo account to test strategies and build confidence before applying them in live conditions.
Real market examples of long-legged doji
Theory is one thing, but to fully understand this pattern, it helps to look at how it can appear in real market conditions.
Bullish reversal after downtrend
Consider a chart of a stock that has been declining over several sessions, consistently forming lower lows. A long-legged doji then appears at a new low. The following candle closes higher with a strong bullish move, suggesting a potential reversal. The price subsequently begins a new upward phase. This scenario is referred to as a bullish reversal, with the doji often marking the turning point before the rise.
Bearish reversal after uptrend
Now take a currency pair that has been climbing steadily, such as GBP/USD, forming higher highs across sessions. A long-legged doji appears at a swing high. The next candle closes lower with a pronounced bearish move, signalling a possible shift in direction. The price then starts to decline, forming what is known as a bearish reversal. The doji often marks the peak before the downturn.
Failed signal in low-volume conditions
In markets with limited trading volume, a long-legged doji may appear but lack follow-through. If the next candle is another doji or a small-bodied candle, the price may continue moving sideways. In this case, the signal fails to indicate a reversal, reinforcing the importance of volume and confirmation. Without these, the pattern may simply reflect temporary market noise rather than a meaningful shift.
Long-legged doji compared to other doji types
The doji family has several variations. Each represents indecision, but they differ in appearance and interpretation.
Long-legged vs dragonfly doji
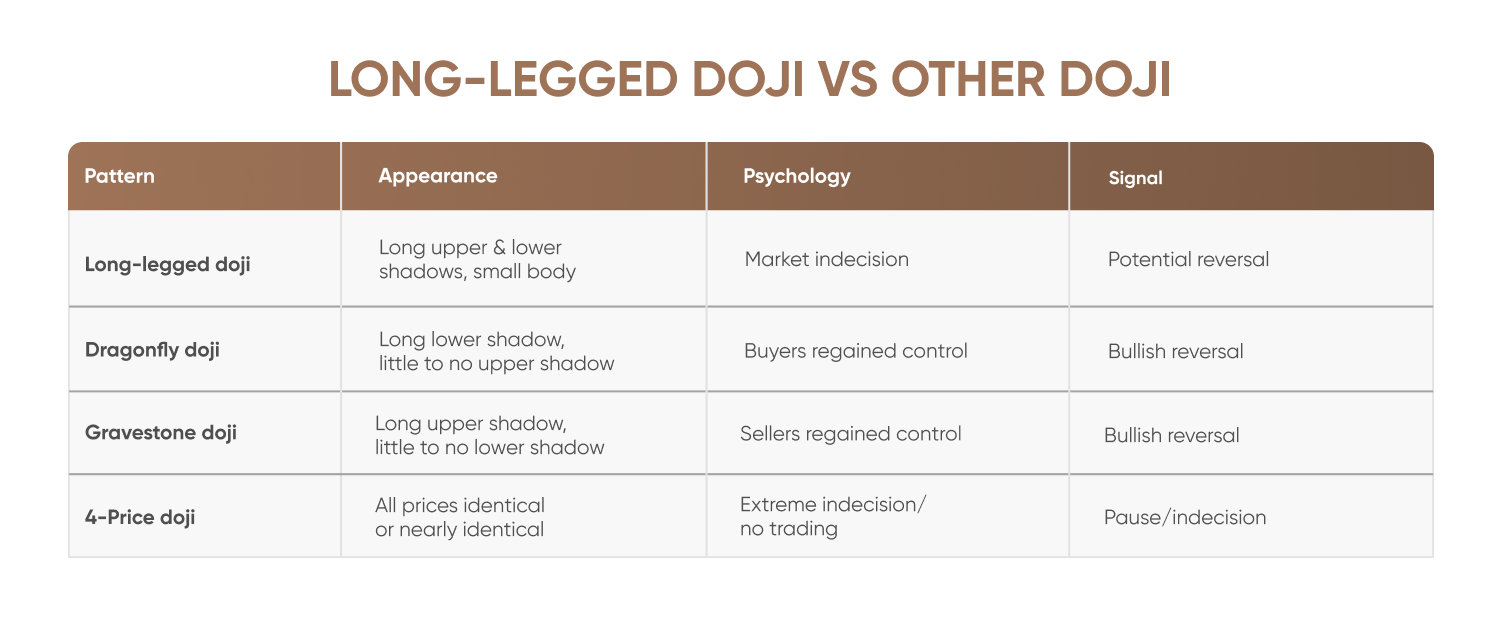
The dragonfly doji features a long lower shadow and little to no upper shadow. The open, high, and close are all at or near the same level. This pattern shows that sellers initially pushed the price down, but buyers later brought it back up. It is often regarded as a bullish reversal indication. In contrast, the long-legged doji has both upper and lower shadows, reflecting a more balanced struggle between market participants.
Long-legged vs gravestone doji
The gravestone doji is effectively the opposite of the dragonfly. It has a long upper shadow and little to no lower shadow. The open, low, and close are all at or near the same level. This pattern shows that buyers initially pushed the price up, but sellers reversed those gains. It is often interpreted as a bearish reversal indication. The long-legged doji, by comparison, contains both shadows, illustrating broader uncertainty.
Long-legged vs 4-price & rickshaw man
The 4-price doji is extremely rare. All four prices – open, high, low, and close – are identical or nearly identical, typically forming in very low-volume conditions. It signals extreme indecision or minimal trading activity.
The term ‘rickshaw man’ is sometimes used to describe the long-legged doji, referring to its resemblance to a rickshaw puller’s shape on a chart.
Pros and cons of the long-legged doji pattern
To understand the value and meaning of the long-legged doji candle pattern, it is important to consider both its strengths and limitations.
Advantages
The pattern is a clear visual signal of market indecision, often serving as one of the most recognisable indicators of a temporary stalemate between buyers and sellers. It encourages traders to approach with caution, as momentum may be shifting. The long-legged doji is also easy to identify on charts due to its distinctive cross-like appearance. It becomes more reliable when used alongside other analytical tools – such as support and resistance levels, volume analysis, or moving averages – which can enhance its interpretive value.
Limitations
The long-legged doji requires confirmation; analysing the pattern in isolation can reduce reliability. A subsequent candle that aligns with the anticipated direction is generally used to confirm the signal. In volatile or range-bound markets, the pattern can appear frequently, often reflecting short-term uncertainty rather than a meaningful shift. In low-volume conditions, it may not represent a genuine contest between buyers and sellers, increasing the likelihood of false signals.
Past performance is not a reliable indicator of future results.
Best markets and timeframes for the pattern
Forex, shares, indices, commodities – which market is best?
The long-legged doji can appear across all major markets, making it a widely applicable pattern. It is particularly common in forex trading but also occurs in shares. Its effectiveness largely depends on market liquidity, performing best in high-volume, liquid environments where price movements more accurately reflect market sentiment.
1H, 4H, daily - when is it most reliable?
The pattern tends to be more reliable on particular timeframes. Daily and 4-hour charts are generally preferred for identifying a long-legged doji. On very short timeframes, such as the 1-minute or 5-minute chart, it is less dependable due to increased market noise. A doji on a daily chart represents a complete trading session, capturing a broader contest between buyers and sellers and offering a clearer reflection of market indecision.
Pattern frequency across timeframes
Long-legged doji appear more frequently on shorter timeframes because of intraday volatility, but these signals are typically less meaningful. On higher timeframes, the pattern occurs less often yet tends to carry greater significance. Traders may find more consistent analytical value by focusing on longer timeframes, where signals are generally clearer and more reliable.
Past performance is not a reliable indicator of future results.
Tools and indicators to increase the pattern’s reliability
Identifying the pattern is only the first step. Using complementary indicators can help validate its significance and filter out false signals.
Volume indicator
Volume is one of the most effective confirming tools. Look for higher volume on the doji candle, as it suggests a genuine contest between buyers and sellers. When volume is low, interpret the signal with caution, as it may be less reliable. Volume helps validate the importance of the price movement underlying the pattern.
RSI/MACD confirmations
The relative strength index (RSI) and moving average convergence divergence (MACD) can provide additional context. An RSI reading in overbought or oversold territory alongside a doji can strengthen the signal. An overbought RSI combined with a bearish doji may indicate potential selling pressure, while a bullish doji with an oversold RSI can highlight possible support. A MACD crossover following a doji may add further confirmation of a potential directional shift.
Trendlines or channels
Drawing trendlines or price channels can improve interpretation. A doji forming near a trendline or channel boundary often carries greater analytical value, suggesting that the level is holding and the market may be preparing for a potential turn. This combination helps provide additional context rather than a standalone trading signal.
Applying risk management
Sound risk management remains essential when analysing any pattern. Using appropriate position sizing and protective measures can help manage exposure and limit potential losses.
Common mistakes and misinterpretations
Confusing with similar doji patterns
A common mistake is misidentifying a long-legged doji as a dragonfly or gravestone doji, which can lead to incorrect interpretations. Always examine the shadows carefully. The long-legged doji must have both extended upper and lower shadows. A dragonfly doji has a long lower shadow with little to no upper shadow, while a gravestone doji has a long upper shadow with little to no lower shadow.
Trading it as a standalone signal
This is among the most frequent errors. The long-legged doji should be viewed as a warning or observation signal, not as a direct trade entry. It highlights market hesitation and the need for confirmation. Entering a trade without confirmation from subsequent price action can reduce reliability and increase risk. Confirmation remains essential for context and clarity.
Ignoring market context
Another mistake is overlooking market context. The position of the doji is critical. A doji forming mid-trend is generally less meaningful, while one appearing near key support or resistance levels carries greater analytical weight. Always assess it within the broader market structure. The long-legged doji is a single component of analysis, not a complete signal.
Confident in recognising the long-legged doji? Practise first with a demo account before moving to live trading.
FAQ
What distinguishes a long-legged doji from other doji patterns?
A long-legged doji features both extended upper and lower shadows with a very small real body, whereas patterns such as the dragonfly or gravestone doji have only one long shadow and little to no opposite shadow.
Does the colour of the doji candle matter?
In most cases, the colour is of limited importance. The length of the shadows and the market context are far more significant than whether the candle body is bullish (green) or bearish (red).
Which indicators work best alongside the long-legged doji?
Volume plays a key role – higher volume on the doji candle can help confirm genuine indecision. The RSI and MACD may offer additional context by highlighting overbought or oversold conditions, while trendlines or channels can help identify notable support and resistance levels.
On which timeframes should I look for this pattern?
Long-legged doji are generally more dependable on higher timeframes, such as the 4-hour and daily charts, where market noise is lower and each candle represents broader price activity.
How can I avoid false signals?
Always wait for confirmation from the following candle’s direction, ensure the doji forms near a key level or within a clear trend, and confirm adequate volume to help distinguish genuine market behaviour from random price movement.