Trading guide: Candlestick patterns strategy

What are candlestick patterns?
Candlestick patterns are shapes found in candlestick charts. They are used by traders as part of technical analysis.
Candlestick pattern strategy aims to evaluate how asset prices have behaved in the past and identify repeating shapes and forms of candlesticks. A single candlestick can tell a story, indicating how much the price moved over the course of the day and in what direction based on its colour and its shape, and a group of candlesticks together can give a further analysis of price movements.
Highlights
-
Candlestick patterns are groups and shapes of candlesticks that can be used to further interpret data in a chart as part of technical analysis.
-
There are bearish, bullish and indecision candlestick patterns.
-
Some of the common candlestick patterns for trading include doji candles, spinning top, engulfing patterns, harrami, hammer and hanging man candles.
-
Candlestick patterns are effective in spotting patterns of how asset prices behave, yet they do not predict the future.
Understanding candlestick patterns
Candlesticks charts were originally created in 18th century Japan, so a number of the patterns and shapes associated with them have Japanese names. Candlestick charts became popular outside Japan in the late 1990s.
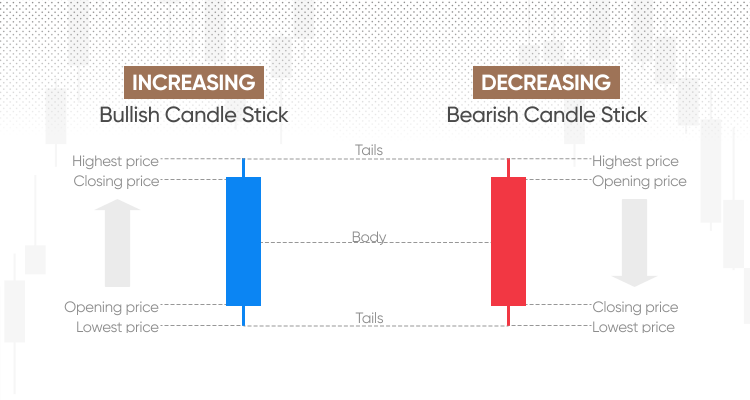
A single candlestick comprises a single period, which could be a day, a week, or a minute - depending on the trader’s set up. The bottom and top of the main body of a green (or sometimes blue) candle represents the opening and closing prices for the time period, while for a red candle it would be reversed: top represents the opening price, while the bottom represents the closing. Meanwhile, the very top and bottom of the wicks represent the highest and lowest price the asset reached during that time period.
*Past performance is not a reliable indicator of future results.
As a result, a single candlestick could contain a lot of data which some traders could use to help in evaluating what might happen in the future. Likewise, a group of them together could sometimes tell a story about a particular market action that took place over a longer period of time.
However, while candlestick patterns could shed some light on things that have happened, they cannot tell people what is going to happen. Therefore, traders should do their own research, remember that markets can move against them, and never trade with more money than they can afford to lose.
Types of candlestick patterns
-
Bullish candlestick patterns: These candlestick patterns appear as a market is rising, signalling a bullish momentum.
-
Bearish candlestick patterns: These candlestick patterns appear when a market is dropping, therefore signalling a bearish momentum.
-
Indecision candlestick patterns: Typically have small real bodies and relatively long shadows, reflecting the lack of a clear direction in the market.
How to identify candlestick patterns in charts
Traders use candlestick charts as part of their technical analysis, using the colours and the shapes of the patterns contained in them to help them predict what might happen to the market in the future, with the traders developing a candlestick pattern strategy.
A candlestick pattern strategy will see a trader take note of what the individual candlesticks are doing. They will then make decisions about whether the candlesticks are forming particular patterns which could indicate a certain price behaviour, such as a market reversal.
Candlestick patterns explained with examples
To learn how to read candlestick patterns, you need to firstly get familiar with them. Below are some of the most common patterns used by traders.
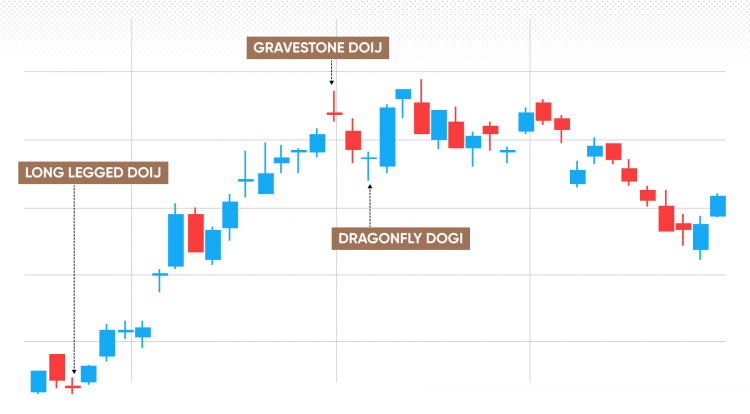
Doji
A doji is a candlestick where the opening and closing prices are equal, and it represents a fair amount of market movement over the course of a time period, but with a return to somewhere very close to the initial price. There are three types of doji distinguished by traders:
-
Long-legged doji: a doji with equal wicks
-
Gravestone doji: a doji with a long head but short tail
-
Dragonfly doji: A doji with a long tail and short head
Doji signifies indecision, with prices occasionally volatile but reverting to the mean. They could sometimes serve as a precursor of price movement.
*Past performance is not a reliable indicator of future results.
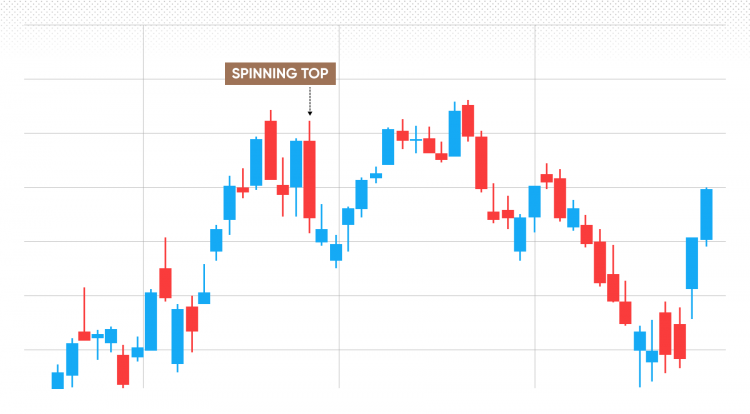
Spinning top
A spinning top is a kind of candlestick pattern similar to a doji. A spinning top looks a bit like a doji but, as a rule, its main body is a bit larger than a doji’s. Also, spinning tops tend to have heads and tails of similar lengths.
They can represent a period of indecision on the part of traders and could sometimes indicate a potential price change, depending on what the following candlestick does.
*Past performance is not a reliable indicator of future results.
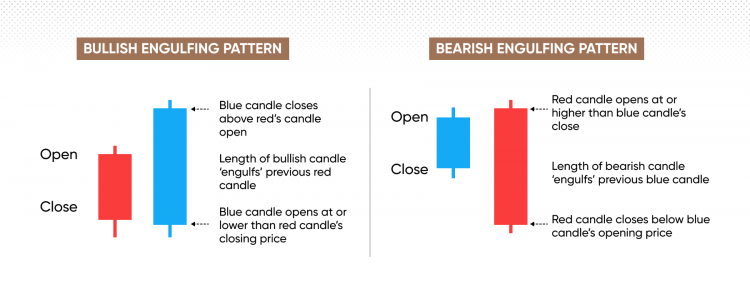
Engulfing patterns
Engulfing pattern is a reversal candlestick pattern that can give either bullish or bearish signals.
A bullish engulfing pattern has a small downward candlestick followed by a larger upward one which, as the name suggests, has a longer body than its predecessor. This might suggest that an asset’s price moved down overnight but a recovery saw it close at higher than anything the previous day.
For a bearish engulfing pattern, the roles are reversed, with a larger downward candlestick engulfing the upward one, suggesting that sellers may well have taken control of the market.
Harami
The harami is another candlestick pattern that comes in both bullish and bearish varieties.
A bullish harami can indicate that a period characterised by downward price movements may be coming to an end. It comprises a downward candlestick followed by an upward doji, which lies within the boundaries of the previous candlestick.
A bearish harami, meanwhile, has an upward candlestick followed by a downward doji. This might suggest that the times of rises might be over, at least for the time being.
Hammer
The hammer is a type of candlestick that has a short body and head but a long tail and usually appears after some overall downward movement.
A hammer suggests that, during the time period, the price moved down and then made a recovery as more buyers stepped in following a period where sellers were more dominant. Often, it comes as a price makes a long-term turnaround, moving from a downward trend to an upward one.
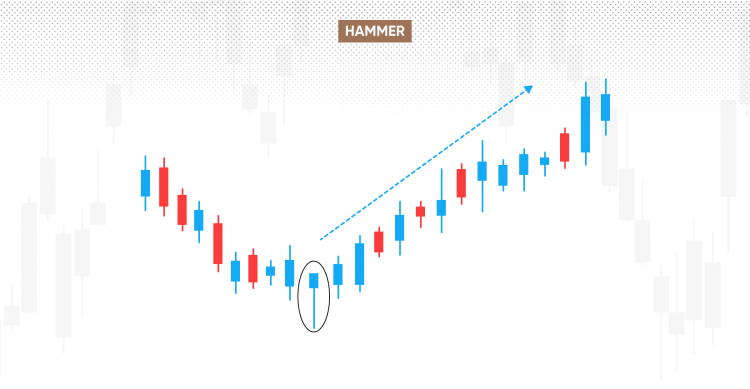
*Past performance is not a reliable indicator of future results.
Hanging man
The hanging man is a kind of candlestick which serves as the opposite of the hammer. In the hanging man, a small body is followed by a long tail, but its body is usually located somewhere above previous candlesticks.
While the story the hanging man tells is not dissimilar to the hammer – buyers coming back into the market following a period of selling – the context differs in that it happened during a bullish phase. It is common for the hanging man to serve as a warning signal that the market might move down.
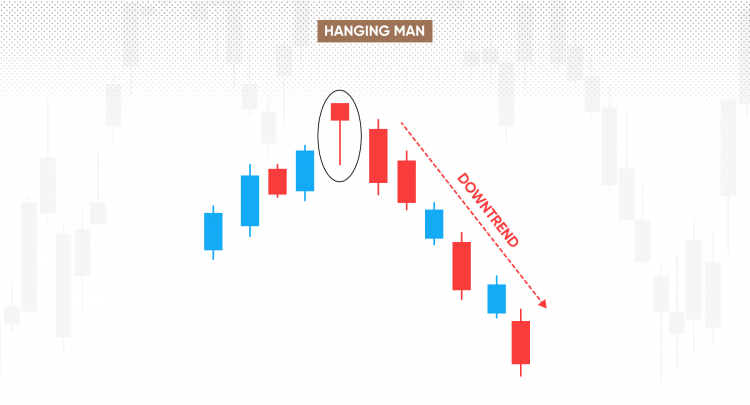
*Past performance is not a reliable indicator of future results.
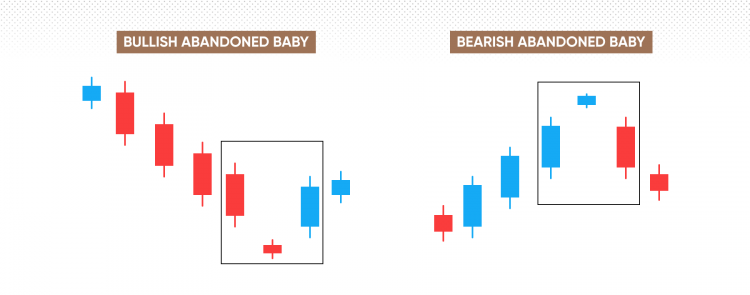
Abandoned babies
The abandoned baby candlestick pattern, sometimes known as the island reversal, comes in two forms, bullish and bearish. Either way, its appearance will be the same, with two, for want of a better word, regular candlesticks with a doji between them.
For a bullish abandoned baby, a large downward candlestick is followed by a doji where the highest point of the main body is below the first candlestick, with a large upward candlestick which has a low point above the topmost part of the doji.
For a bearish abandoned baby, the first candlestick is upward, the doji is downward but above the first candlestick, and the last candlestick is downward and below the doji.
Final thoughts on candlestick pattern strategy
Candlestick patterns are different repeated motifs on a candlestick chart. Traders can use candlestick pattern strategy to inform their decision making, with a range of different candlestick shapes and forms including the doji, spinning top and bullish and bearish engulfing patterns.
It is worth noting that many patterns, such as abandoned babies and the harami pattern, come in both bullish and bearish forms, depending on which direction the market is moving in.
If you want to read an individual candlestick, you should remember that for a green (or blue) candle the bottom and top represent the asset’s opening and closing price, while for the red candle it’s vice versa. Meanwhile, the wicks, or shadows, on the top and bottom are the period’s highest and lowest price.
Remember, however, that candlestick pattern cannot predict the future. While the size and shape of the component parts of the candlestick charts may give some analysts a potential idea of what could happen, they will have no certainty as to what will happen. Markets can be highly volatile and move against your position, so you will need to do your own research and never invest or trade with more money than you can afford to lose. Effective risk management involves setting clear limits and using tools like stop-loss orders to minimize potential losses, ensuring you never risk more than you can afford to lose
FAQs
How many candlestick patterns are there?
Depending on who you ask, there are somewhere between 35 and 75 candlestick patterns.
Are candlestick patterns reliable?
Candlestick patterns are good at telling traders what has happened to a market in the past, but they cannot predict the future.
What are the most common bullish candlestick patterns?
Some of the most common candlestick patterns include the bullish harami, the bullish engulfing pattern and the hammer.