Understanding MACD: a comprehensive guide to moving average convergence divergence
Think of a boulder rolling down a hill. It continues to gain speed, and it takes more and more effort to stop it. This is the power of momentum. In trading, momentum reflects how strongly prices move in a particular direction. When traders see an asset steadily rising, some may choose to join that move. This additional buying can create more demand, reinforcing the trend.
This action creates more demand for the asset, sending prices even higher. The moving average convergence/divergence (MACD) is an indicator that can help you gauge the momentum of an asset. Being simple to understand, an MACD trading strategy is popular among new traders.
Remember, while technical indicators can offer insights into market momentum, past performance is not a reliable indicator of future results.
MACD 101: the basics
The MACD is a technical analysis tool that was created by Gerald Appel. It helps traders see not only the direction of a trend, but also the strength (momentum) of that trend. You can use it to identify new trends, both bullish and bearish.
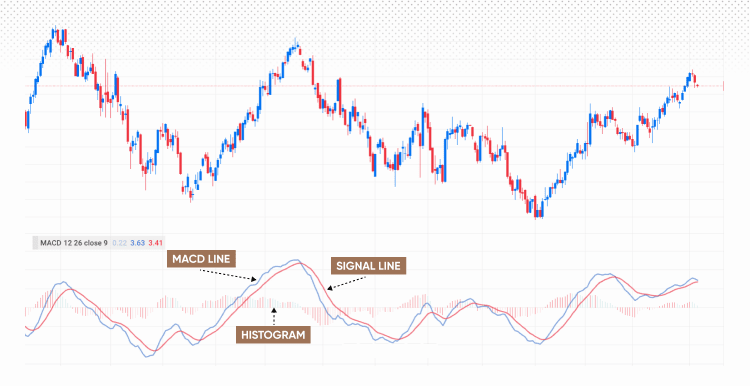
The MACD has 3 main components. The first is the MACD line, which is the core of the indicator. It shows the difference between two exponential moving averages (EMAs). Then we have the signal line. This is a 9-period EMA of the MACD line itself. This line helps traders spot possible buy and sell signals. The third is the histogram or bar chart. It shows the difference between the MACD line and the signal line.
You also need to know about the zero line. It is a fixed, horizontal line at the zero mark on the MACD indicator.
The simplest explanation of how the MACD works
The MACD formula is fairly straightforward. You subtract the 26-period EMA from the 12-period EMA. The result is the MACD line. So:
The signal line is then a 9-period EMA of this MACD Line. You interpret the indicator by watching how these lines interact with each other and with the zero line.
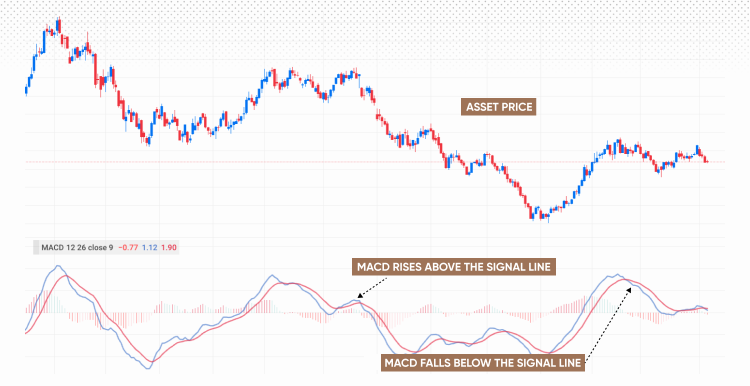
The indicator gives bullish and bearish signals. A bullish signal occurs when the MACD line crosses above the signal line. This suggests that momentum is increasing in the upward direction. A bearish signal happens when the MACD line crosses below the signal line. This suggests that downward momentum is rising.
Past performance is not a reliable indicator of future results.
Core MACD trading signals and concepts
There are some important trading signals and concepts related to an MACD trading strategy.
Signal line crossovers are the most common. A crossover is a potential buy or sell signal. When the MACD line crosses above the signal line, it shows a possible buying opportunity. A cross below can be a selling opportunity.
Zero line crossovers are another important concept. When the MACD line crosses above the zero line, it indicates a shift to bullish momentum (more long positions are being opened for the asset). A cross below the zero line shows a shift to bearish momentum (long positions being sold or short positions being bought).
Don’t miss the signals provided by the MACD histogram. When the MACD line moves away from the signal line, the histogram bars get taller. Taller bars above the zero line mean stronger bullish momentum. Taller bars below the zero line show greater bearish momentum.
MACD divergence is a powerful signal. It happens when the price of an asset moves in the opposite direction of the MACD. A bullish divergence occurs when the price makes a new low, but the MACD makes a higher low. This can signal a coming trend reversal from bearish to bullish. A bearish divergence is the opposite – sellers gaining more control. The price makes a new high, but the MACD makes a lower high. This can signal a coming trend reversal to the downside.
You can also use the MACD with support and resistance levels. This helps confirm signals. For example, a bullish MACD crossover at a key support level is a stronger buy signal.
Top MACD trading strategies
Traders use the MACD in many ways to find trading opportunities. The momentum strategy uses the MACD histogram. The histogram bars get taller as the MACD line moves away from the signal line. Taller bars above the zero line mean stronger bullish momentum. Taller bars below the zero line mean stronger bearish momentum. This strategy works well in trending markets.
The MACD and RSI strategy combines two popular tools. The MACD shows momentum and trend direction. The Relative Strength Index (RSI) shows if a security is overbought or oversold. Using them together helps to confirm signals and can help avoid false ones. A bullish MACD crossover is more reliable if the RSI is not in the overbought zone.
Using the MACD and money flow index (MFI) is another strategy you can consider. This combination provides you a volume-based tool. The MFI shows money flowing into or out of an asset. This can confirm the strength of a trend. A strong MACD signal combined with high money flow is seen as a very strong signal.
You may also consider combining the MACD with RVI (relative vigour index). This is a good strategy because the RVI measures the strength of a trend. It compares an asset’s closing price to its price range. Using it with the MACD gives a more complete picture of the market. This can help you confirm the overall health of a trend before you enter a trade.
The MACD pullback strategy is for traders who follow trends. Here you wait for a price pullback within an existing trend. Then you look for an MACD crossover that confirms that the original trend is resuming. This strategy helps you enter a trend at a better price.
Ever wondered whether you can move away from the default settings when using the MACD? A custom setting strategy is based on just that. The standard MACD settings are 12-26-9. But some traders use different numbers. An example is the 8-17-9 setting. Custom settings can be better for specific markets or trading styles. This is common for day trading or scalping.
Scalping with MACD is a fast-paced strategy. It involves making many small trades on short timeframes. Scalpers look for quick price moves. They need to be very disciplined and manage risk closely.
Swing trading with MACD is a longer-term strategy. Swing traders hold positions for days or weeks. They use the MACD on longer timeframes to spot major trend changes. This strategy looks for bigger price moves than scalping. Swing traders might use a combination of MACD and other indicators for confirmation.
See how MACD trading strategies work in real market conditions without risking real money. Open a demo account.
MACD settings optimisation
The MACD has default settings: 12-26-9. This means the MACD line is the difference between a 12-period EMA and a 26-period EMA. The signal line is a 9-period EMA of the MACD Line. These settings are a good starting point for many markets and trading styles.
However, the best settings can vary. For day trading, traders often use faster settings. This is because they want to capture quick, short-term price moves. For swing trading, slower settings can be better. This helps to filter out market noise and focus on longer trends.
Past performance is not a reliable indicator of future results.
Combining MACD with other indicators
The MACD works best when used with other indicators. This helps to confirm signals and avoid false ones.
One good combination is with the RSI. The MACD shows momentum and trend direction. The RSI shows if a security is overbought or oversold. A bullish MACD crossover is more reliable if the RSI is not in the overbought zone.
Another useful tool is the Bollinger bands. They show a security’s volatility. When the MACD gives a signal near the Bollinger bands, it can be a strong sign of a potential reversal.
You can also combine MACD with volume-based indicators. This helps confirm the strength of a trend. High volume on a MACD signal suggests the move is strong and supported by market participation.
Using MACD with other moving averages is also common. This provides extra confirmation. For example, a bullish MACD crossover that happens above a key moving average, like the 200-period simple moving average, is a stronger signal.
The best combinations depend on your trading style. Day traders might use different combinations than swing traders. For example, a day trader might combine MACD with a fast-moving average. A swing trader might use it with a slower, long-term moving average.
MACD for different markets
The MACD indicator is a useful tool for various financial markets. This includes forex, stocks and commodities. The MACD can help traders in each market. It helps them spot momentum and trend changes. However, the best way to use the MACD can differ. This depends on the specific market's characteristics.
Let’s look at the forex market. It is very liquid, due to which currency prices can move very fast. Forex traders often use the default MACD settings of 12-26-9, as this works well for many currency forex pairs. Of course, the timeframe will differ as per your trading strategy. If you’re a day trader, you’d use a shorter timeframe (like 1-hour, 4-hour), while swing trading will need you to use a longer one (like daily, weekly).
In the equity market, the stocks of different companies have differing levels of volatility. A large-cap defence stock is typically far less volatile than a medium-cap tech stock. You’ll also notice that defensive stocks are usually less volatile than growth stocks. You’d need to adjust the MACD settings for more volatile stocks. This helps reduce false signals.
The commodities market is usually impacted by a vast range of factors. This includes supply and demand and global events. The MACD can help with trend analysis in this market. However, it's best to use it with other indicators. This gives a better overall view.
Common pitfalls and limitations
Even though the MACD is a great tool, it has limitations. Traders should be aware of these.
One major issue is false signals. In markets that are moving sideways, the MACD lines may cross over frequently. These crossovers do not lead to a new trend. This can cause a trader to enter and exit trades too often.
Over-optimisation is another risk. This happens when a trader adjusts the MACD settings to fit past data perfectly. These settings might not work well for future price action. This is called curve fitting.
The MACD is also a lagging indicator. It is based on past price information. This means it can be slow to react to sudden price changes. This can cause a trader to miss the start of a new trend.
Finally, relying solely on the MACD without context is a big mistake. The MACD should not be used alone. You should use it with other indicators and market analysis. This helps to confirm signals and avoid bad trades. For example, check the overall trend or look for support and resistance levels. This makes trading decisions more reliable.
Risk management with MACD
Proper risk management is crucial when using the MACD indicator for trading. It helps protect your capital and ensures long-term success.
A key part of this is stop loss placement. A stop loss is an order to sell a security when it reaches a certain price. This limits potential losses. When you enter a trade based on a bullish MACD crossover, you can place your stop loss below a recent swing low. This is a logical place to exit if the trend doesn't continue. If you enter a short trade based on a bearish crossover, you can place the stop loss above a recent swing high.
Another important concept is using risk/reward ratios. This ratio compares the potential loss of a trade to its potential gain. A good ratio is often 1:2 or higher. This means you risk $1 to make at least $2. This helps to ensure that even if you have losing trades, your winning trades will make up for them.
Finally, avoid overtrading and signal noise. The MACD can give many false signals in a choppy market. Overtrading means taking too many trades. This can lead to losses and emotional decisions. Not every MACD signal is a good one. It is better to wait for high-quality setups. You should confirm signals with other analysis. This helps to filter out bad signals and protect your capital.
Automation and backtesting MACD strategies
You can use platforms and tools to automate and test MACD strategies. This process involves building a MACD algorithm, also known as an algo. You then test this algo against historical data. This is called backtesting. This method shows how a strategy would have performed in the past.
Many platforms can help with this. TradingView and MT4 are two popular tools. They let you build and test your own MACD strategy. You can also find pre-built MACD algos on these platforms.
Building a MACD algo means you set rules for when to buy and sell. For example, the rule might be something like: ‘buy when the MACD line crosses above the signal line.’ The algo will execute trades based on this rule.
Backtesting is important. It helps you see the results of your strategy before you risk real money. A real case study example can show the results, like profit, loss, and drawdowns. This helps you to see if your strategy is good. It lets you fine-tune your rules. You can change settings to improve performance. This testing helps you make better trading decisions.
Ready to try out your MACD trading strategy? Open a live account.
FAQs
Is MACD a leading or lagging indicator?
The MACD is a lagging indicator. This means it's based on past price data. It uses moving averages to show momentum. Because of this, it can be slow to react to sudden price changes.
What are the limitations of MACD in volatile markets?
The main limitation of the MACD in volatile markets is false signals. Volatile markets have big, fast price swings. These can cause the MACD lines to cross over frequently, giving misleading signals. You should not rely only on the MACD in these markets. It is best to use it with other tools and analysis. This helps to get a more complete picture of the market.