RSI trading strategy: an educational guide

The relative strength index (RSI) is one of the most widely used momentum indicators in technical analysis. It measures the speed and scale of recent price movements to help identify potential overbought or oversold market conditions.
What is the relative strength index?
The relative strength index (RSI) is a momentum indicator that measures the speed and change of price movements to show whether an asset may be overbought or oversold. Although sometimes described as a leading indicator, RSI is generally viewed as a momentum-based tool that can signal changes in price strength rather than provide precise forecasts. It helps traders assess when prices may have moved sharply in one direction and could be due for a correction.
Developed by J. Welles Wilder Jr. and first published in 1978, the RSI has been widely used for decades to identify shifts in market momentum. It oscillates between 0 and 100, with readings above 70 typically seen as overbought and below 30 as oversold. However, in strongly trending markets, RSI can remain in these zones for extended periods without indicating an immediate reversal.
How is RSI calculated?
The idea behind the RSI formula is quite straightforward. RSI compares the size of recent gains with recent losses to indicate the relative strength of price momentum.
Here’s the general formula used to calculate RSI:
RSI = 100 – [100 ÷ (1 + RS)]
Here,
RS (Relative Strength) = Average gain ÷ Average loss
This formula generates a value between 0 and 100.
 Past performance is not a reliable indicator of future results.
Calculating RSI
- Choose a duration (the default setting is 14 periods, which can represent 14 days on a daily chart or 14 hours on an hourly chart).
- Work out the average of all price gains and the average of all price losses over that period. Initially, these are simple averages, but in most trading platforms, a smoothed moving average is applied in subsequent calculations for ongoing updates.
- Divide the average gain by the average loss to get RS, then insert that value into the formula to calculate RSI.
Here’s how it works:
Assume that over 14 periods, the average gain is 1.5 and the average loss is 0.75.
RS = 1.5 ÷ 0.75 = 2
RSI = 100 – [100 ÷ (1 + 2)] = 100 – 33.3 = 66.7
An RSI value of 66.7 suggests that the asset’s momentum is rising, approaching but not yet within overbought conditions (typically above 70).
Using RSI on a price chart
Plotting RSI values creates a line that oscillates between 0 and 100, helping traders visualise momentum shifts and potential trend changes.
 Past performance is not a reliable indicator of future results.
In most trading platforms, the RSI indicator can be added directly to a chart automatically, without the need for manual calculation, as the formula is already built into charting tools.
How RSI works in trading
The RSI trading strategy is widely used because it helps traders interpret momentum at a glance. Rather than tracking every price movement, traders can monitor a single oscillator value between 0 and 100 to gauge whether buying or selling pressure may be increasing.
Identifying overbought and oversold levels
RSI oscillates between 0 and 100.
- Above 70: often signals overbought conditions, suggesting prices may have risen sharply.
- Below 30: usually indicates oversold conditions, implying prices may have fallen quickly.
- Around 50: represents neutral momentum, where buying and selling pressure are relatively balanced.
 Past performance is not a reliable indicator of future results.
Understanding momentum and reversals
RSI reflects the strength and direction of recent price movements.
- When RSI trends upward, bullish momentum dominates.
- When RSI trends downward, bearish momentum prevails.
RSI can also highlight potential reversals through a pattern known as divergence, where price moves in one direction but RSI moves in the other. This may suggest fading momentum and can precede possible trend shifts – though confirmation from other indicators is generally recommended.
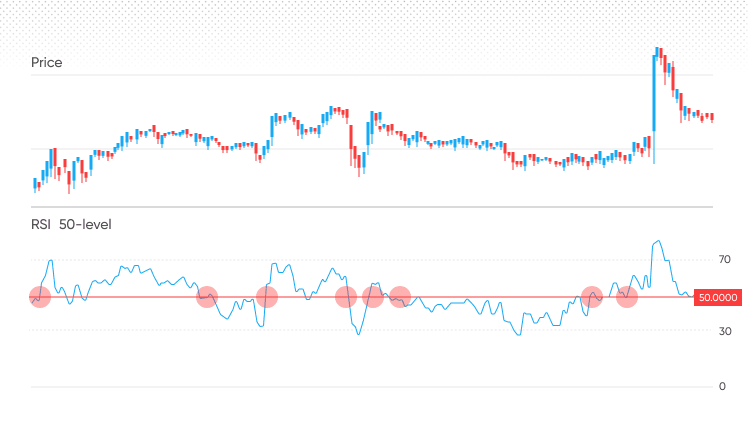
Interpreting 50-crossover and zones
The 50 level is often viewed as a key midpoint.
- Above 50: buying momentum outweighs selling momentum.
- Below 50: selling momentum outweighs buying momentum.
 Past performance is not a reliable indicator of future results.
When RSI crosses this midpoint – or when other indicators such as MACD align around the same level – it may indicate a change in trend direction.
The area above 50 is commonly referred to as the bullish zone, and the area below 50 as the bearish zone. Strong trends often keep RSI within these respective zones for extended periods, however past performance is not a reliable indicator of future results.
In essence, RSI condenses market momentum and investor sentiment into a single, easy-to-read signal, helping traders recognise when prices may be stretched in one direction and when the market might consolidate or correct.
Best RSI settings for different trading styles
RSI comes with a default setting of 14 periods, meaning the indicator analyses the past 14 price candles (minutes, hours, or days, depending on the chart). However, this setting is not fixed. For many traders, the 14-period RSI is a practical starting point, but settings are often adjusted to suit different trading styles and market conditions.
Here are several commonly used configurations:
RSI 7
A shorter period, such as 7, is often used by scalpers or high-frequency traders operating on very short timeframes (for example, 1-minute or 5-minute charts). It produces a faster, more responsive RSI, helping capture short bursts of momentum. The trade-off is that it can generate more false signals, so many traders use additional confirmation tools such as support and resistance levels, moving averages, or volume filters before acting.
RSI 14
This standard setting is the most widely used. It offers a balanced view of price momentum – responsive enough to spot changes without reacting to minor fluctuations. On daily or 4-hour charts, the 14-period RSI can indicate potential overbought or oversold conditions with less market noise.
RSI 21
For those trading over longer timeframes, such as swing or position traders, a 21-period RSI provides smoother readings. It responds more slowly, filtering out short-term volatility and emphasising longer-term momentum trends. This setting is often preferred for strategies focusing on broader market swings rather than short-term movements.
Timeframes and sensitivity
RSI behaves differently across chart timeframes. On shorter charts, price fluctuations generate more frequent RSI signals, increasing noise. For instance, a 14-period RSI on a 1-minute chart reacts far more sharply than the same setting on a daily chart, where signals are steadier. Many traders therefore adjust RSI periods or thresholds based on their chosen timeframe and the volatility of the instrument traded.
The key point is that there is no single 'best' RSI setting. The optimal configuration depends on strategy, timeframe and risk appetite. Longer periods smooth out noise to reveal broader trends, while shorter periods highlight near-term shifts. The most practical approach is to test and refine RSI settings across your preferred markets and integrate them within your trading strategy.
Core RSI trading strategies
An RSI trading strategy can be based on either the current RSI value or RSI line movements such as crossovers. Many core approaches focus on the RSI value itself.
Basic overbought/oversold strategy
This is a classic RSI trading approach.
- When RSI rises above 70, it may suggest that an asset is entering overbought territory, indicating a possible price pullback or pause.
- When RSI falls below 30, it may indicate oversold conditions, suggesting that a technical rebound could follow.
It’s a straightforward approach, but RSI can remain in these zones for extended periods during strong trends. RSI measures momentum rather than timing, so many traders confirm signals using price action or trend indicators.
50-crossover strategy
This method tends to be more reliable in trending markets. In range-bound conditions, it can generate more false signals.
- An RSI reading crossing above 50 suggests increasing bullish momentum.
- A move below 50 signals strengthening bearish momentum.
Some traders use the 50-level as a trend-confirmation filter, entering trades only in the direction indicated by RSI’s position relative to this midpoint.
RSI trendline breakout
Trendlines can be drawn directly on the RSI, just as they can on a price chart. Most platforms display RSI below the price panel.
- Connecting RSI highs or lows can help identify momentum shifts.
- When RSI breaks a trendline, it can precede a price breakout or reversal, signalling that relative strength is changing direction.
This technique is often used for early trend confirmation, especially when combined with chart patterns or volume analysis.
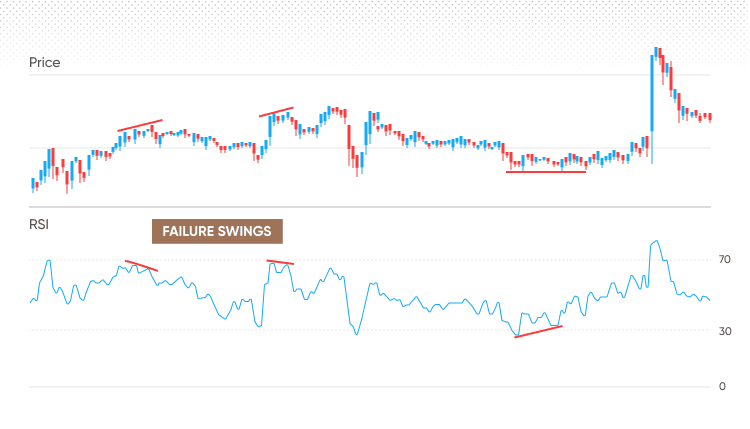
Swing rejection technique
The RSI swing rejection strategy focuses on spotting momentum reversals near extremes.
For example, if RSI is below 30 and forms a new low before rebounding, this may suggest waning downside strength. A valid signal generally requires RSI to stay above its previous low on the next dip and then move back above 30.
This rejection of oversold levels may indicate growing buying interest.
The same principle applies to overbought readings, which can signal reduced buying pressure and a potential loss of momentum.
 Past performance is not a reliable indicator of future results.
RSI range-trading
RSI can also be useful in range-bound markets:
- Identify a clearly defined price range.
- RSI near 30 and price near the bottom of the range may indicate weakening selling pressure.
- RSI near 70 and price near the top of the range may point to slowing buying momentum.
Stop-losses are typically placed outside the range to help manage false breakouts. However, stop-loss orders are not guaranteed. Guaranteed stop-loss orders incur a fee if activated.
Technical indicators such as RSI can produce unreliable signals and should be combined with additional tools as part of a broader trading strategy. Past performance is not a reliable indicator of future results.
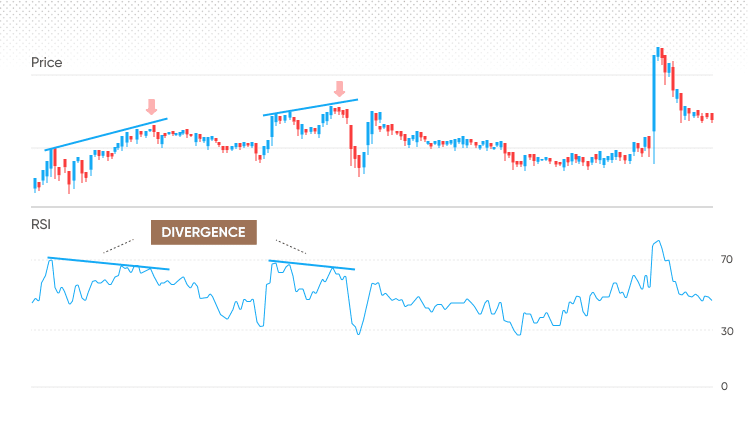
RSI divergence strategy
This is a more advanced RSI technique. Divergence occurs when price action and RSI move in opposite directions, meaning the indicator and chart reflect different momentum conditions. Traders often view this as an early sign of weakening trend strength. There are two main types: regular divergence and hidden divergence.
 Past performance is not a reliable indicator of future results.
Bullish vs bearish divergence
- A bearish divergence forms when price makes a new high but RSI records a lower high, indicating that upward momentum is weakening and the trend may be due for a pause or correction.
- A bullish divergence appears when price makes a new low while RSI forms a higher low, suggesting that downward momentum is easing and a potential trend shift could follow.
These signals are generally more meaningful when they occur in overbought or oversold regions (above 70 or below 30), particularly when supported by price structure or volume confirmation.
Hidden divergence
Hidden divergence tends to indicate trend continuation rather than reversal.
- Hidden bullish divergence occurs when price makes a higher low while RSI makes a lower low, suggesting that upward momentum remains intact.
- Hidden bearish divergence appears when price makes a lower high while RSI makes a higher high, indicating that downward momentum is likely to persist.
How to spot and confirm divergence
Divergence signals do not guarantee reversals but can offer an early indication of shifting momentum. Many traders seek confirmation through additional evidence such as breakouts, candlestick formations, volume signals, or support/resistance reactions.
- A simplified method for identifying RSI divergence:
- Identify a new high or low in the price action.
- Compare it with the corresponding RSI reading.
- Look for discrepancies between price and RSI direction.
- Confirm the observation with another indicator or price-action test.
Combining RSI with other indicators
On its own, RSI is a useful momentum indicator. However, many traders combine it with other tools to filter out noise and confirm signals. RSI can be viewed as one part of a broader analytical framework. When aligned with complementary indicators, it can offer clearer and more consistent insights.
RSI + MACD
The moving average convergence divergence (MACD) measures trend direction and strength using moving average crossovers. When RSI and MACD show similar momentum conditions, the signal is generally considered more robust.
- For example, if RSI indicates oversold momentum and MACD crosses above its signal line, this may reinforce a potential upward shift.
- If MACD turns lower while RSI is at or above 70, it could point to fading bullish momentum and the possibility of a short-term pullback.
Traders often use MACD for trend bias and RSI for momentum context, combining both to create a more complete view of market strength.
RSI + Bollinger Bands®
Bollinger Bands® measure volatility by showing how far price moves from its moving average. When used with RSI, they can help identify potential exhaustion points.
- If price touches the upper band while RSI is above 70, this may suggest overextension.
- When price reaches the lower band and RSI is below 30, it can indicate a potential rebound area.
In more volatile conditions, traders often wait for price to move back within the bands before confirming a potential shift in direction.
RSI + stochastic oscillator
RSI and the stochastic oscillator both measure momentum, though they use different calculations. When both indicate overbought or oversold conditions, the alignment can add weight to a signal.
Because both track momentum, some overlap is likely, so this combination tends to work best when supported by trend filters or price structure analysis.
RSI + moving averages
Moving averages help assess the underlying trend direction. Some traders only act on RSI-based signals when they align with the broader trend – for instance, considering RSI dips below 30 as temporary within an uptrend if price remains above a long-term moving average (e.g., 200-period MA).
This approach aims to keep analysis consistent with overall market direction, helping distinguish between retracements and reversals.
No single indicator is definitive. Combining RSI with a complementary tool – such as a trend filter or volatility measure – can enhance context and signal reliability while reducing false positives.
Advanced RSI techniques
These techniques take RSI analysis a step further, though they typically require experience and consistent application.
RSI trendlines
Drawing trendlines directly on RSI can reveal early momentum changes. A break of an RSI trendline may precede a corresponding price breakout, highlighting potential shifts in underlying strength. However, RSI trendline breaks should be confirmed with price or volume data before being considered reliable.
Double confirmation method
This is a more conservative approach. RSI provides the initial signal (for example, a divergence), while a secondary indicator – such as a candlestick pattern or MACD crossover – is used for confirmation. Applying multiple filters can help reduce false signals, although it may delay confirmation, making this method suitable for those who prioritise accuracy over speed.
Connors RSI (CRSI)
The Connors RSI (CRSI) is a modified version of the standard RSI, developed by Larry Connors for short-term analysis. It combines three components:
- A short-term RSI (usually 3 periods)
- The number of consecutive up or down closes (streak length)
- The rate of price change (ROC)
By integrating these factors, CRSI produces faster, more responsive momentum readings. It is often used to identify short-term overbought or oversold conditions within broader trends.
RSI filtering with candlestick patterns
This approach combines RSI readings with candlestick pattern confirmation. When RSI exits an extreme zone and a reversal pattern forms at the same time, the setup gains additional weight.
For example:
- When RSI is oversold and a bullish engulfing or hammer appears, it may signal improving upward momentum.
- When RSI is overbought and a bearish engulfing or shooting star forms, it may suggest weakening buying pressure.
Using RSI alongside candlestick analysis allows traders to visually confirm changes in market sentiment rather than relying solely on indicator values.
Risk management with RSI
RSI is a useful analytical tool, but like all indicators, it has limitations. It measures momentum, yet signals can be unreliable during strong trends or volatile conditions, making risk management a key element of any trading plan.
Avoiding false signals
RSI can stay overbought or oversold for prolonged periods, especially in trending markets. A reading above 70 doesn’t necessarily indicate an imminent reversal, and premature action can result in avoidable losses. To reduce this risk, many traders wait for confirmation, such as a price breakout, candlestick reversal, or volume increase, before acting on RSI signals.
Stop-loss placement
A stop-loss order can help limit downside exposure when a signal fails. In RSI-based setups, stops are typically placed beyond a recent high or low.*
- After an oversold reading, a stop may be set just below the latest swing low.
- After an overbought reading, a stop may sit above the recent swing high.
This approach helps contain losses and promotes consistency in execution.
*Stop-loss orders are not guaranteed, while guaranteed stop-loss orders incur a fee if activated.
Using RSI in context
RSI is most effective when applied within a broader market framework that considers trend direction, volatility and volume.
For example:
- In a strong uptrend, RSI may remain overbought while prices continue to rise. It may therefore be more effective to focus on setups aligned with the dominant trend rather than attempting to anticipate reversals.
- In volatile markets, RSI readings can fluctuate sharply, while in range-bound conditions, they tend to flatten. Adjusting RSI periods or thresholds to reflect changing conditions can improve reliability.
- When RSI signals coincide with higher trading volume, they may carry greater significance. In contrast, low-volume conditions can produce less reliable signals.
RSI should be viewed as one component of a comprehensive trading plan, not a standalone system. Combining RSI with protective stops, position sizing, and an understanding of market structure can improve analytical balance and help maintain risk control.
Backtesting and performance stats
Before applying any RSI strategy in live markets, it’s important to test it using historical data, a process known as backtesting. While this doesn’t predict future results, it helps reveal how a strategy might have performed under different market conditions. A safe way to begin is by testing on a demo account.
Understanding backtests
RSI often performs more effectively in ranging or mean-reverting markets. For example, the basic approach of buying when RSI drops below 30 and selling when it rises above 70 can work reasonably well when prices move between support and resistance levels.
However, in strong trends, these signals can be less reliable. During a robust uptrend, RSI may stay overbought for extended periods, while price continues to climb. Selling each time RSI exceeds 70 may therefore result in missed opportunities within ongoing trends.
Different settings give different RSI backtest results
As discussed earlier, RSI performance varies depending on the chosen settings:
- RSI-7 produces frequent signals but is more prone to false readings due to its higher sensitivity.
- RSI-14, the standard setting, offers a balanced combination of responsiveness and reliability.
- RSI-21 provides fewer but smoother signals, filtering out short-term fluctuations.
The optimal configuration depends on market volatility, timeframe and asset type.
Why testing matters
Backtesting helps ensure that an RSI approach is supported by data rather than assumption. It highlights where a setup performs well and where it falls short. You may find that incorporating a trend or volume filter refines results, or that certain RSI configurations perform better on forex or equity indices than on commodities.
Although backtesting cannot guarantee future outcomes, it demonstrates how a strategy behaves in varied conditions. This allows for better understanding of its strengths, weaknesses and limitations before applying it to live markets.
Final note: Start by refining your RSI setup on a demo account to assess performance safely, then transition to live markets only once the strategy has been thoroughly tested and understood.
FAQ
What is the best RSI setting for trading?
There isn’t a single 'best' RSI setting. The standard 14-period RSI is the most widely used as it offers a balance between responsiveness and stability. Shorter settings, such as RSI-7, generate faster signals but can be more volatile, while longer settings, like RSI-21, provide smoother readings suited to longer-term analysis.
How reliable is RSI in strong trends?
RSI can be less dependable during strong trends, as it may remain overbought or oversold for extended periods. In these conditions, it may be more effective to use RSI alongside trend indicators, such as moving averages or MACD, to help determine whether momentum is continuing or beginning to weaken.
What does RSI divergence mean?
Divergence occurs when price and RSI move in opposite directions, indicating a possible change in momentum. A bullish divergence forms when price makes a new low but RSI records a higher low, while a bearish divergence appears when price makes a new high but RSI forms a lower high. These signals should be confirmed using other indicators or price structures before being considered significant.
Can RSI be used for both short-term and long-term trading?
Yes. RSI can be applied across different timeframes, though its behaviour varies with the chart period. On shorter charts, it produces more frequent and sensitive readings, while on longer-term charts, signals are smoother and more stable. Adjusting RSI periods and thresholds to match the selected timeframe can improve reliability.
How can false RSI signals be reduced?
False signals can occur when RSI briefly enters overbought or oversold zones without a sustained trend change. To minimise this, many traders wait for confirmation – such as a price breakout, candlestick reversal, or volume increase – before taking action. Combining RSI with a trend or volatility filter can also enhance signal reliability.