What is an average true range (ATR) trading strategy?

The average true range, or ATR, is a technical analysis tool which is used to measure a market’s volatility. In this guide, you can learn more about it and how it can be applied in your strategies.
What is the average true range (ATR) indicator?
Average true range (ATR) is a technical analysis indicator that measures price volatility of a financial security over a period of time, typically 14 days.
ATR is calculated as the average of the true ranges over the period. It’s a measure of volatility, not a directional indicator. A higher ATR signals more volatility, and vice versa.
Highlights
-
The average true range is designed to measure the volatility of a market.
-
ATR can be used to help trader’s evaluation on setting stop-loss* and take-profit limits and can be used in conjunction with a range of other technical indicators and trading strategies.
-
The average true range cannot predict the future, so traders will still need to do their own research.
*Stop-losses may not be guaranteed.
How to use the average true range indicator
ATR was created in 1978 by technical analyst J. Welles Wilder, Jr., and published in his book, "New Concepts In Technical Trading Systems."
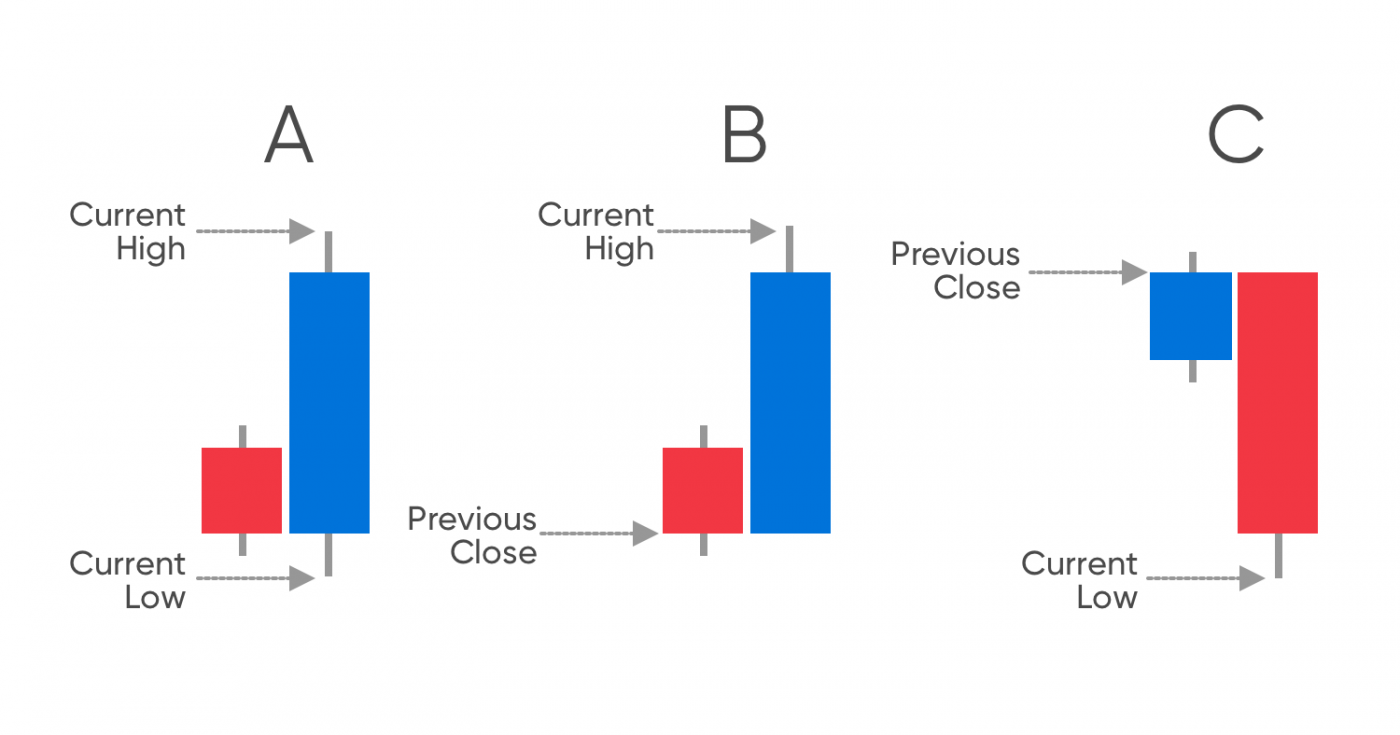
If someone wants to calculate the average true range, they need to take the following three components into account:
-
The difference between the current high and the previous close
-
The difference between the current low and the previous close
-
The difference between the current high and the current low
After calculating those figures, they should choose the highest one. This is the true range, or TR.
 *Past performance is not a reliable indicator of future results
Once they have found the true range, they will need to take a number of time periods. These can be hours, days, weeks, months or even years. In his book, Wilder suggested 14 time periods. This is the most commonly used number, although traders can use more or fewer if they wish.
They should then calculate the true range of those time periods (for example, of 14 days), and find the average of them. This final number is the average true range and shows the average price movement for the time period involved.
ATR formula
Alternatively, ATR can be calculated using the following formula:
ATR = (Previous ATR * (n - 1) + TR) / n]
Where
n=number of periods
TR= True Range
Average true range trading example
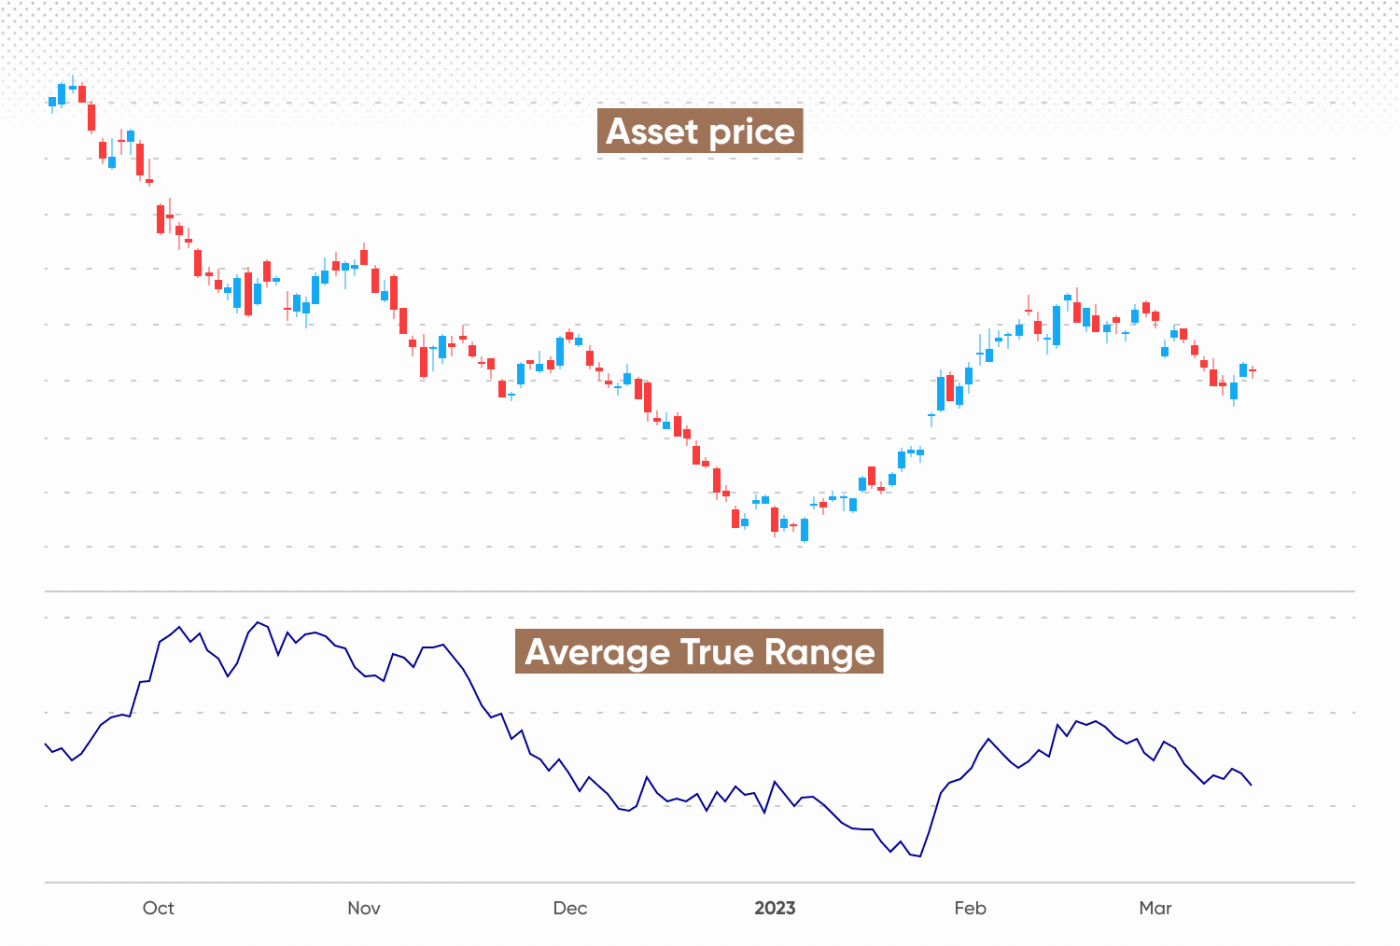
Let’s now take a quick look at a real world example of the average true range. The indicator is available on most trading platforms and will show up as a separate panel below the price chart.
 *Past performance is not a reliable indicator of future results
As you can tell by looking at the image, the ATR does not exactly mirror the price. However, it does show when the price would have been the most volatile. Indeed, if we look at the chart, we can see that, when the asset was at its highest price, it had something of a mid-range amount of volatility.
Something else worth noting is that the average true range is written as an absolute value, rather than as a percentage. This means that an asset that is hovering around that $1,000 mark will have a higher ATR than one which is worth somewhere in the region of $10.
As a result, the first could register a more notable change in its ATR by rising by $100 than the second would by $5, despite the first asset going up by 10% and the second by 50%. Traders should be aware of this and not use ATR measurements in isolation when devising their average true range strategy.
ATR trading strategy: How to use ATR in trading
The average true range is a tool which could, potentially, help traders when they develop a trading strategy.
-
Day trading: It is not uncommon for the ATR indicator strategy to be used by day traders. The idea is to use short time periods to assess the ATR, and then to add that to a closing price.
-
Range trading strategy: The ATR can be used to work out a range trading plan. Since range trading relies on finding a particular range in which to trade in, using the ATR to measure the market’s volatility can help when it comes to knowing what sort of range to trade in.
-
Breakout strategy: Using an ATR trading strategy can be useful when combined with a breakout strategy. This means that a trader can use the indicator to see when an asset breaks out of a low volatility level, since this often precedes a sharp movement in price.
-
Momentum trading: Using the average true range indicator can, be informative when it comes to momentum trading. The ATR would typically rise when an asset’s price is likely to move quicker than before, which can lead to a momentum - either bullish or bearish.
How to use ATR to set a stop-loss and take-profit
The ATR indicator is often used in conjunction with stop-loss orders. Stop-losses are market orders that would exit a losing trade at a predetermined price. Note that ordinary stop-losses do not shield from slippage – in this case, guaranteed stop-losses may offer more protection, yet charge a fee.
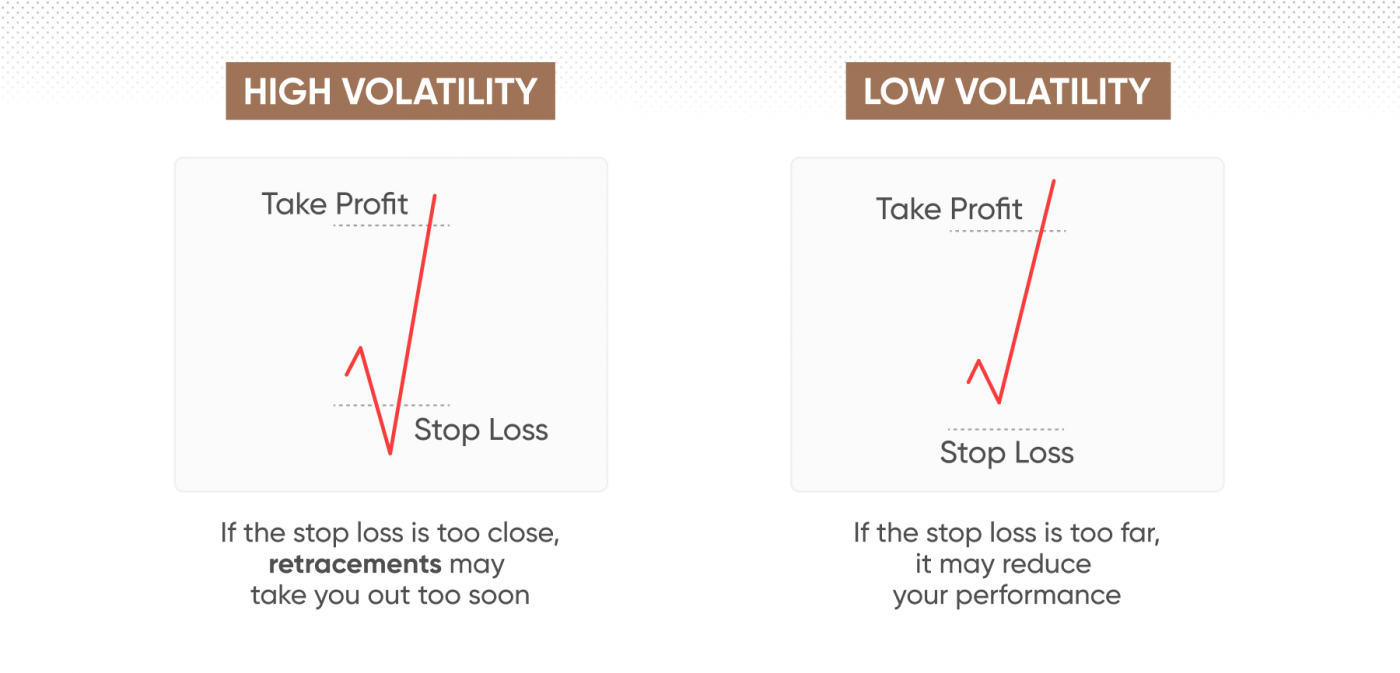
When the ATR is high, traders could potentially be prepared for greater volatility and wider price fluctuations. As a result, they could set their stop-loss orders higher, because they might well think that price changes are to be expected, and that the market could, potentially make a recovery.
On the other hand, when the ATR indicates lower volatility, traders may use a smaller stop-loss figure, because they could predict there may not be that much of a likelihood of a quick recovery from a market low.
Likewise, ATR can be used to set take-profit orders, market orders to close a winning position triggered at a predetermined price. When the volatility is high, traders may want to set the take profit order higher, because there is the possibility that the market could continue to rise and, similarly, when the volatility is low, then they may consider setting it lower because it is possible that the market may not continue to move upwards as much.
 *Past performance is not a reliable indicator of future results
ATR for position sizing
It can also be used for position sizing, with the ATR used to find which assets in a traders portfolio are the most volatile and with the size of trades adjusted accordingly.
The idea here is to calculate the average true range for each of the assets in a trader’s portfolio. If an asset has a high volatility, then the trader may be best off if they made smaller trades, because a more likely market move could potentially wipe out any gains.
Often, traders who use position sizing will apply the same formula, utilising how much they are willing to risk in order to calculate the size of their trades.
Doing so requires using a formula to calculate a position size. This would be the sum of the percentage of the trader’s account they were willing to risk divided by the average true range.
In terms of a formula, it would be:
A/B,
where
A=percentage of trading account the trader is willing to risk and
B=ATR.
Average true range and other indicators
The average true range can be used in conjunction with other technical analysis tools. For instance, the range of stochastic indicators, tools which are used to measure the overall momentum of an asset's price, are often used with the ATR. This is because the ATR can counteract stochastic tools’ tendency to send false signals in markets which do not hover between two particular price points. Likewise, stochastic’s ability to suggest when an asset is either overbought or oversold can help clarify the movements of the average true range.
The parabolic SAR, a tool designed to show market movements and suggest entry and exit points was also created by Wilder and can work with the ATR. This is because the parabolic SAR can show what direction the market has been moving in which, coupled with the way in which ATR demonstrates the overall market volatility, can help bring some clarity to the two indicators’ signals.
Since the ATR is often used by traders to help them find an exit point, then a tool like moving average convergence/divergence (MACD), which is often used to signify entry points and changes in momentum. It can also be utilised with other volatility indicators, such as Bollinger Bands® (BB), to determine reversals in price.
Conclusion
The average true range is a technical analysis tool which can be used to measure the overall volatility of a market.
The ATR can be calculated by finding the true ranges for a fixed set of time periods, usually the most recent 14. ATR can be used in various trading strategies including day trading, range trading, momentum trading, working with a breakout strategy, and many more.
It can help traders inform when and where may be a good place and time to set their stop-loss and take-profit orders. It can be used in conjunction with other indicators, such as stochastic indicators, parabolic SAR, MACD and Bollinger Bands®.
What it cannot do, however, is tell the future. That is why traders need to make sure to do their own research, remember that markets can move in directions which damage their positions, and never trade with more money than they can afford to lose.
FAQs
How does the average true range work?
The average true range works by finding the true range – the largest of the differences between the current high and the previous close, the current low and the current high and the current low for a set of time periods, adding them together, and dividing them by the number of time periods. The ATR is a measure of volatility.
How to read the average true range?
The average true range is represented by a line on a chart, typically in a separate panel below the price chart, with the highs representing high volatility and the lows representing low volatility.
How can ATR be used to set stop-loss and take-profit levels?
ATR can be used to set stop-loss and take profit levels because it demonstrates how volatile a market is. A trader may want to expand their stop-loss and take-profit levels if the ATR is showing high volatility and restrict them if it is showing low volatility.
What are some common trading strategies that use ATR?
The average true range can be used in a variety of trading strategies, including day trading, breakout trading, momentum trading, and more.