What is the stochastic indicator?
What is the stochastic indicator?
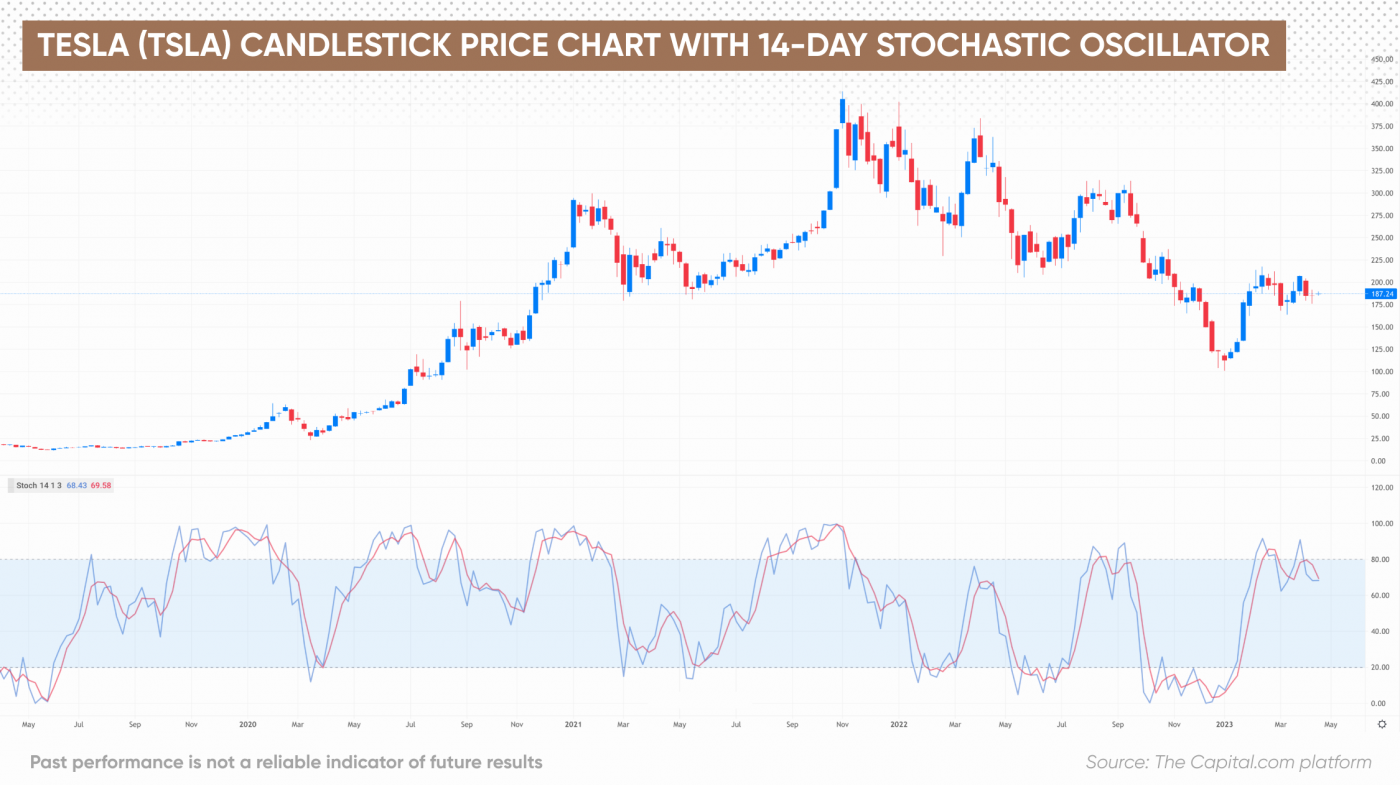
The stochastic oscillator, also known as the stochastic indicator, is a momentum indicator that compares an asset’s close price with its high to low prices over a certain time period, typically 14 days.
The indicator illustrates overbought and oversold levels and is designed to provide traders with potential buy/sell signals, depending on the price momentum. The time frames used can be as short as minutes or hours, or as long as days, weeks and months.
The idea underpinning the indicator is that in a market trending upward, prices may close near the high, and in a market trending downward they may close near the low.
Highlights
-
The stochastic oscillator is a market momentum measure that compares a security’s closing price with the range of its high to low prices over a certain time period to determine likely turning points in that asset's value.
-
The stochastic oscillator formula is %K = 100 (C - L14) / (H14 - L14); where %K is the asset’s current market rate, C is the most recent closing price, L14 is the low price of the last 14 trading days, and H14 is the highest price point of the same period.
-
The oscillator may be used alongside other technical analysis tools, such as moving averages, fibonacci levels and candlestick patterns to identify if an instrument is overbought or oversold.
How to use the stochastic oscillator
The stochastic oscillator uses the following formula:
%K = 100 (C - L14) / (H14 - L14)
This is where:
-
%K is the current market rate of the asset being traded.
-
C is the most recent closing price.
-
L14 is the low price of the 14 previous trading days.
-
H14 is the highest price point of the same 14 trading sessions.
The stochastic oscillator is not complete without %D. This is the indicator we follow most closely and is the three-day moving average (MA) of %K (or the average of the past three values of %K, if %K is being measured in any time period other than days).

The stochastic oscillator is bounded between the 0 and 100 range and is displayed as two lines %K and %D.
The %K line is the measure of the price momentum, while the %D line is a moving average of %K.
The %D line is generally considered more important, as it produces more accurate trading signals.
The %K is calculated by taking the range of the current closing price and the lowest low, and dividing that by the total range of the market (highest high minus the lowest low), and multiplying this factor by 100.
The %D line is a (typically) three-unit period simple moving average of the %K line.
Applying stochastic oscillator strategy in trading
Traditionally, when %D falls below the 20 mark it suggests the market is oversold. Conversely, when the oscillator exceeds the 80 mark, the asset is considered overbought.
Divergences occur when a new high or low in price is not confirmed by the stochastic oscillator.
A bullish divergence occurs when price records a lower low, but the stochastic oscillator forms a higher low. This shows less downside momentum and could be foreshadowing a bullish reversal.
A bearish divergence forms when price records a higher high, but the stochastic oscillator forms a lower high. This shows less upside momentum and could foreshadow a bearish reversal.
The stochastic oscillator is useful for traders as it generates signals that indicate whether an asset is overbought or oversold. When assets are either overbought or oversold, it is expected that a price reversal may be imminent.
According to the strategy, the longer an asset is overbought, the more likely it is to go down in price, once the market realises that the price is inflated and not representative of the inherent security. On the other hand, the longer an asset is oversold, the greater the likelihood that the price will start a bull run. The stochastic oscillator could then be used to gauge when a price reversal is likely to occur.
Stochastic oscillator strategies
Moving averages
 price chart with moving average indicator and 14-day stochastic oscillator")
When trading contracts for difference (CFDs) in stocks, a trader may use a combination of the stochastic oscillator and MAs.
This stochastic trading strategy would include identifying the trend of the stock using the MAs. If the MAs indicated a bullish trend, the trader would look to the stochastic oscillator for confirmation.
Conversely, if the moving averages indicate a bearish trend, the trader would look to the stochastic oscillator for confirmation.
Fibonacci levels
This stochastic indicator strategy combines the use of the stochastic oscillator and Fibonacci levels to identify potential entry and exit points. The Fibonacci levels are a series of levels used to identify support and resistance levels in the market.
When the stochastic oscillator is below 20, it may be an indication that the market is oversold. When the stochastic oscillator is above 80, it may be an indication that the market is overbought.
When the stochastic oscillator is between 20 and 80, traders could use Fibonacci levels to identify potential entry and exit points.
Candlestick patterns
This stochastic oscillator trading strategy involves combining the use of the stochastic oscillator and candlestick patterns to identify potential trades. Candlestick patterns are used to identify potential changes in market direction.
The strategy involves first identifying overbought and oversold levels using the stochastic oscillator. When the stochastic oscillator is above 80, it is considered overbought and when it is below 20, it is considered oversold. Once these levels are identified, traders will then look for potential reversal signals using candlestick patterns. Common reversal patterns include the hammer, doji and engulfing patterns.
It may be used on all timeframes and markets, although it is more effective on higher time frames such as the daily chart. This strategy is suitable for both short-term and long-term traders, as the signals generated could be used for both swing trading and trend trading.
Conclusion
The stochastic oscillator is a momentum indicator used in technical analysis that measures the momentum of a financial instrument, such as a stock, currency pair, or commodity, by comparing its current closing price to its past closing prices over a given period of time.
It is usually plotted as two lines, one representing the current closing price and the other representing the average closing price over the period. The oscillator then moves between 0 and 100, with readings above 80 indicating that the security is overbought and readings below 20 indicating that the security is oversold.
Understanding how the stochastic indicator works and how to read the indicator may help traders make better informed decisions in their trading. However, it is important to remember that no trading strategy is risk free.
Traders should ensure that they do their own research before making any decision and should always avoid trading with more money than they can afford to lose.
FAQs
What does the stochastic indicator mean?
The stochastic indicator could be explained as a momentum oscillator that measures the speed and direction of price movements. It is used to identify overbought and oversold conditions in the market, as well as potential trend reversals.
Is the stochastic indicator a leading indicator?
Yes, the stochastic oscillator is a leading indicator, meaning that it may signal future price movements.
What is the best time frame for the stochastic oscillator?
The best time frame for the stochastic oscillator depends on the type of trading stochastic oscillator strategy you are using. For long-term trading strategies, a longer time frame such as the weekly or monthly chart may be preferable. Whereas for shorter-term stochastic trading strategies, a shorter time frame such as the daily or hourly chart could work best.
Why is the stochastic oscillator useful for traders?
The stochastic oscillator could be used by traders to identify momentum in price movements and determine potential entry and exit points. It measures the momentum and velocity of price movements by comparing a closing price to its recent price range over a given period.