Moving average trading strategy: an educational guide

Enhance your trading experience with moving averages. Discover how to use different types and strategies to identify trends, support and resistance, and more.
What is a moving average trading strategy?
A moving average trading strategy is a widely-used technical analysis method that utilises the moving average (MA) of a security's price to identify potential market trends. The moving average calculates the average price of a security over a specified period. By smoothing out price fluctuations, it can help traders discern underlying trends and gauge the overall market sentiment.
Highlights
-
A moving average trading strategy is a popular technical analysis method used by traders to identify potential market trends using the moving average (MA) of an asset’s price.
-
Traders can use moving averages in different ways, such as choosing the right time frame, identifying a trend, determining support and resistance.
-
Different types of moving averages include simple moving average (SMA), exponential moving average (EMA), and weighted moving average (WMA).
-
The key moving average trading strategies are crossover, envelope and ribbon.
Moving average explained
The moving average is a versatile and easily customisable technical indicator, allowing traders to choose from various types and timeframes to design a personalised moving average strategy.
In the 1920s and 1930s, moving averages gained prominence as a popular trading tool, thanks in part to the work of Richard Schabacker and Robert Rhea, who introduced the concept of trend-following.
The idea behind this approach is that traders can capitalise on sustained price movements by identifying and following trends using moving averages.
How to trade with a moving average
Below are some ways of how to use the moving average indicator to enhance your trading experience.
- Choosing the right time frame
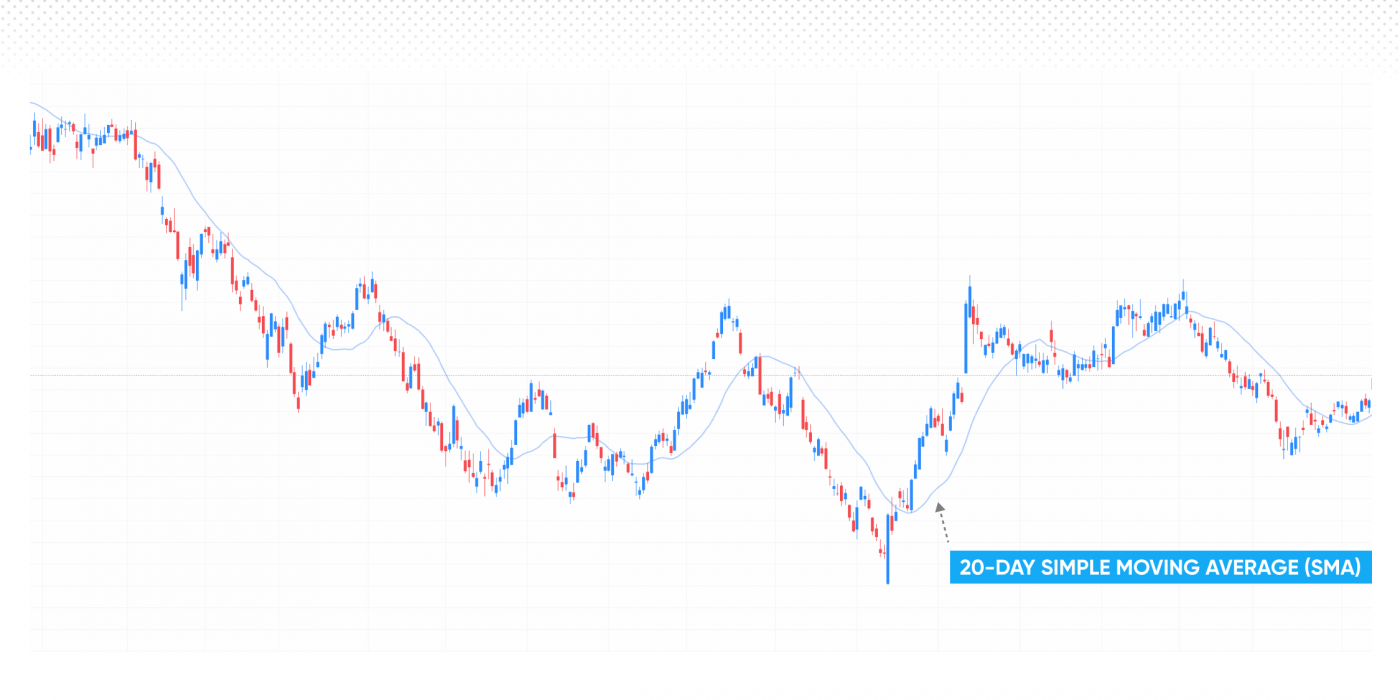
Moving average is available on most trading platforms, and appears as a line that follows a chart. For example, on the chart below, a 20-day moving average is shown as a blue line following the candle chart.
Traders can choose between multiple time frames, also known as the “look-back” periods, and can range from a few hours to several months. Shorter timeframes may make the moving average indicator more sensitive to price movements, while longer time frames may provide a smoother indication of the underlying trend.
 *Past performance is not a reliable indicator of future results
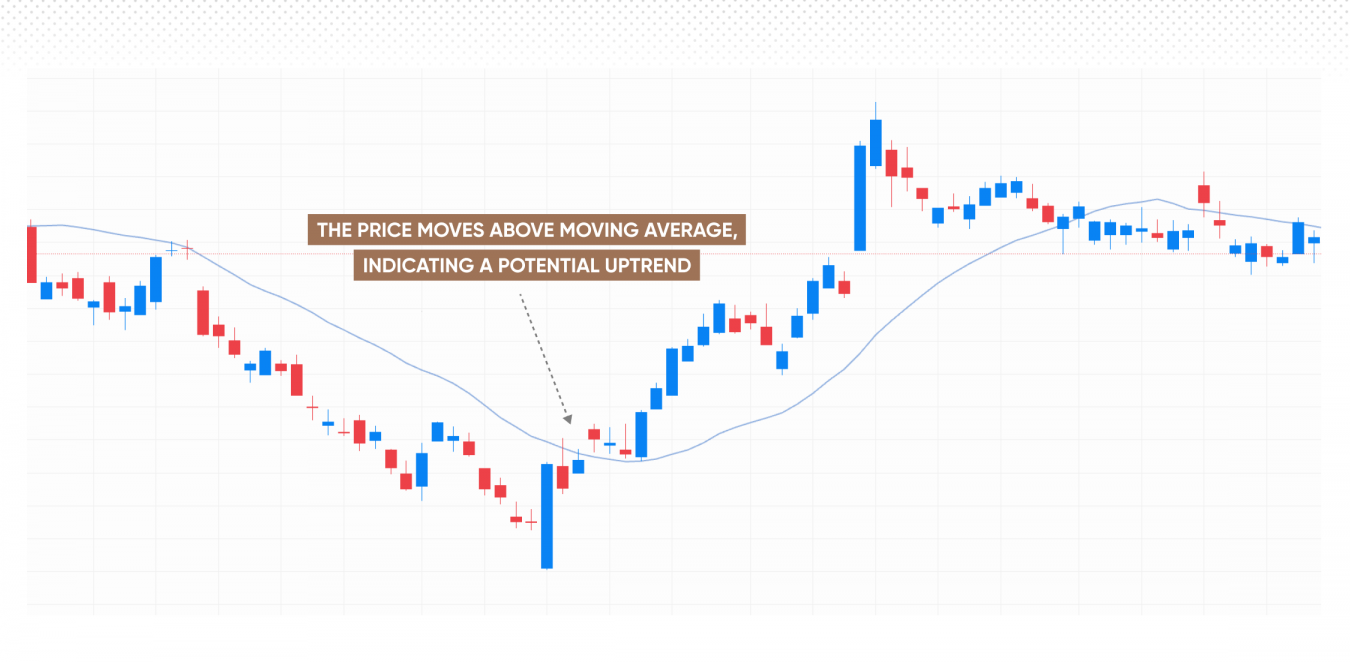
- Identifying a trend
As its original use suggests, moving averages are widely used to identify price trends. When the price moves above the moving average, it is considered to signal a potential uptrend, while a price movement below the moving average may indicate a possible downtrend. Additionally, the slope of the moving average can provide information about the momentum of the trend.
 *Past performance is not a reliable indicator of future results
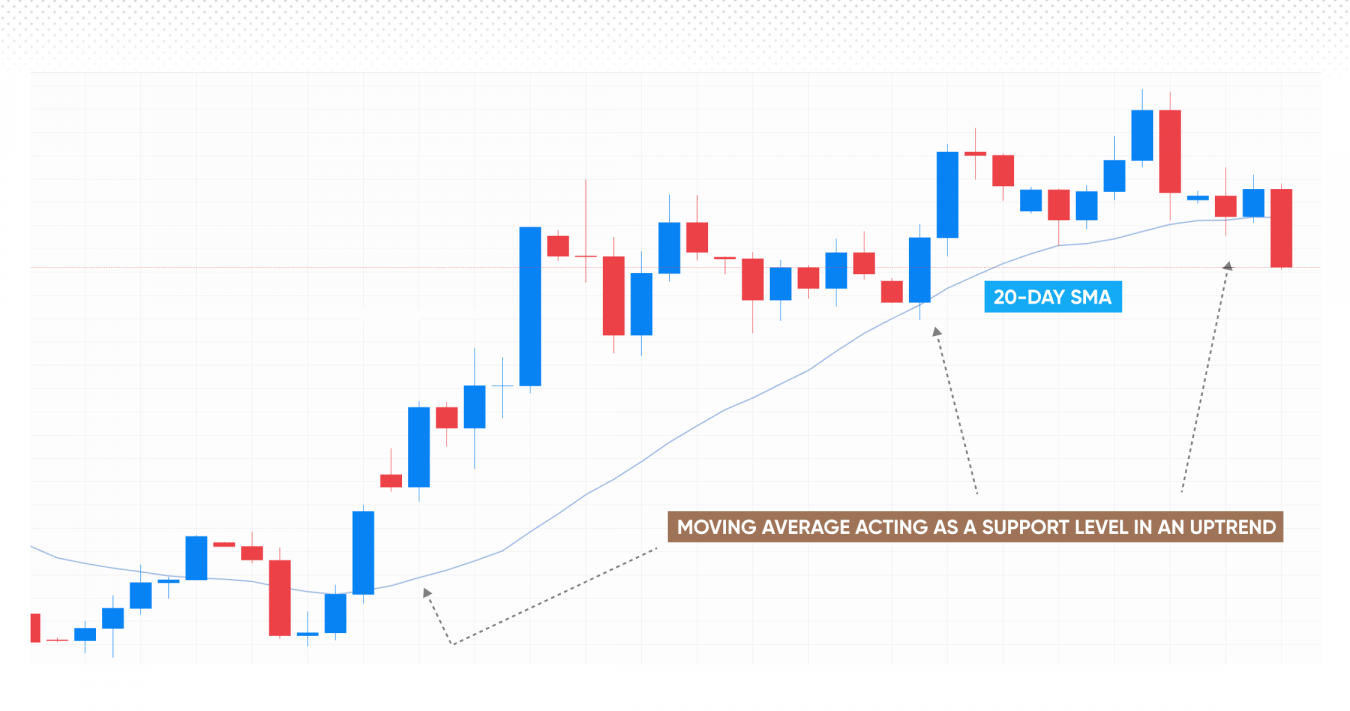
- Determining support and resistance
Moving averages can also act as dynamic support and resistance levels. In an uptrend, the moving average may act as a support level, where prices tend to bounce off and continue the upward movement. Conversely, in a downtrend, the moving average can serve as a resistance level, causing prices to reverse their downward trajectory.
This feature of moving averages can help traders identify entry and exit points, set stop-losses and take-profit orders. Note that ordinary stop-losses do not protect from slippage. A guaranteed stop-loss may be used, yet it comes at a fee.
 *Past performance is not a reliable indicator of future results
Using different types of moving averages
Over the years, various types of moving averages have been developed to cater to different trading styles and objectives. For instance, the simple moving average (SMA) was followed by the introduction of the exponential moving average (EMA) by J. Welles Wilder Jr. in the 1970s, which gives more weight to recent price data, making it more responsive to current market conditions. In addition, the weighted moving average (WMA) was developed to further emphasise specific periods in the calculation.
How to calculate a moving average
Depending on the type, there will be a different moving average formula.
- Simple moving average (SMA) formula
The simple moving average (SMA) is the most basic and widely used type of moving average. It’s calculated by taking the arithmetic mean of a given set of prices or data points over a specified period.
The formula for the SMA is:
SMA = (P1 + P2 + ... + Pn) / n
Where
P1, P2, ... , Pn = prices of data points
n = number of periods
The SMA gives equal weight to each price point and smoothes out price fluctuations to reveal the underlying trend. However, one limitation of the SMA is that it can be slow to react to recent price changes, making it less responsive to sudden market movements.
-
Exponential moving average (EMA) formula
The exponential moving average (EMA) is a more advanced type of the moving average indicator that gives more weight to recent price data, making it more responsive to new market information.
The formula for the EMA is:
EMA = (Close - Previous EMA) * (2 / (n + 1)) + Previous EMA
Where
Close = current closing price
Previous EMA = previous period's EMA value
n = number of periods
The EMA reacts more quickly to recent price changes, providing traders with a faster signal for potential trend reversals or continuations. However, the increased sensitivity may also lead to more false signals compared to the SMA.
-
Weighted moving average (WMA) formula
The weighted moving average (WMA) assigns different weights to each price point. Similarly to EMA it typically places more importance on recent data, yet they differ in the way they calculate the average and assign weights to the data points.
The formula for the WMA is:
WMA = (P1 * n + P2 * (n - 1) + ... + Pn * 1) / (n * (n + 1) / 2)
Where
P1, P2, ... , Pn = prices of the data points
n = number of periods.
Unlike the SMA, which assigns equal weight to all data points, and the EMA, which uses an exponential smoothing formula, the WMA calculates the average by multiplying each price point by a weight factor that decreases in value as the data becomes older.
This gives the WMA a quicker response to price changes than the SMA and a more customisable weighting system than the EMA. However, similar to the EMA, the increased sensitivity of the WMA can result in more false signals.
Moving average crossover strategy
The moving average crossover strategy is based on the principle that when two moving averages of different periods cross each other, it indicates a potential change in the market trend.
A crossover occurs when a short-term moving average crosses a long-term moving average. The short-term moving average is more sensitive to recent price changes, whereas the long-term moving average is less sensitive and provides a smoother representation of the price trend. When they intersect, it can signal a shift in market sentiment, indicating that the trend might be reversing or accelerating.
There are two primary types of moving average crossovers: bullish crossover and bearish crossover. Each crossover type signals a different market scenario.
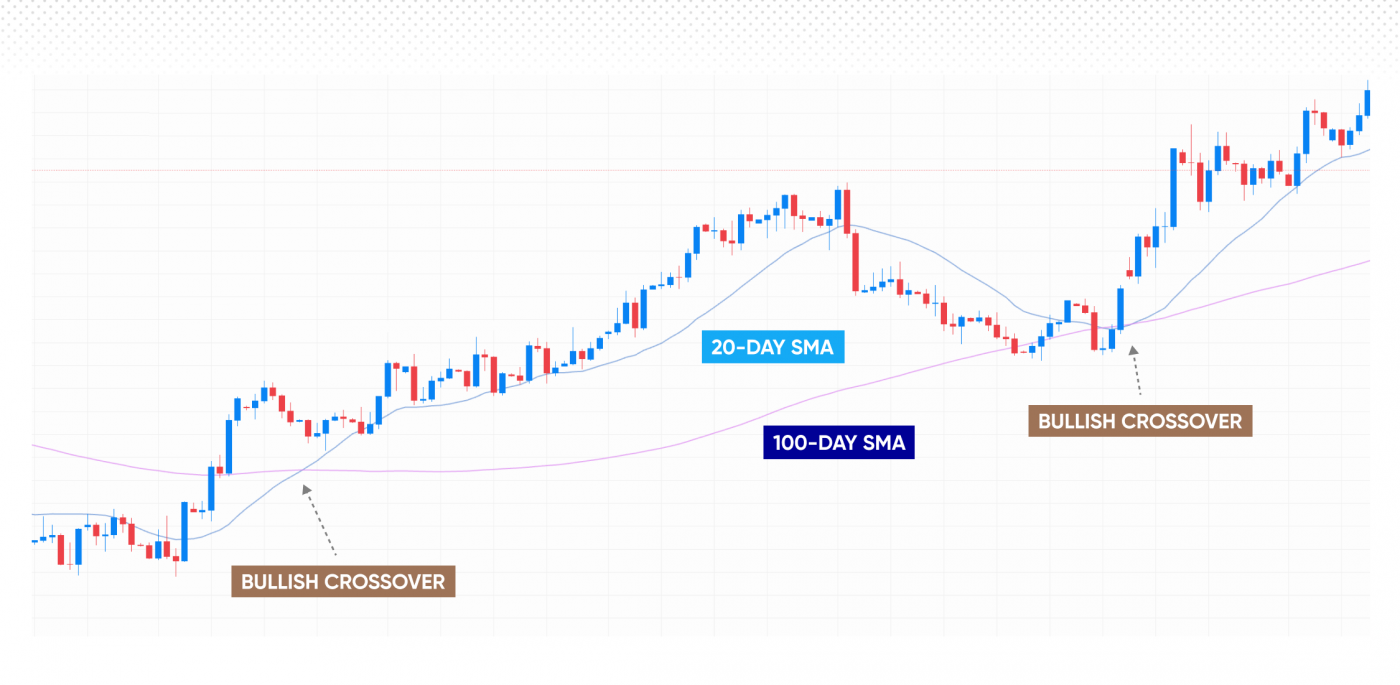
Bullish crossover
A bullish crossover occurs when the short-term moving average crosses above the long-term moving average. This event signifies that the recent price momentum is stronger than the historical trend, which may indicate that the market is entering a bullish phase.
Traders typically interpret a bullish crossover as a buy signal, suggesting they may enter a long position or add to an existing one. Bullish crossovers can occur with different types of moving averages, such as simple, exponential, or weighted moving averages, depending on the trader's preference and strategy.
 *Past performance is not a reliable indicator of future results
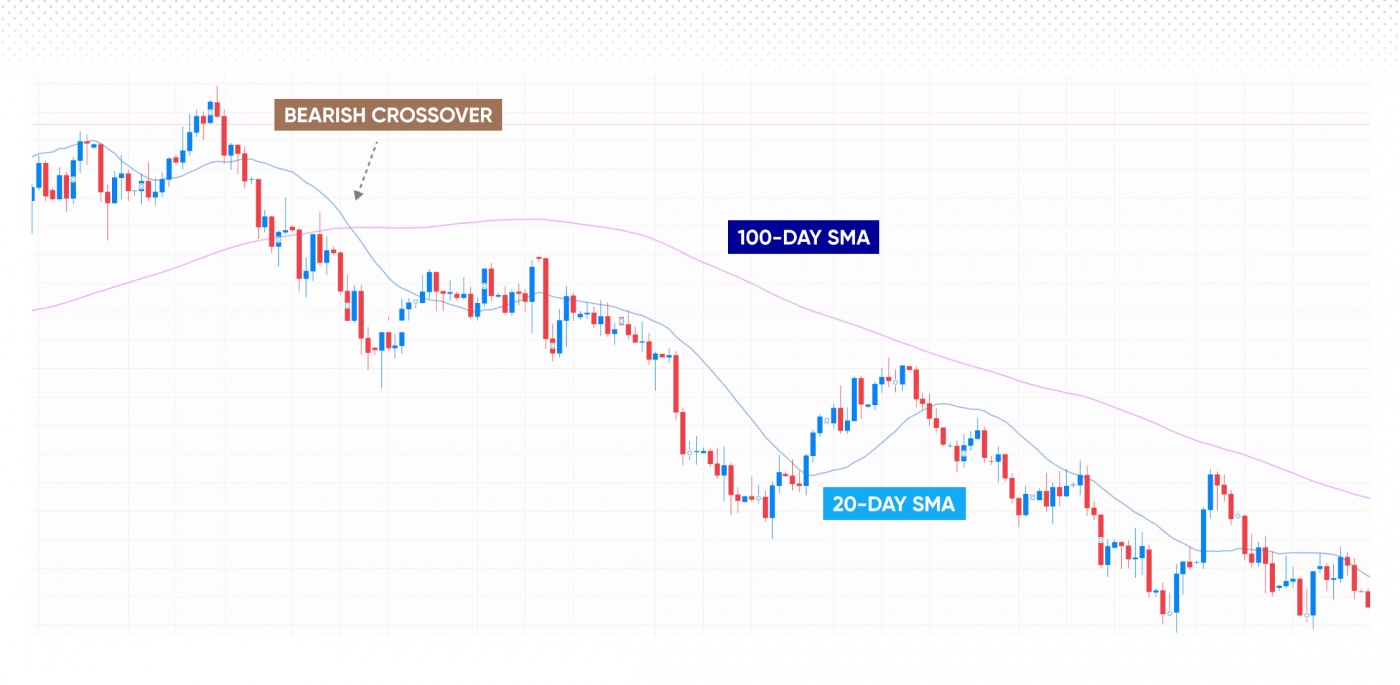
Bearish crossover
A bearish crossover happens when the short-term moving average crosses below the long-term moving average. In this scenario, the recent price momentum is weaker than the historical trend, possibly indicating a bearish market phase.
Traders generally interpret a bearish crossover as a sell signal, suggesting that they may exit a long position, enter a short position, or reduce exposure to the market. Like bullish crossovers, bearish crossovers can also involve various moving average types, including simple, exponential, and weighted moving averages.
 *Past performance is not a reliable indicator of future results
Moving average envelopes strategy
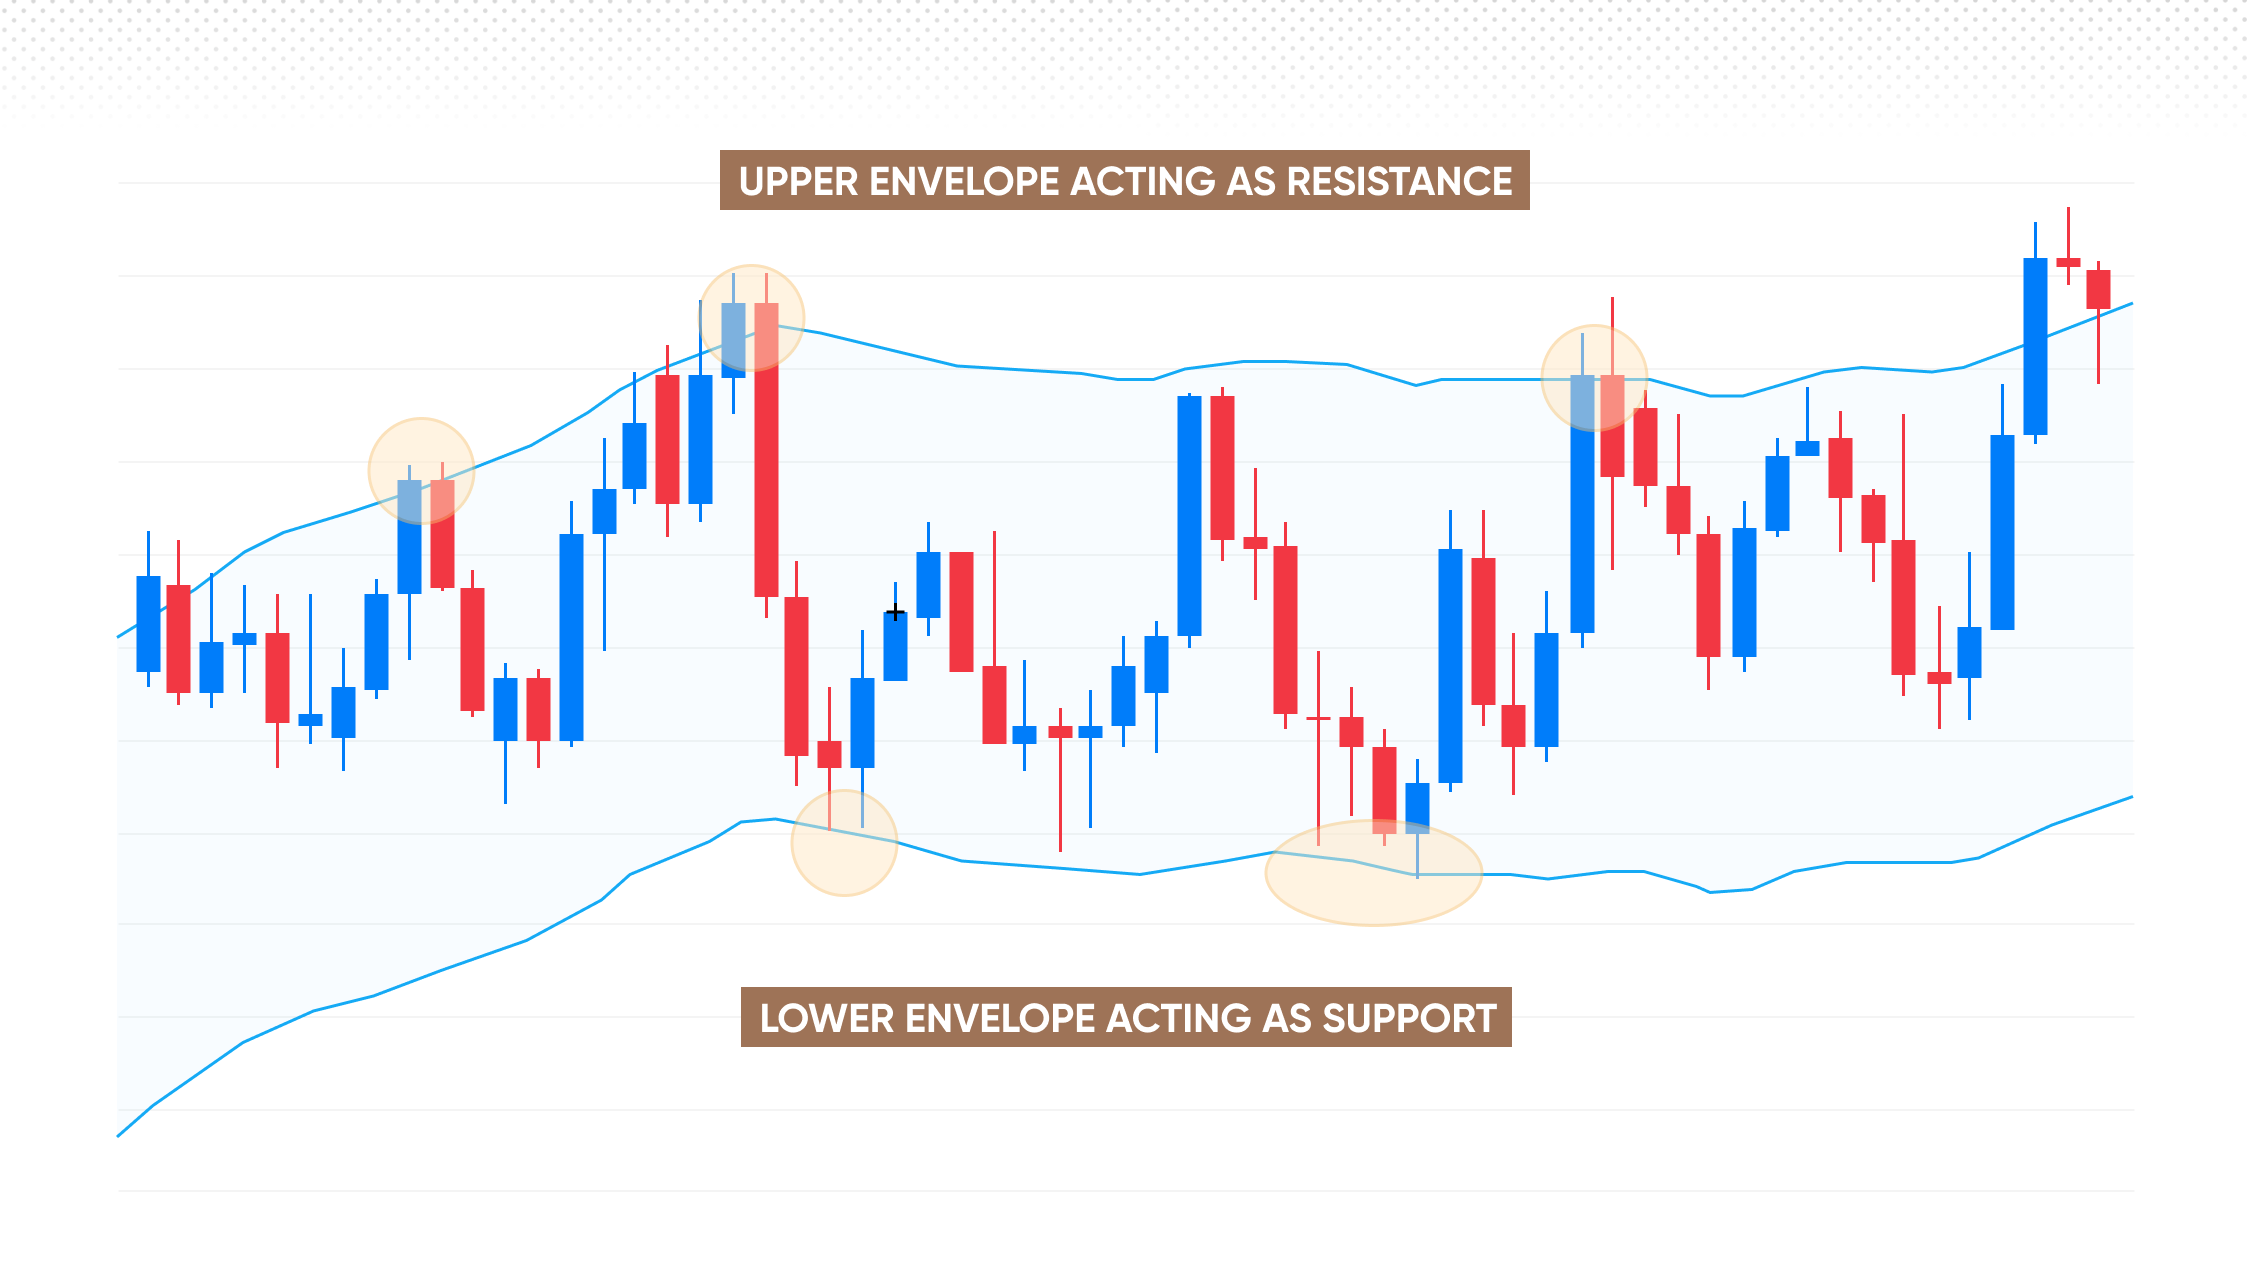
The moving average envelope strategy consists of three components: a central moving average line, typically a simple moving average (SMA), and two parallel lines, or “envelopes,” placed above and below the central line at a fixed percentage distance.
This strategy shares similarities with the Bollinger Bands® indicator, although while with Bollinger Bands® the deviations are based on price volatility, the percentage distance of the envelopes can be adjusted depending on both volatility and a trader’s risk tolerance.
To determine the optimal percentage distance, traders can observe historical price movements to identify the asset’s typical fluctuations. Additionally, traders may opt for a trial and error approach, testing various percentage distances.
 *Past performance is not a reliable indicator of future results
In practice, the moving average envelopes may serve as dynamic support and resistance levels, offering traders guidance in determining optimal trading positions. When the price of an asset moves towards or breaches the upper envelope, it may indicate overbought conditions. Conversely, if the price approaches or breaks below the lower envelope, it could signify oversold conditions.
Moving average ribbon strategy
The moving average ribbon strategy employs multiple moving averages to analyse price trends. The ribbon consists of a series of moving averages with varying timeframes, typically ranging from short-term to long-term periods. The objective is to provide a comprehensive visual representation of the underlying trend strength and direction.
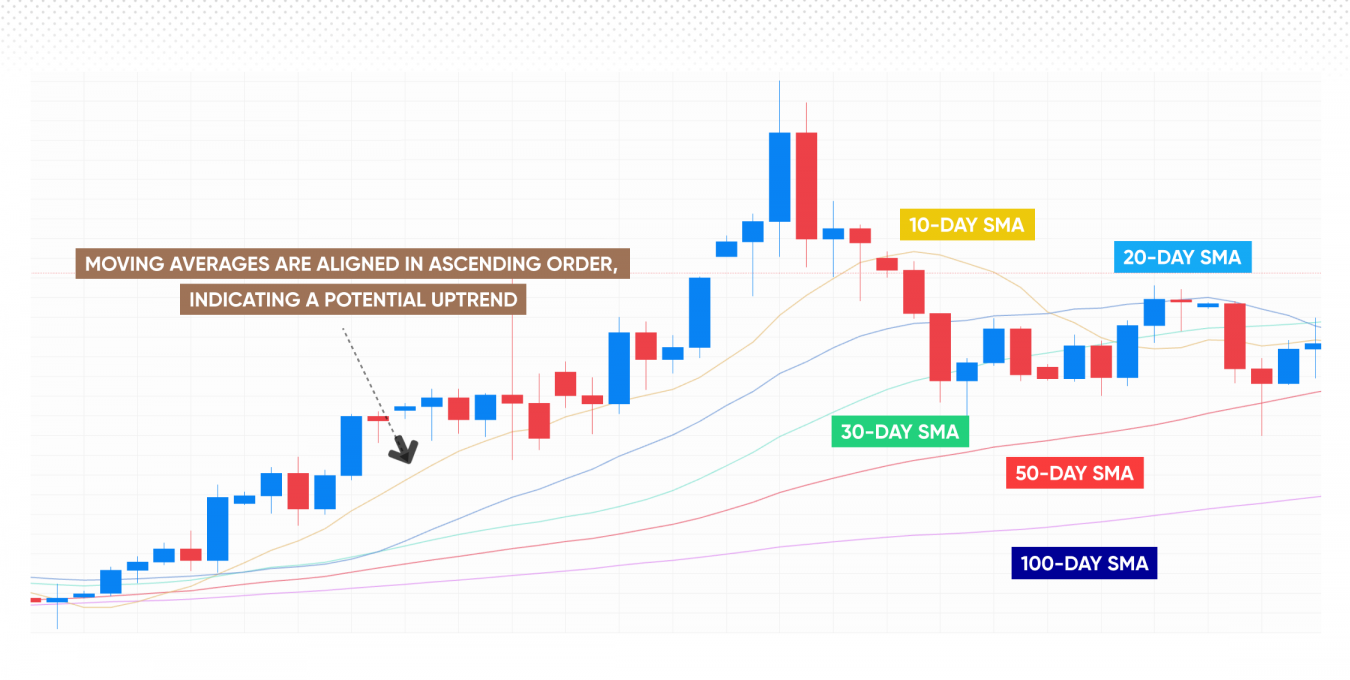
To implement this moving average strategy, traders plot a sequence of moving averages, such as simple moving averages (SMAs) or exponential moving averages (EMAs), on a price chart. The choice of timeframes depends on the trader’s preferences and the specific market conditions. Commonly used periods might include 10, 20, 30, 50, and 100 days, although customisation may be more appropriate for individual strategies.
 *Past performance is not a reliable indicator of future results
The key concept of the moving average ribbon strategy is to observe the alignment and spacing of the moving averages. When the moving averages are aligned in ascending order (shortest to longest) and evenly spaced, it may suggest a strong uptrend.
Conversely, if they are arranged in descending order (longest to shortest) and evenly spaced, a strong downtrend is indicated. Trading signals are generated when the moving averages converge, diverge, or exhibit a notable change in spacing, as these events may signify potential trend reversals or continuations.
Conclusion
In conclusion, the moving average trading strategy is a popular technical analysis method used by traders to identify potential market trends. By smoothing out price fluctuations, the moving average helps traders discern underlying trends and gauge the overall market sentiment.
Traders can customise their trading strategies by choosing the appropriate time frame and type of moving average, such as SMA, EMA or WMA. Moving averages can also act as dynamic support and resistance levels, and traders can use them to identify entry and exit points.
There are various examples of moving average trading strategies, each with its unique approach to analysing market trends. The key techniques are the crossover strategy, the envelope strategy and the ribbon strategy.
By understanding these, traders can select the one that best fits their trading style and objectives, and utilise moving averages to their advantage. However, as with any trading strategy, it’s essential to perform thorough analysis, utilise risk-management techniques, and continuously monitor the market to adjust your approach as needed. Traders may also choose to test their strategy using a demo account at first before risking real money.
FAQs
How to use moving averages?
Moving averages can be used to identify trends, support and resistance levels, and potential entry and exit points in trading.
How to read moving averages?
Reading moving averages involves analysing their position relative to price movements, as well as their slope and crossover patterns.
What is the difference between a simple moving average and an exponential moving average?
The main difference between a simple moving average (SMA) and an exponential moving average (EMA) is that the latter gives more weight to recent price data, making it more responsive to current market conditions.
Can moving averages be used for short-term trading or are they better suited for long-term trading?
Moving averages can be used for both short-term and long-term trading, but shorter timeframes may make the moving average more sensitive to price movements, while longer timeframes may provide a smoother indication of the underlying trend.