Understanding parabolic SAR: An educational guide

What is parabolic SAR?
The parabolic stop and reserve (SAR) is a technical analysis indicator designed to identify potential trend reversals and pinpoint entry and exit points in the market.
The versatile indicator was developed by J. Welles Wilder Jr. in 1978, and can be applied to various time frames and asset classes, including stocks, commodities, currency pairs, and more.
Highlights
-
Parabolic SAR is a technical analysis indicator used in trend following. It’s typically represented as a series of dots placed above or below the price chart.
-
The calculation of parabolic SAR involves the extreme points (EPs) and an acceleration factor (AF). EPs represent the highest and lowest prices reached during a trend, while the AF determines the sensitivity of the indicator.
-
Some of the key advantages of using the parabolic SAR include its ability to detect potential trends, establish potential entry and exit points, and adapt to various markets and timeframes.
-
Potential drawbacks of the parabolic SAR include the risk of false signals, the indicator’s lagging nature, and the need for setting adjustments.
Parabolic SAR explained
The parabolic SAR is typically shown in a chart with a series of dots above or below the price chart, depending on the momentum. While it’s accessible in this format on most platforms, understanding the parabolic SAR calculation may help traders to appreciate its mechanics and make better use of it in their strategies.
 *Past performance is not a reliable indicator of future results.
Parabolic SAR formula
The calculation involves the extreme points (EPs) and an acceleration factor (AF).
Extreme points (EPs): EPs are the highest and lowest prices reached during a trend. They are pivotal in determining the sensitivity and effectiveness of the parabolic SAR.
Acceleration factor (AF): The AF determines the sensitivity of the indicator. It begins at 0.02 and increases by 0.02 each time a new EP is reached, with a maximum value of 0.20.
The parabolic SAR formula is as follows:
SAR (today) = SAR (yesterday) + AF × (EP - SAR (yesterday))
Where:
-
SAR (today) is the current parabolic SAR value
-
SAR (yesterday) is the previous parabolic SAR value
-
AF is the acceleration factor
-
EP is the extreme point, either the highest or lowest price in the current trend
How to use parabolic SAR in trading
There are various ways traders can utilise parabolic SAR in trading, depending on their trading strategy. Below are some of the key approaches of using the indicator in trading.
Choosing the right time frame
The parabolic SAR can be applied to various time frames, from day trading to position trading. It's essential to choose a suitable time frame based on your trading style and objectives. For example:
-
Day trading: 1-minute, 5-minute, 15-minute, and hourly charts
-
Swing trading: 4-hour, daily, and weekly charts
-
Position trading: Weekly and monthly charts
Types of parabolic SAR signals
The parabolic SAR generates a variety of signals based on its position relative to the asset’s price, which in turn could help traders determine entry and exit points. The two types of signals are:
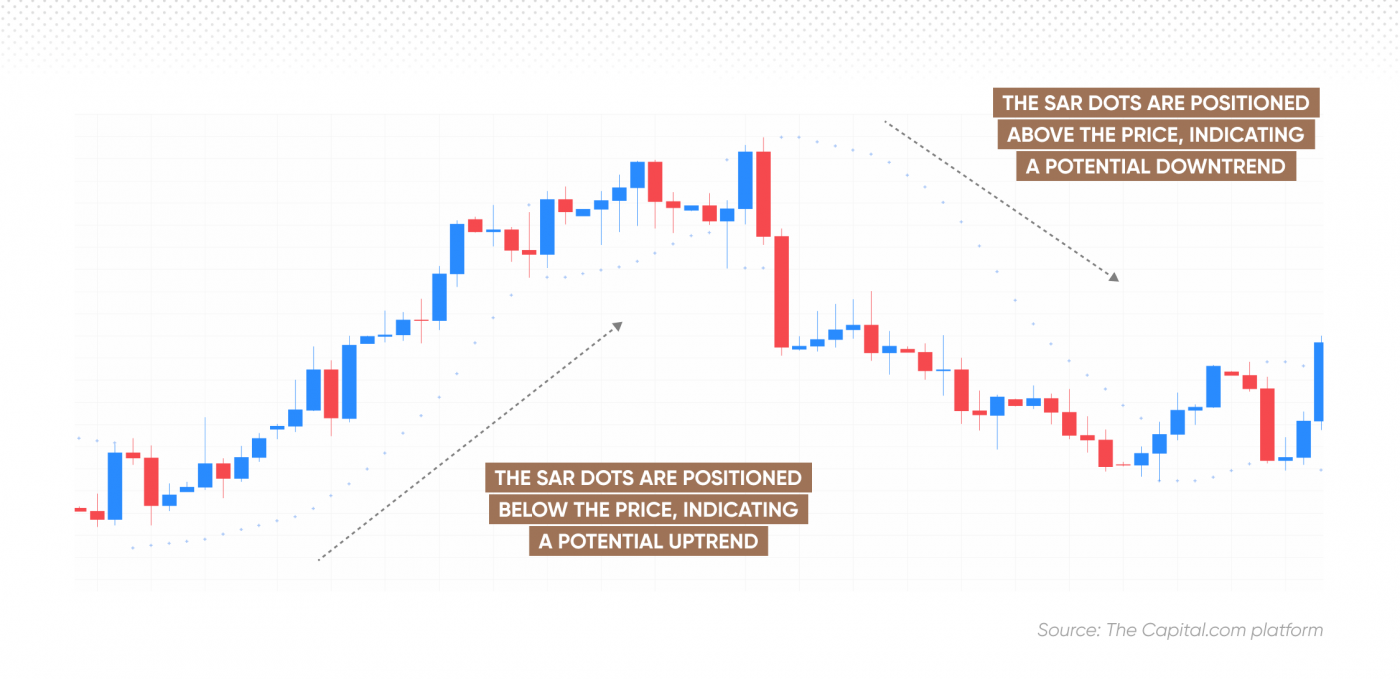
Bullish signal: When the parabolic SAR dots are positioned below the price, it suggests that the market may be experiencing an uptrend. This upward momentum may indicate that buyers are dominating the market, and traders may consider entering long positions or holding onto existing ones.
Bearish signal: Conversely, when the parabolic SAR dots are located above the price, it indicates a potential downtrend. This downward momentum implies that sellers are in control, and traders may contemplate entering short positions or exiting existing long positions.
*Past performance is not a reliable indicator of future results.
Identifying trends
The parabolic SAR can be used for identifying bullish and bearish trends. The positioning of the dots relative to the price can help determine the direction and strength of a trend:
-
Uptrend: Dots are below the price, potentially indicating bullish momentum.
-
Downtrend: Dots are above the price, potentially indicating bearish momentum.
-
Strong trend: Dots are far from the price, potentially indicating a trend’s strength.
-
Weakening trend: Dots are close to the price, potentially signalling a trend’s weakness.
Detecting trend reversals
To identify trend reversals using the parabolic SAR, traders can monitor the movement of the dots and their proximity to the asset's price. When the dots switch positions from being above the price to below it or vice versa, this can indicate a potential trend reversal.
For instance, if the dots move from above the price to below it, it may suggest a trend reversal from bearish to bullish, whereas if the dots shift from below the price to above it, it may imply a reversal from bullish to bearish.

*Past performance is not a reliable indicator of future results.
Using SAR with other indicators
It is essential to remain vigilant when using the parabolic SAR, as it can generate false signals in range-bound or choppy markets.
To improve the accuracy of the indicator, traders may consider combining the parabolic SAR with other technical analysis tools, such as moving averages (MA), the relative strength index (RSI), the moving average convergence divergence (MACD), and more.
Parabolic SAR trading strategy
There are also some more advanced strategies of using SAR in your trading. Make sure to always conduct your own thorough research before using them.
Parabolic SAR breakout strategy
The parabolic SAR breakout strategy combines parabolic SAR indicator with the concept of breakouts in trading. This strategy aims to identify moments when the market's volatility increases and the price moves beyond established support or resistance levels, signalling the potential for a strong trend to emerge.
To implement the parabolic SAR breakout strategy, traders should closely observe the consolidation of the parabolic SAR dots near the asset's price, indicating a potential impending breakout. As the price breaks out of the consolidation zone and the parabolic SAR reverses, traders may consider entering a long position if the breakout is bullish, or a short position if it's bearish.
It may be useful to set appropriate stop-loss orders and take-profit targets. Note that ordinary stop-losses do not protect from slippage, while paid-for guaranteed stop-losses do. Traders may also consider using other technical indicators, such as Bollinger Bands® or volume analysis, to confirm the breakout's strength and validity.
Double parabolic SAR trading strategy
The double parabolic SAR strategy employs two distinct timeframes: long-term and short-term. Once the long-term trend direction is determined using the parabolic SAR indicators, trades are executed using the indicator on a shorter time frame, but solely in the direction of the longer-term trend.
For example on the daily chart below we can see that in the past week the SAR dots have switched from below to above the price, and the price started reversing after the previous uptrend. This is a bearish signal, indicating a potential downward trend on the long timeframe.

*Past performance is not a reliable indicator of future results.
Meanwhile, on the 4-hour chart below of the same asset, we can see that the SAR dots have been continuously above the price, and after moving briefly below it, are now turning back up, suggesting a downward trend on a short time frame. Traders using this strategy may consider it as a bearish signal and open a short position.

*Past performance is not a reliable indicator of future results.
Why choose parabolic SAR?
-
Trend identification: The parabolic SAR can help in spotting prevailing trends in the market, and can be a valuable indicator for trend-following.
-
Entry and exit points: The indicator may be helpful in signalling potential entry and exit points when the dots move above or below the price.
-
Versatility: Parabolic SAR can be applied to various markets as well as different timeframes, making it a versatile tool with diverse trading styles and objectives.
Risks associated with parabolic SAR
-
False signals: The indicator may generate false signals, for example, but not limited to, range-bound or choppy markets. This can result in diminished performance and potential losses.
-
Lagging indicator: As a trend-following indicator, the parabolic SAR can lag behind price movements, potentially causing traders to perceive sudden market shifts with delay.
-
Setting adjustments: The default settings may not be suitable for all markets and securities. Traders may want to experiment with different AFs and maximum values to tailor the indicator to their specific trading instruments.
Conclusion
The parabolic SAR is a versatile technical analysis indicator that has become a valuable tool for traders seeking to identify potential trend reversals, establish entry and exit points, and determine the direction of an asset's price in various markets and timeframes. The indicator's unique visual representation, with a series of dots placed above or below the price chart, helps traders to interpret market trends and make informed decisions.
The calculation of the parabolic SAR involves key components such as the extreme points (EPs) and the acceleration factor (AF), which are crucial in determining the indicator's sensitivity and effectiveness. The parabolic SAR generates distinct bullish and bearish signals based on the position of the dots relative to the asset's price. There are various advanced strategies traders can use with the indicator, for example, the parabolic SAR breakout and the double parabolic SAR.
Traders must be aware of the potential risks and limitations associated with the parabolic SAR, such as false signals, lagging behaviour, and the need for setting adjustments. To optimise the effectiveness of the indicator, traders may consider combining the parabolic SAR with other technical analysis tools, test their strategies using a demo account and remain vigilant in managing risks.
FAQs
What is parabolic SAR indicator in simple terms?
The parabolic SAR indicator is a technical analysis tool used to identify potential trend reversals, establish entry and exit points, and determine the direction of an asset's price.
Is parabolic SAR trading profitable?
Like any other technical analysis tool, the parabolic SAR trading can be profitable but can also lead to losses. Always conduct thorough research, and don’t trade more than you can afford to lose.
Is parabolic SAR a good indicator?
Parabolic SAR is considered a valuable indicator for identifying trends and reversals, but its effectiveness may vary depending on market conditions and the trader's skill in interpreting its signals.
What is the success rate of parabolic SAR?
The success rate of parabolic SAR cannot be accurately quantified, as it depends on various factors such as the trader's strategy, market conditions, and the specific assets being traded.
Is parabolic SAR leading or lagging?
The parabolic SAR is a lagging indicator, as it follows price movements and generates signals based on previous price data.