Support and resistance levels: A comprehensive guide for CFD traders
Support and resistance refer to price levels where demand or supply tends to emerge, often causing the price to stall or reverse. These levels are valuable for identifying entry and exit points, as well as for managing risk effectively.
Understanding support and resistance levels
What makes some price points act as support and resistance levels? These represent areas where buying or selling pressure tends to form, slowing or reversing the asset’s movement in a given direction.
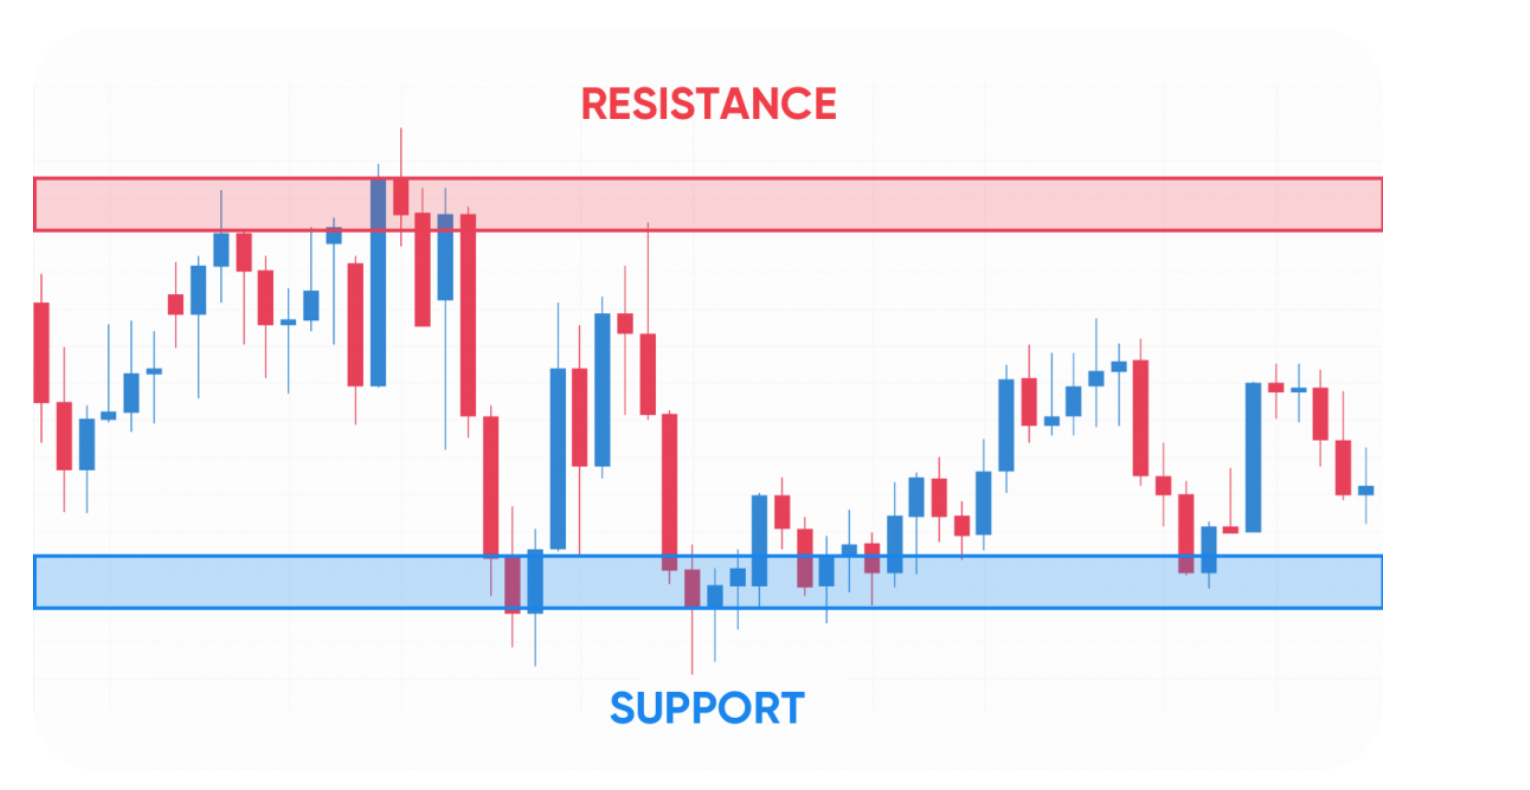
When the price of an asset is falling, there’s often a level where it repeatedly rebounds. At this level, demand clusters as traders view it as favourable for initiating long positions. Each time the price returns to this zone, buying activity typically increases, pushing prices higher. This is called the support level – the price ‘floor’.
Conversely, when an asset’s price is rising, you may notice a level where it regularly turns lower. Here, supply builds as traders consider it an appropriate area to close positions and realise profits. Each time the price approaches this zone, selling interest tends to intensify, causing prices to retreat. This is the resistance level – the price ‘ceiling’.
Key drivers of these levels include order concentration at specific price points, traders’ memory of past price reactions, and psychological round numbers that attract heightened market attention.
What drives support and resistance levels?
Market psychology plays a significant role in shaping support and resistance levels. When prices approach recognised zones, traders may anticipate a reversal and act accordingly. This can create a self-fulfilling dynamic, as collective actions reinforce these areas and strengthen their effect.
But what causes these levels to form initially? As with any asset, price behaviour depends on the interaction between supply and demand. Many traders may hesitate to buy when prices are falling. At a certain low price, however, the asset may appear undervalued enough for some traders to enter the market. This becomes the support level, where demand begins to outweigh supply, causing the price to stabilise or rebound.
Similarly, when prices are rising, traders may prefer to hold existing positions rather than sell. Yet, at a certain high price, some may believe the asset has become overvalued and decide to take profits. This becomes the resistance level, where supply exceeds demand, causing the price to pause or retreat.
The activity of institutional investors also contributes to these dynamics. Large funds and investment banks often set predefined price levels at which to buy or sell, introducing significant concentrations of orders that help establish support and resistance zones.
Psychological factors also play a part. Round numbers such as $10, $50 or $100 often act as psychological thresholds, as they are easy to recall and frequently used as reference points for placing orders. These round-number levels can attract increased trading activity, though their significance varies across markets and conditions. Support and resistance levels therefore often serve as reference markers when traders design or refine their strategies.
How to identify support and resistance levels?
This is a skill developed through consistent observation and practice. Identifying support and resistance levels accurately takes time and familiarity with price behaviour. Let’s explore some common methods used by experienced traders.
The most straightforward approach is to analyse past price action, focusing on historical highs and lows. A price level that has previously acted as a ceiling (resistance) or a floor (support) may do so again under similar conditions. However, past performance is not a reliable indicator of future results.
If clear levels aren’t visible, zoom out to a longer timeframe and look for significant peaks and troughs – points where the price reversed direction. This technique, known as multi-timeframe analysis, helps filter out short-term fluctuations and reduce false signals. A level that appears minor on a 15-minute chart could represent a major support area on a daily or weekly timeframe.
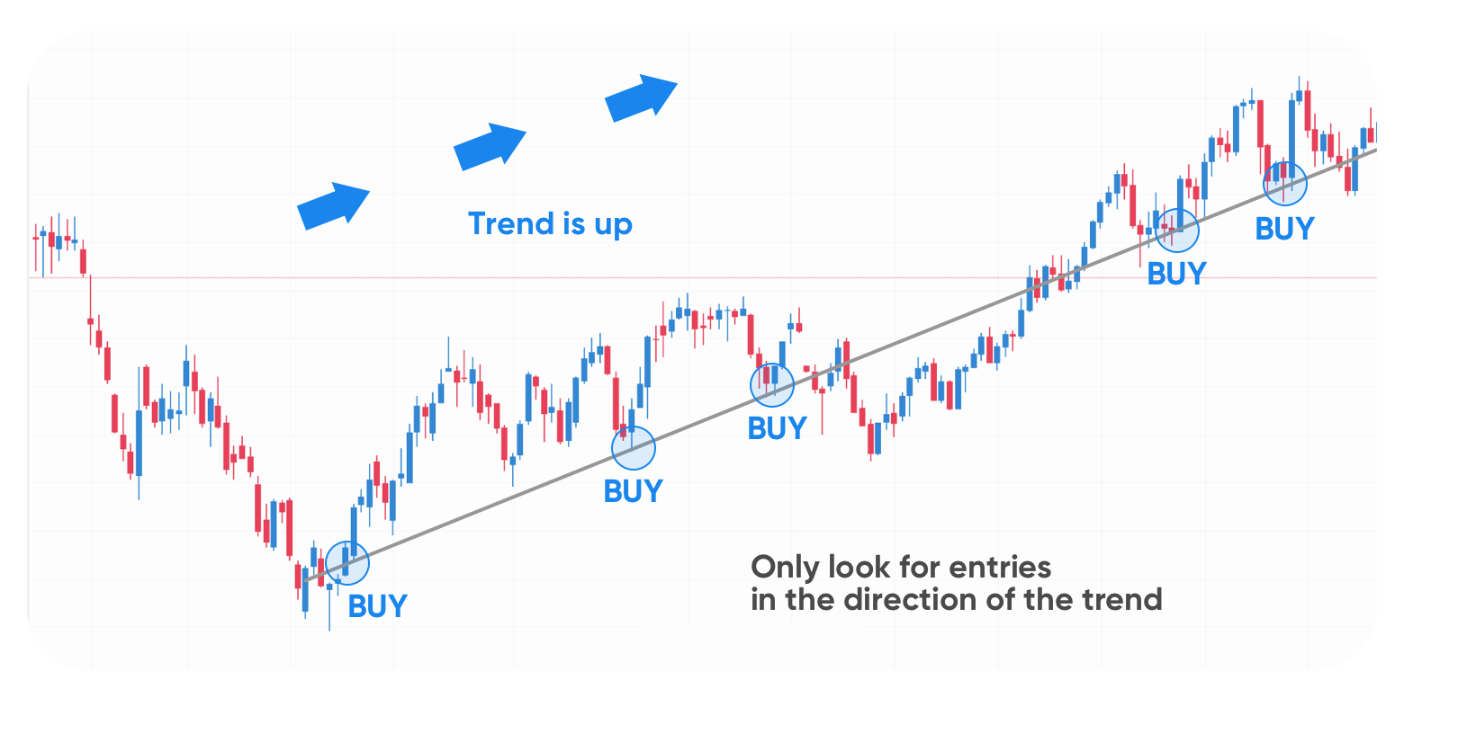
Support and resistance are not always horizontal. Trendlines can reveal dynamic levels. In a strong uptrend, an upward-sloping trendline connecting swing lows may indicate support, while in a downtrend, a downward-sloping line linking swing highs can act as resistance.
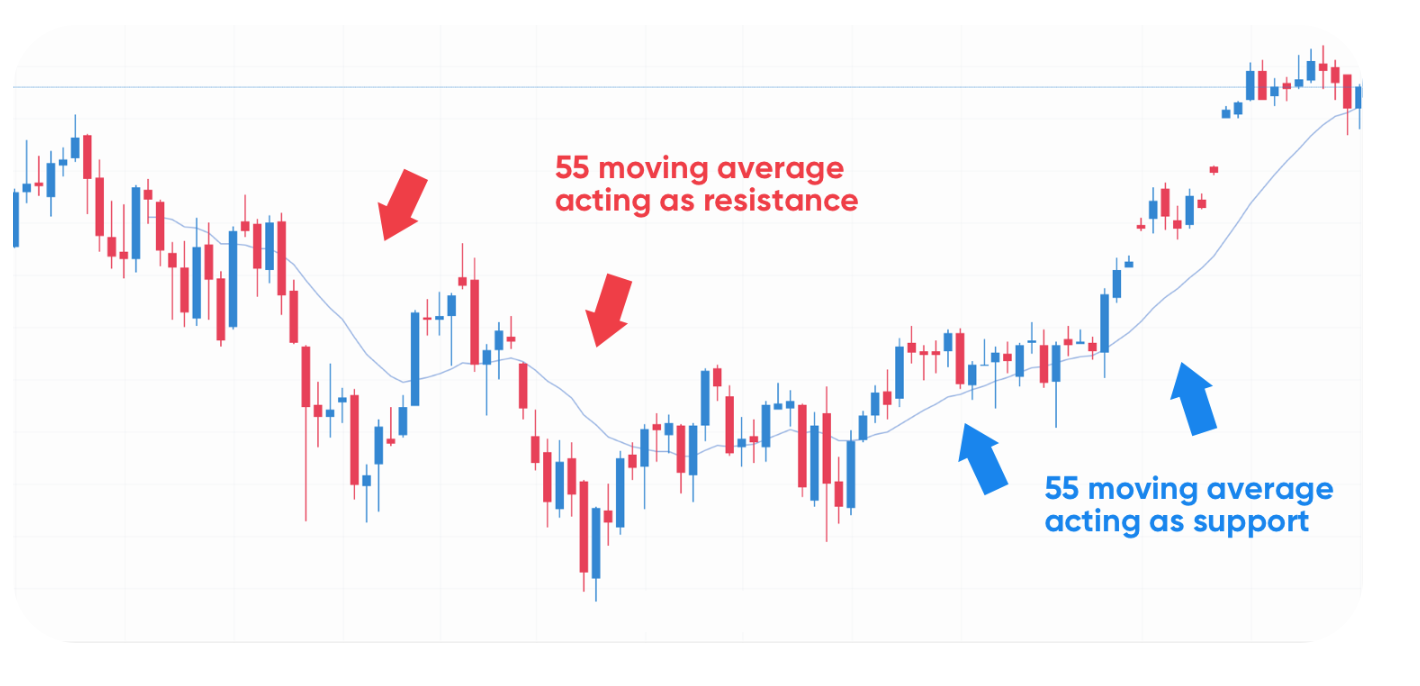
Alternatively, moving averages (MAs) provide constantly adjusting reference points. For instance, the 50-day or 200-day moving average often acts as dynamic support during an uptrend or resistance during a downtrend.
Volume can serve as a confirmation tool rather than a primary signal. Increased trading volume near a specific price often reflects greater interest and liquidity among participants. When volume spikes coincide with reversals at established levels, it can reinforce the reliability of those support or resistance zones.
Drawing support and resistance levels
While explaining the concept, we’ve referred to ‘price points’. In practice, however, support and resistance levels are rarely exact to the last pip or cent. It’s more accurate to view support and resistance as zones or areas of interest rather than precise figures. There is always some degree of market noise and minor price movement around key levels, so drawing a rectangle or shaded area on your chart is generally more effective than marking a single line.
Here are five rules to follow when drawing these zones:
- Prioritise major levels: Drawing too many lines can create confusion – a common issue for new traders. Focus on the most visible peaks and troughs; they’ll stand out clearly on your chart. Use longer timeframes first to identify significant reversal areas.
- Avoid over-drawing: A cluttered chart with multiple zones can obscure key signals and lead to over-analysis. Concentrate on the most relevant areas. For instance, if trading on a daily chart, mark only daily zones and avoid plotting every minor level from shorter timeframes.
- Confirm with multiple touches and volume: The more times a zone has been tested and held – especially alongside noticeable increases in trading volume – the more reliable it becomes. A level that previously acted as resistance before a breakout, and later as support, tends to hold greater technical significance.
- Include wicks and bodies: When defining zones, take into account both candle wicks (shadows) and bodies. Wicks show extreme highs and lows, while bodies reflect opening and closing prices. Including both helps capture the full area of market interest.
- Assess current price action: A historical zone remains relevant only if price still responds to it. As price nears a marked zone, observe whether it slows, consolidates, or reverses – indicating that the level remains active.
Common beginner errors include drawing zones at arbitrary levels, overlooking the influence of round numbers, and failing to adjust zones once they’ve been decisively broken. It’s also important to remember that no zone is permanent – over time, all support and resistance areas are likely to be breached.
Types of support and resistance
Support and resistance levels are not all the same. They can be categorised by their characteristics and formation.
- Static (horizontal): These are the most common type of support and resistance, represented by a fixed horizontal line or zone on the chart. They are formed by clear swing highs and lows and remain at the same price regardless of time. A typical example of a static level is a price that consistently reverses or rebounds around a specific point, such as $50.
- Dynamic (trend-based): Unlike static levels, dynamic support and resistance change over time. They are often represented by moving averages (MAs) or trendlines. In a strong uptrend, a moving average such as the 50-day or 200-day MA can act as dynamic support, with price often finding a temporary floor near that level. Conversely, in a downtrend, these MAs – or downward-sloping trendlines – can function as dynamic resistance.
Past performance is not a reliable indicator of future results
Past performance is not a reliable indicator of future results
- Semi-dynamic (Fibonacci, pivot points): These levels are based on mathematical calculations that update with price action but remain horizontal. Fibonacci retracement levels identify potential support and resistance at key percentages of a prior move (38.2%, 50%, 61.8%), while pivot points – derived from the previous day’s high, low, and close – help traders identify potential intraday turning zones.
Since support and resistance are zones rather than precise lines, different types can overlap. For instance, a static high that aligns with a 200-day MA may create a confluence zone. Trading with such zones provides greater context and helps minimise false breaks caused by short-term volatility.
Using support and resistance in trading
This is one of the most practical sections of this guide. There’s little benefit in identifying and drawing levels if you don’t understand how to apply them when developing your trading strategies. Here are some straightforward and widely used approaches:
The bounce strategy is a traditional method where traders buy when price rebounds from a support zone or sell when it reverses from a resistance zone. For example, if a share touches a strong support zone and a bullish candle forms shortly after, a trader may open a long position with a stop-loss just below the support area.
The breakout strategy involves trading when price moves through a support or resistance zone. A breakout indicates a notable change in the balance between supply and demand. For instance, a trader may enter a long position following a decisive close above a resistance zone, anticipating continued upward movement.
The RSI measures price momentum. When price is near a support zone and the RSI falls into the oversold region (below 30), it may indicate that buying pressure is emerging. Conversely, when price approaches a resistance zone and the RSI is overbought (above 70), it may suggest weakening momentum.
The MACD helps assess trend strength. For example, a bullish MACD crossover near a support zone can reinforce a potential bounce setup.
Specific candlestick patterns can also highlight potential reversals. A pin bar or inside bar forming around a support or resistance zone can signal that the level is holding and a reversal may follow.
Volume provides valuable confirmation
A noticeable rise in volume – as price tests a support or resistance zone – reflects strong market participation. High volume on a breakout suggests the move is supported by liquidity and is less likely to be a false signal.
If you’re uncertain which strategy suits you best, consider using a demo account to practise and build confidence without risking real funds.
Support and resistance after a breakout
When price moves above a resistance zone or below a support zone, it’s called a breakout. This is a key development in technical analysis. It often signals the continuation of an existing trend or the start of a new one, as the balance between supply and demand shifts decisively.
Past performance is not a reliable indicator of future results
It’s important to recognise a common behaviour that often follows a breakout – the retest. This occurs when price returns to the broken zone before continuing in the direction of the prevailing move.
This pattern reflects a fundamental aspect of market psychology and order flow: former resistance can become new support, while former support can become new resistance.
Retests and confirmation setups
A retest occurs when the market revisits and tests the strength of a breakout. After price moves above a resistance zone, that level (previously a ceiling) can act as a new support. Traders who missed the initial breakout may wait for price to return to this zone before entering a long position. Buying activity at this point can confirm the new support, and price may resume its upward movement. This is known as a retest and confirmation setup.
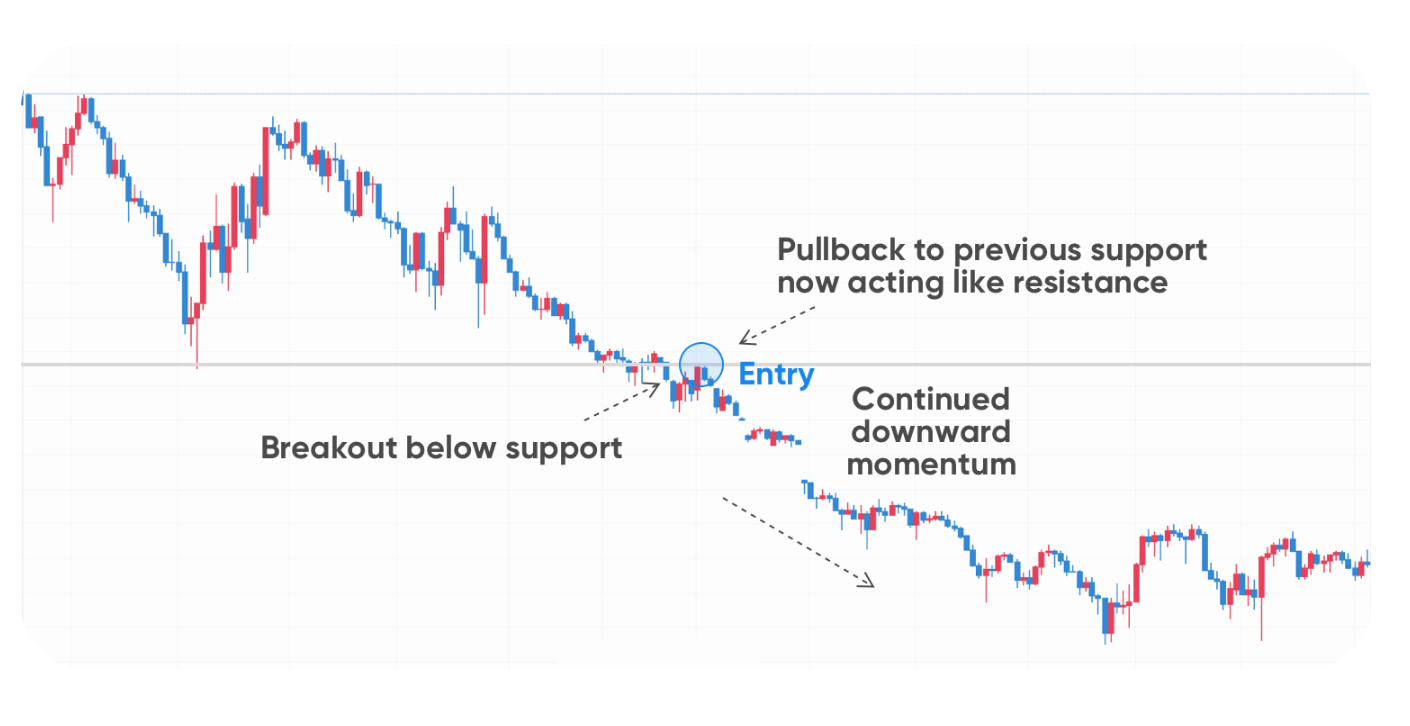
Similarly, when price falls below a support zone, that area often flips to become new resistance. In this case, traders might wait for price to retrace towards the zone before opening a short position. Selling interest at this level confirms the resistance and may lead to further downward movement.
Confirmation is an essential step. Without it, a breakout can quickly turn into a false move (or fakeout), trapping traders who act prematurely. It’s generally prudent to wait for price to retest and clearly reject the old zone before considering a position.
Continuation trading vs. reversals
Breakouts and retests are typical of continuation trading. This approach involves entering trades in the direction of a trend that has recently broken out of a consolidation phase. It relies on momentum created by changing supply and demand dynamics, with the retest offering a more structured entry point.
By contrast, reversal trading focuses on identifying when a trend is losing strength and may soon turn. While a confirmed breakout supports continuation, a failed breakout – one that lacks follow-through buying or selling interest – can signal an early reversal. Recognising the distinction between continuation and reversal setups is key to selecting an appropriate strategy.
Advanced range trading strategies
A range-bound market is one where price oscillates between a clear support zone (the ‘floor’) and a clear resistance zone (the ‘ceiling’). While new traders may view these periods as lacking direction, experienced traders often recognise them as structured trading opportunities.
Past performance is not a reliable indicator of future results
Range-bound market conditions
Range-bound markets develop when buyers and sellers are in relative balance, leading to periods of consolidation. Price becomes contained between a demand zone (support) and a supply zone (resistance), often after a strong directional move, as market participants pause before committing to a new trend.
Entry/exit rules
The basic principle is to buy near support and sell near resistance. Enter a long position as price approaches the support zone and a short position as it nears resistance. However, experienced traders tend to wait for confirmation, such as candlestick signals (for example, a bullish pin bar at support or a bearish engulfing at resistance) or indicator readings (RSI in oversold territory at support or overbought at resistance).
The opposite boundary of the range usually serves as the main take-profit target. Set take-profit levels just below resistance for long positions and just above support for short positions. Place stop-loss orders slightly beyond the range to protect against potential breakouts.*
*Stop-loss orders are not guaranteed. Guaranteed stop-loss orders incur a fee if activated.
Controlling your risk exposure
Effective risk management is essential in range trading to mitigate the impact of unexpected breakouts. The goal is to ensure that any single losing trade does not offset accumulated gains.
A common guideline is to risk no more than 1–2% of total trading capital on each trade. Position sizing – which determines how many units to trade – depends on individual risk tolerance and the stop-loss distance.
Position size formula:
Position size = (account risk in $) ÷ (stop-loss distance in $)
For example, with $10,000 in capital and a 2% risk limit, the maximum loss per trade would be $200. If the stop-loss is $0.50 from the entry price, the position size would be $200 ÷ $0.50 = 400 shares, keeping the potential loss manageable.
| Feature | Beginner setup | Advanced setup |
|---|---|---|
| Drawing support and resistance | Exact, thin lines at single highs/lows | Broad, defined zones using a rectangle tool to account for market noise |
| Confirmation | Little to no confirmation – trades on price touching | Waits for price-action confirmation (candlestick patterns), indicator signals (RSI/MACD divergence) or volume spikes |
| Entry/exit | Limit orders placed directly on S&R lines | Waits for clear rejection of the zone and enters on the following candle |
| Risk management | Inconsistent or overly tight stop-losses at the line | Stop-losses placed a safe distance beyond zones, often using ATR to account for volatility |
| Multi-timeframe analysis | Relies on a single timeframe (e.g., 5-minute chart) | Uses a higher timeframe (daily) for key zones and a lower timeframe (1-hour) for refined entries |
Common mistakes and how to avoid them
It’s useful to be aware of the common errors that new traders often make. Recognising these can help prevent small mistakes from leading to larger losses. Let’s review a few of the most frequent ones:
Relying on one timeframe only
Using only a single timeframe for your analysis can create a narrow view of the market. A support zone visible on a 5-minute chart may appear insignificant compared with a long-term resistance level on a weekly chart. A multi-timeframe approach can provide better context. Start with a higher timeframe (weekly or daily) to identify the main trend and key support and resistance zones, then move to a lower timeframe (4-hour or 30-minute) to refine entries and exits.
Ignoring false breakouts
A false breakout is a common occurrence. Failing to recognise it can lead to buying too high or selling too low. Some traders enter as soon as price moves beyond a zone, only for it to reverse shortly after. To reduce this risk, wait for confirmation – for example, a clear candle close beyond the zone supported by a corresponding volume increase – before acting on a breakout.
Giving too much importance to indicators
Technical indicators are useful tools, but they should not replace price action or contextual analysis. Relying solely on indicators can lead to delayed or misleading signals. Instead, use them to support – not define – your interpretation of support and resistance zones. For instance, indicators like the RSI or MACD can help confirm, but not determine, potential turning points.
Drawing too many levels
A cluttered chart creates unnecessary complexity. Many beginners mark every minor swing high or low, leading to analysis fatigue. Focus on the most relevant zones – those that have prompted significant reversals multiple times – to maintain clarity and make more objective trading decisions.
Past performance is not a reliable indicator of future results.
Ready to explore trading with a clearer understanding of support and resistance levels? Open a live account to apply what you’ve learned in real market conditions.
Create an account Open a demo account
FAQ
What are support and resistance levels?
Support and resistance levels are price areas where buying or selling pressure tends to build. Support acts as a ‘floor’ where price may stabilise or rebound, while resistance acts as a ‘ceiling’ where price may slow or reverse. These levels help traders identify potential entry, exit, and risk management points.
How can I identify support and resistance levels on a chart?
Support and resistance can be identified by analysing historical highs and lows, trendlines, or moving averages. Traders often look for price zones that have repeatedly caused the market to stall, reverse, or consolidate. A multi-timeframe approach helps distinguish short-term fluctuations from more significant long-term levels.
Do support and resistance levels always hold?
No. Support and resistance levels are not fixed and can change over time. As market conditions evolve, these zones may weaken or break. When price moves beyond a level and sustains momentum, the zone often reverses its role – previous resistance can become support, and vice versa.
What’s the difference between static and dynamic support and resistance?
Static levels stay at the same price over time, typically shown as horizontal lines drawn through clear highs and lows. Dynamic levels, by contrast, shift with price movement and are often represented by moving averages or trendlines that adapt to ongoing market changes.