What is the three white soldiers candlestick pattern?

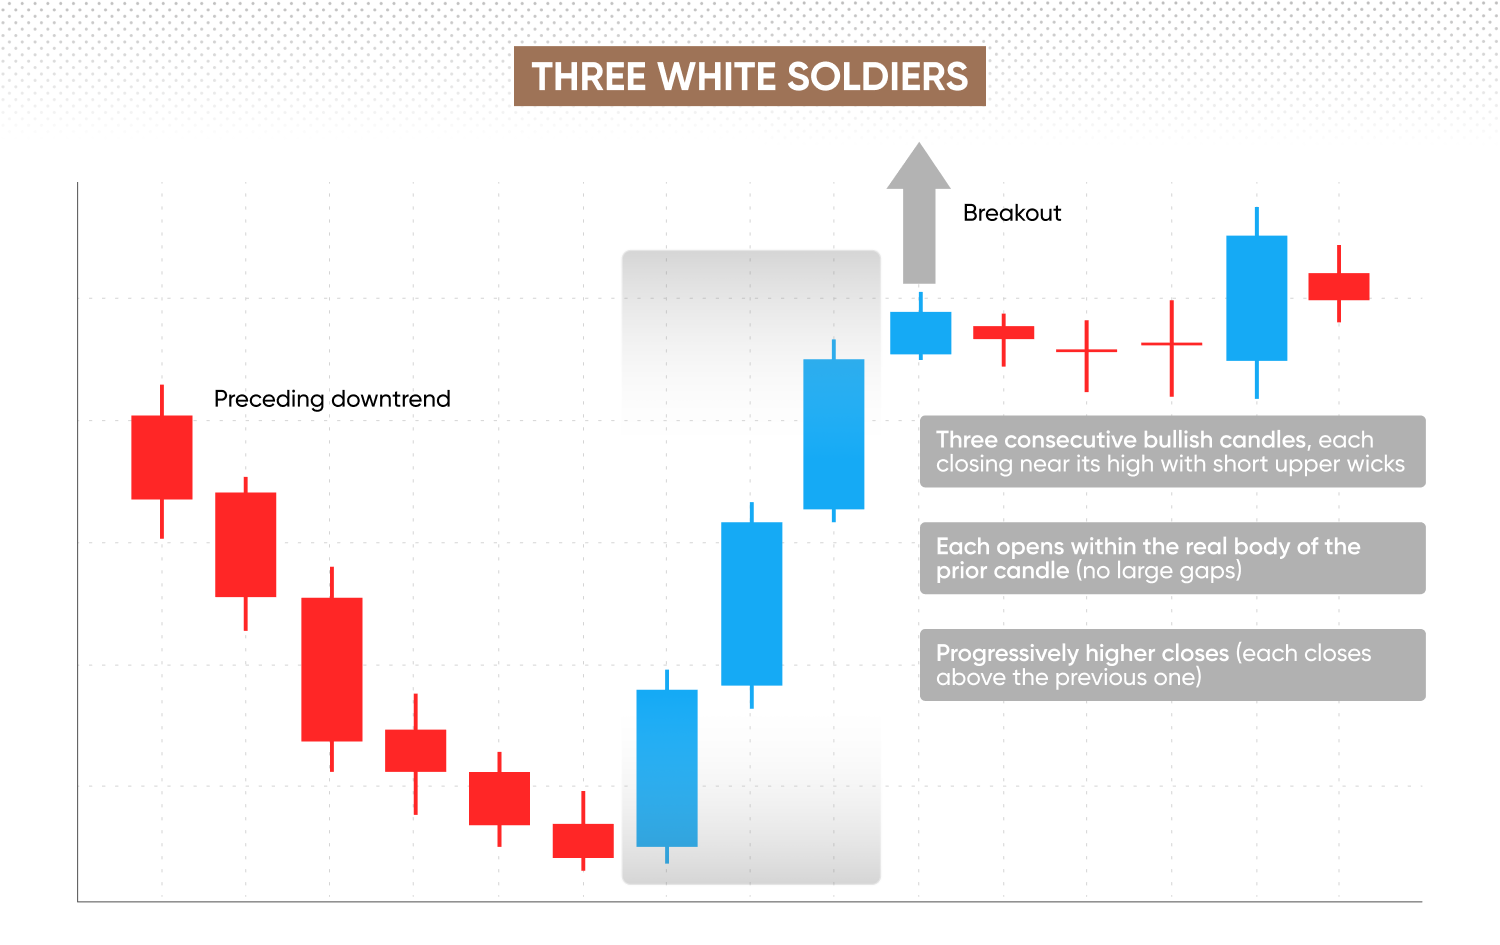
The three white soldiers candlestick pattern is a bullish reversal signal that appears after a downtrend – indicating a potential shift in sentiment from bearish to bullish. Explore the pattern’s characteristics and how to trade it via CFDs, with examples, in our guide.
What is the three white soldiers pattern?
The three white soldiers pattern is a candlestick formation that may emerge at the end of a downtrend, signalling a potential reversal from bearish to bullish.
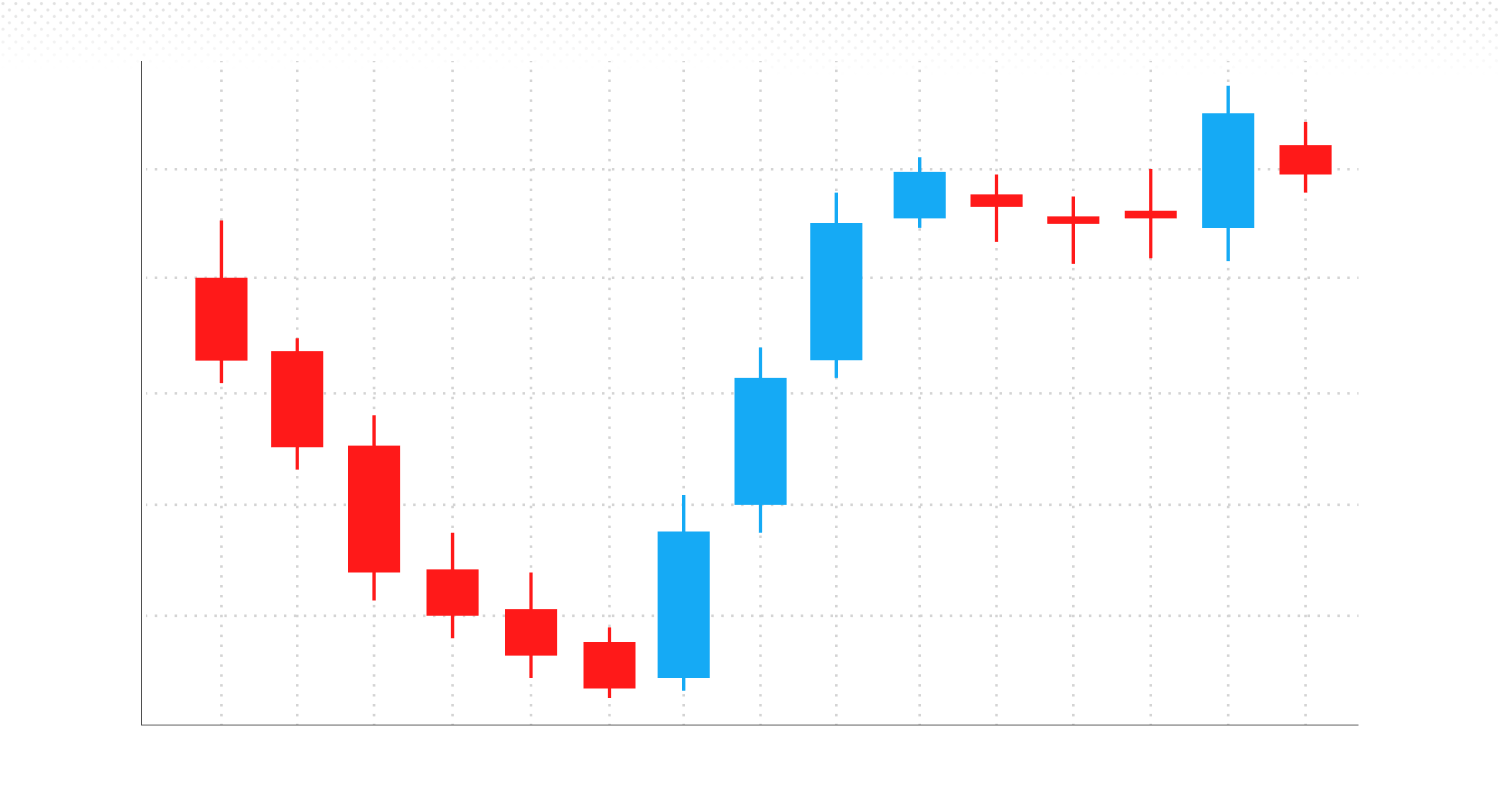
It’s made up of three long‑bodied bullish candlesticks that appear consecutively. Each candle typically opens within or near the body of the preceding candle and closes progressively higher – ideally above the previous candle’s close. The pattern typically forms after sustained bearish price action.
All three candles should have relatively short wicks, reflecting consistent buying pressure throughout each session.
Rules and characteristics
Three consecutive bullish candlesticks
The pattern consists of three back‑to‑back bullish candlesticks. Each candle should close near its high, with a short upper wick – due to sustained buying pressure throughout the session.
Opens within the body of the previous candle
Each candle opens within the real body (the open‑close range) of the previous candle. This overlap is a key feature – it suggests continued buyer interest without sudden price gaps.
Progressive higher closes
Each candle closes higher than the previous one. The overall progression should be smooth – long lower shadows or indecisive candles may weaken the signal.
Forms after a downtrend or pullback
The pattern is most meaningful when it appears after a clear downtrend or significant pullback. In this context, it acts as a potential bullish reversal signal. If it appears during an extended uptrend, it may instead reflect a continuation rather than a reversal.
Volume and confirmation
Volume confirmation suggests increased participation by buyers, which may help reduce the risk of a false breakout. Some traders also look for supporting indicators such as an RSI reading crossing above 30, or moving‑average convergence, for additional context.
How to identify the pattern in real-time
To identify the three white soldiers candlestick pattern in live market conditions, look for a clear sequence of three bullish candlesticks that meet the core formation criteria – especially during or just after a downtrend.
Here’s a step-by-step:
-
Identify three consecutive bullish candles – analyse the chart for three successive bullish candlesticks. Each should display a relatively large real body and close higher than the prior session. The closing price ought to be near the session high, with small or minimal upper and lower shadows.
-
Opens within the body of the previous candle – each candle in the sequence should open within the real body (the open-to-close range) of its predecessor. This overlap suggests steady buyer interest rather than erratic price action. Wide gaps between candles may signal increased volatility, which may invalidate the pattern.
-
Short wicks, strong bodies – wick size matters. Long upper shadows can imply selling into strength, while long lower shadows may point to indecision or support testing. In a typical three white soldiers pattern, wicks are limited and bodies dominate, signalling firm bullish intent.
-
Appears after a downtrend or correction – the pattern carries greater weight when it forms at the end of a downtrend or near a key support level. It may also appear after a retracement within a broader trend, indicating buyers are regaining control.
-
Real-time filters and confirmation tools – traders can use automated charting tools or candlestick scanners to spot the pattern as it develops. Once identified, cross-check with other technical indicators.
What does the pattern signal?
The three white soldiers candlestick pattern may signal a possible bullish reversal – particularly when it appears after a downtrend – and represents rising buying pressure across three sessions. Each candle closes progressively higher, often near its high – which suggests that bearish momentum is fading as buyers start to regain control.
As with any candlestick trading approach, market context is crucial. Volume confirmation and supporting indicators, such as RSI or EMA crossovers (eg 9 and 21-period moving averages), help determine whether any shift in sentiment is supported by broader trend strength.
Past performance is not a reliable indicator of future results.
Limitations and common mistakes
Like all candlestick patterns and other technical indicators, the three white soldiers pattern is not foolproof. Here are some limitations and pitfalls to be wary of:
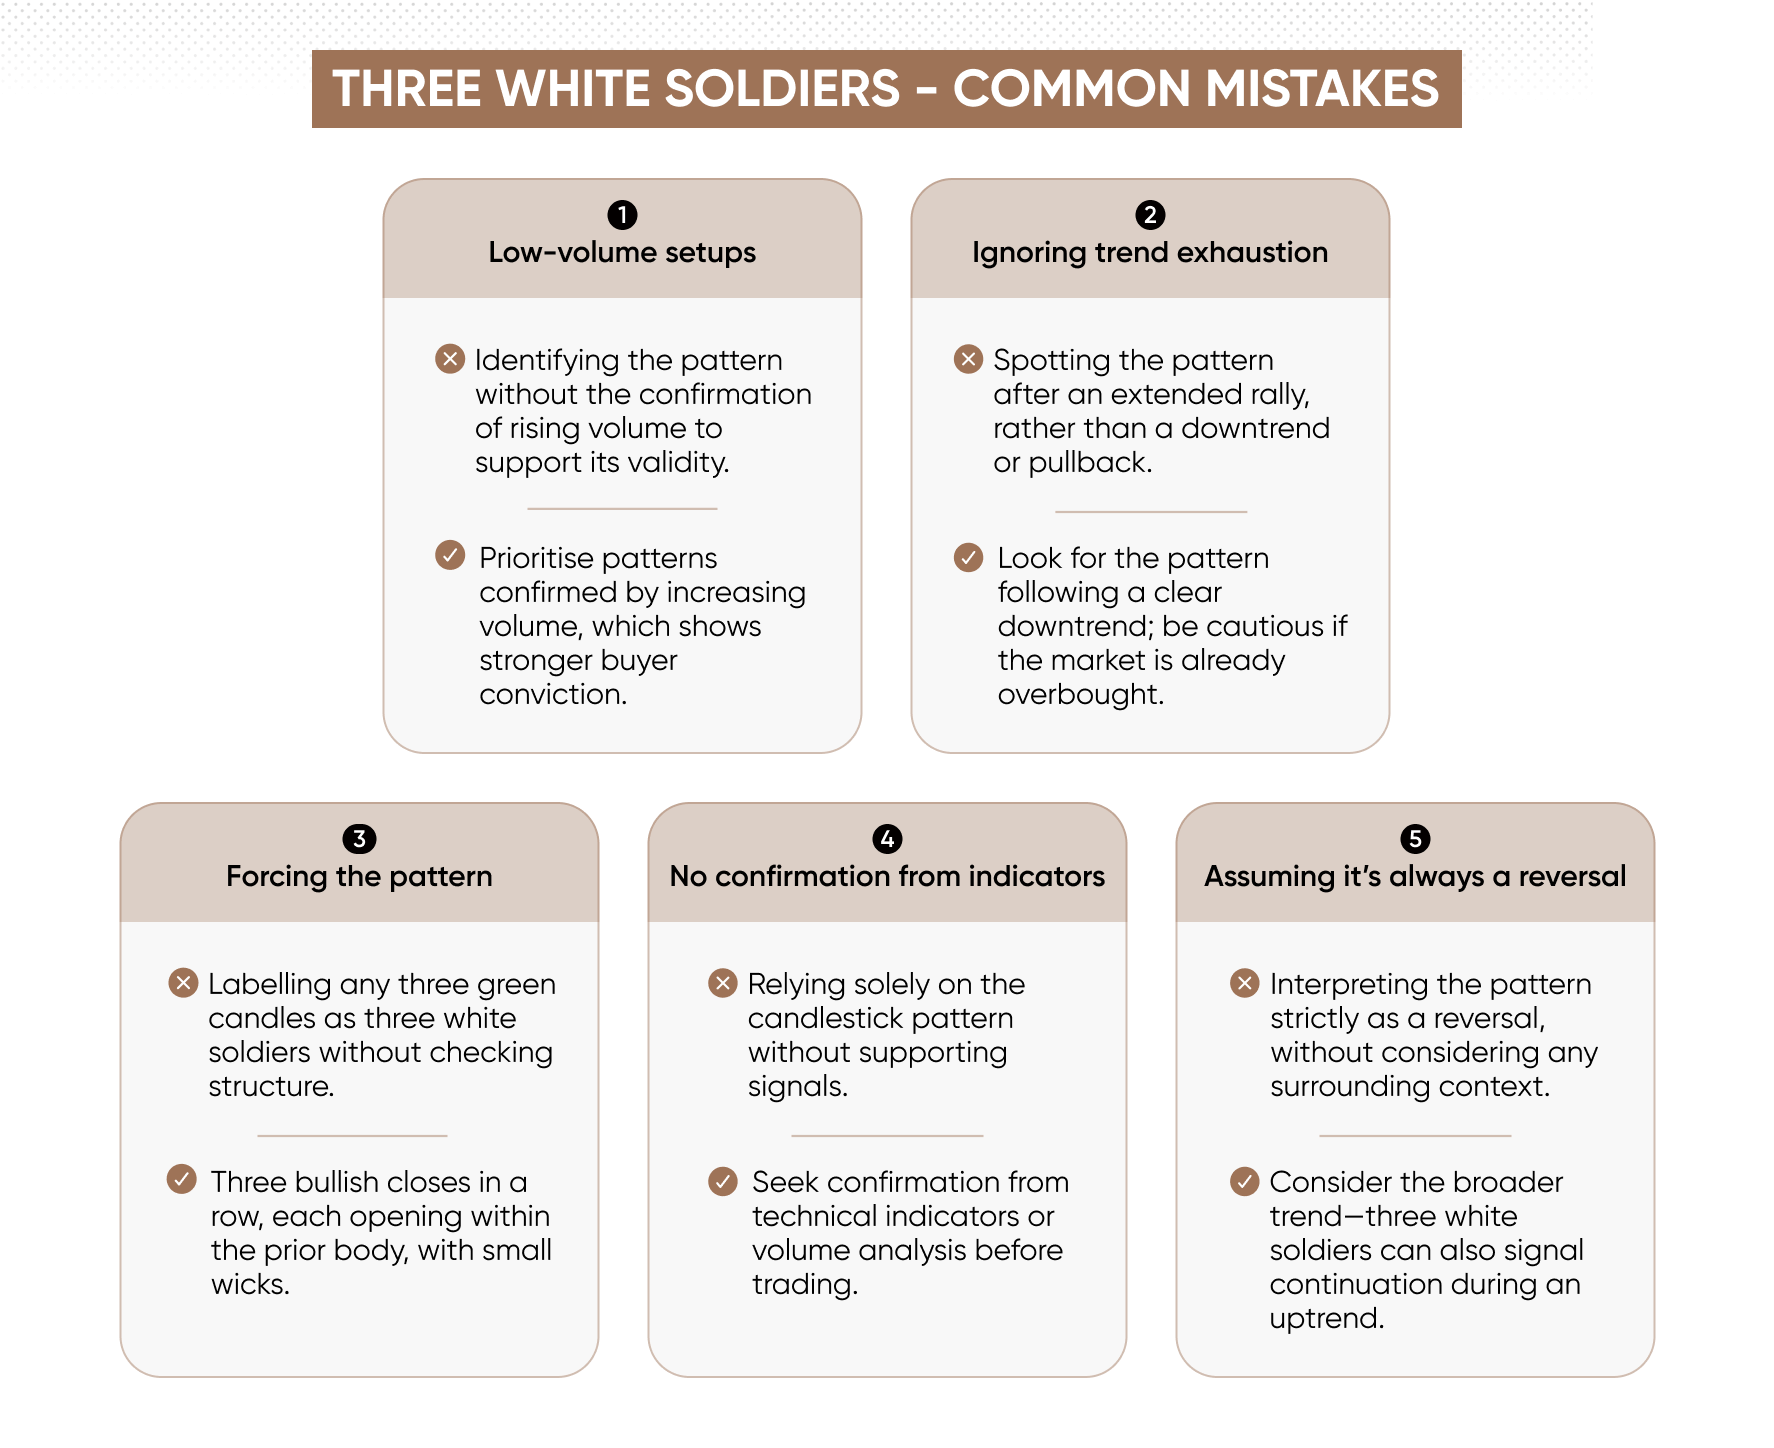
Low-volume setups
Without rising volume to support the candles, the move may lack conviction. Low participation suggests limited buyer strength – making it harder to distinguish a genuine reversal from short-term noise. Prioritise patterns that are accompanied by increasing volume where data is available, as this can signal stronger conviction behind the move.
Ignoring trend exhaustion
The three white soldiers pattern is meant to signal a bullish reversal after a downtrend. However, if it appears following an already extended rally, it may simply reflect temporary momentum rather than a fresh signal. Always check the prior trend – look for the pattern after a clear downtrend or pullback – and be cautious if the market is already overextended to the upside.
Forcing the pattern
Not every set of three green candles qualifies. Traders sometimes label loosely aligned candles as three white soldiers without checking the core structure. The rules are specific: three consecutive bullish closes, each typically opening within the real body (open–close range) of the one before it, with minimal wicks – although minor variations can occur.
No confirmation from indicators
You can confirm the three white soldiers candlestick pattern using tools like RSI, MACD, and EMA crossovers. For example, an RSI climbing out of oversold territory or a bullish divergence can help validate the reversal. Seek confirmation from additional technical indicators or volume analysis before acting on the pattern alone.
Assuming it's always a reversal
Although often discussed as a bullish reversal candlestick, the pattern can also appear during uptrends as a continuation signal. Analyse and consider broader market context, including prevailing trends, support and resistance, and other momentum signals.
Three white soldiers vs. other bullish patterns
While the three white soldiers is one of the more recognisable bullish reversal setups, it’s not the only pattern used to assess potential trend shifts. Here’s how it compares with some commonly traded bullish patterns:
|
Formation |
Potential signal |
Trading insight |
|
|
Three white soldiers |
Three long bullish candles; each opens within the previous real body and closes progressively higher |
Bullish reversal, typically after a downtrend |
Suggests strong and steady buyer control; confirm with volume or RSI |
|
Morning star |
Bearish candle, small-bodied candle (bullish or bearish), then a strong bullish candle |
Potential bottoming formation, bullish reversal |
Highlights weakening selling pressure followed by a bullish response; a gap between candles can add significance |
|
Bullish engulfing |
Small bearish candle followed by a larger bullish candle that engulfs it |
Bullish reversal after a down move |
Emphasises a sudden momentum shift; may be more effective near support or oversold levels |
|
Rising three methods |
Long bullish candle, three small candles within its range, then another bullish candle |
Bullish continuation during an uptrend |
Indicates a pause rather than reversal; can be used to confirm trend strength |
-
The three white soldiers pattern is characterised by its three sequential candles. Each candle opens within the real body of the prior candle, and each closes at a higher price than the previous one.
-
The bullish engulfing and morning star patterns rely on shorter sequences, often indicating faster sentiment shifts. These can appear earlier in a reversal but may require more careful validation due to their shorter duration.
-
The rising three methods pattern forms during an existing uptrend, and signals a potential continuation of the preceding trend.
Learn more about technical analysis with our 12 chart patterns for CFD traders.
Strategy example: How to trade the pattern
Now, let’s look at a hypothetical share CFD scenario:
Palantir (PLTR) share CFD – three white soldiers example
Formation
Suppose PLTR shares decline from 26 to 20 over several sessions, forming a short-term downtrend. Following this move, three consecutive bullish candlesticks appear. Each candle opens within the real body of the previous one and closes higher, showing strong real bodies and relatively short upper wicks.
Volume confirmation
Volume rises steadily across the three sessions, suggesting increasing buying interest. This adds weight to the bullish signal and helps distinguish it from a low-conviction bounce or short-covering rally.
Entry and trade setup
You decide to enter a long CFD position after the third candle closes around 21.70.
A stop-loss is placed just below the low of the first candle at 20.10, and the take-profit is set near a resistance zone at 24.00.
Assuming a position size of 1,000 PLTR CFDs:
-
If the price hits the take-profit at 24.00, the gross gain is around £2,300 ([(24.00 – 21.70) × 1,000] = £2,300).
-
If the stop-loss is triggered at 20.10, the gross loss is approximately £1,600 ([(21.70 – 20.10) × 1,000] = £1,600).
Leverage can amplify both gains and losses, depending on your margin. Spread and other charges (if applicable) would also affect the net result.
Pattern failure
However, if the pattern fails to hold — for example, if price breaks below 20.00 — this may suggest continued bearish pressure or a false signal, potentially invalidating the trade idea.
Example based on hypothetical price data. This illustration is for educational purposes only and does not reflect real market activity.
Past performance isn’t a reliable indicator of future results.
Explore our trading strategy guides for more technical techniques to consider in the markets.
FAQ
Is the three white soldiers pattern reliable?
The reliability of the three white soldiers candlestick pattern can depend on context. It’s most effective after a defined downtrend, with a clean formation, and ideally confirmed by rising volume or supporting indicators. On its own, the pattern is not a guarantee of trend reversal, and false signals can occur – particularly in low-volume environments or when the broader market lacks direction.
Can it appear in any timeframe?
Yes – the pattern can form on any time frame, from intraday to weekly charts. However, reliability tends to improve on longer time frames, such as daily or four-hour charts, where market noise is reduced. On shorter time frames, such as five-minute or 15-minute charts, the signal can be less consistent due to higher volatility and a lower signal-to-noise ratio.
Is volume confirmation necessary?
Volume confirmation is not mandatory, but it can improve confidence in the pattern. Rising volume across the three candles suggests broader buying participation and helps distinguish the move from a temporary bounce. Where volume is unavailable or inconsistent, traders may instead use volatility-based indicators or look to alternative confirmation tools.
Should I combine it with other indicators?
Yes – combining the three white soldiers candlestick pattern with other technical indicators can help validate the set-up and filter out weaker signals. No single candlestick pattern should be relied on in isolation – confirmation adds objectivity can help manage risk.