What is a symmetrical triangle pattern, and how does it work?
What is a symmetrical triangle pattern?
A symmetrical triangle pattern is a technical analysis formation characterised by two converging trendlines. These lines connect a series of lower highs and higher lows, forming a symmetrical, triangular shape on the chart.
This pattern indicates a period of consolidation, reflecting a balance between buyers and sellers, with neither side currently dominating price movement. It’s regarded as a potential precursor to a breakout, with the eventual direction – bullish or bearish – commonly determined after the price breaches one of the trendlines.
How does a symmetrical triangle pattern form?
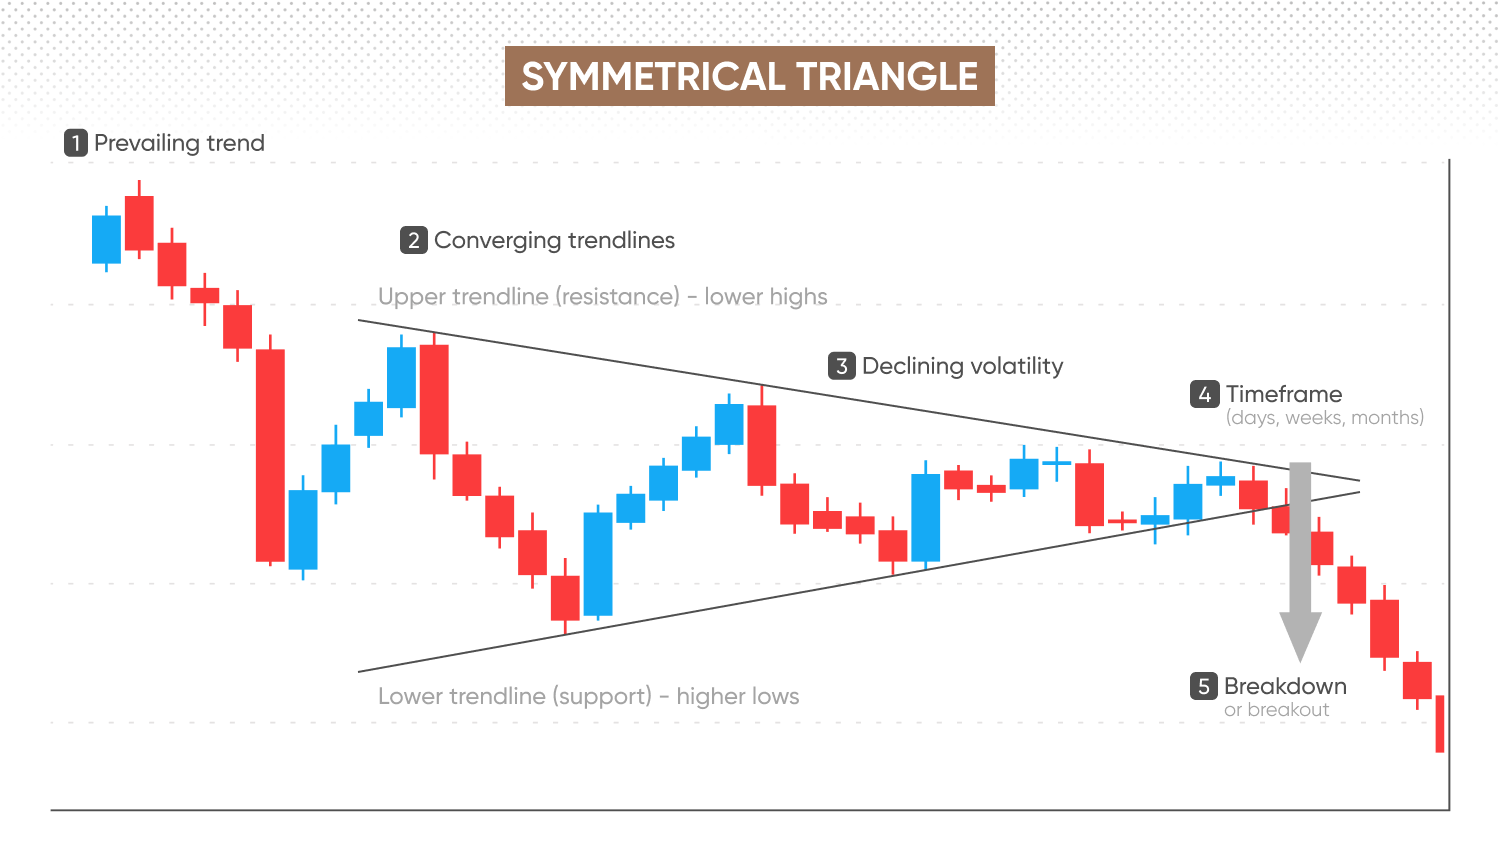
To identify a symmetrical triangle pattern, observe the following price movements:
-
Prevailing trend (bullish or bearish) – look for a preceding trend before the symmetrical triangle forms; the pattern often emerges during a pause while market participants reassess their positions.
-
Converging trendlines – draw two lines, an upper trendline connecting successive lower highs and a lower trendline linking successive higher lows. The narrowing range indicates falling volatility and growing indecision.
-
Declining volatility – observe a gradual reduction in price volatility as the triangle develops. Price swings between the converging trendlines become smaller, reflecting a balance between buying and selling pressures.
-
Timeframe – symmetrical triangles that develop over days, weeks or months may imply a stronger breakout potential, whereas very short-term patterns might produce weaker signals.
-
Breakout – trading volume typically contracts during formation; a pronounced increase at the breakout can support the pattern’s validity, although it doesn’t guarantee the direction or magnitude of the move.
What does a symmetrical triangle signal in technical analysis?
In technical analysis, a symmetrical triangle represents a period of market indecision and consolidation ahead of a potential breakout. The formation reflects a balance between buyers and sellers, with neither side showing clear dominance. As a result, price action becomes progressively narrower, forming a triangle shape with each successive high being lower and each successive low being higher.
As the pattern forms, watch for a breakout above or below the triangle’s converging trendlines – ideally confirmed by a noticeable increase in trading volume – to determine the potential direction. A breakout to the upside can signal emerging bullish momentum, while a downside breakout may indicate strengthening bearish sentiment.
Past performance isn’t a reliable indicator of future results.
How do you trade symmetrical triangle patterns?
- 1. Confirm the breakoutWait for a decisive price breakout through either the upper or lower trendline. A breakout is often accompanied by an increase in trading volume, which can suggest stronger market interest, though this isn’t always present. Increased volume can help reduce the risk of false moves, but it’s not guaranteed.
- 2. Entry strategyEnter the trade only after confirming the breakout. Some traders enter immediately upon breakout, while others prefer waiting for a retest. A retest occurs when price briefly returns to the broken trendline, offering extra confirmation and potentially lowering the risk of false signals.
- 3. Set your stop-lossPlace your stop-loss slightly below the recent swing low for bullish breakouts, or just above the recent swing high for bearish breakouts. Ensure your stop-loss allows for market volatility to avoid a premature exit.
- 4. Measure your profit targetEstimate your price target by measuring the vertical height at the triangle’s widest point and projecting that distance from the breakout level – upwards for bullish breakouts, downwards for bearish ones. Treat this as a guideline rather than a fixed goal, and consider nearby resistance or support as practical exit points.
- 5. Use additional confirmationIncorporate other technical indicators like the relative strength index (RSI) or moving average convergence divergence (MACD). These additional confirmations can improve reliability. Signals such as bullish divergence can support a bullish breakout, while bearish divergence may support a bearish breakout.
- 6. Manage your riskAdjust your position size to fit your risk tolerance and account size. As the trade moves in your favor, consider using trailing stops to protect profits. Remember, standard stop-loss orders are not guaranteed, while guaranteed stop-losses usually come with a fee.
Bullish vs bearish symmetrical triangles: How do they differ?
Bullish and bearish symmetrical triangles may appear similar, but the underlying market dynamics and trading implications often differ according to the breakout direction.
Here's how each type of symmetrical triangle compares:
|
Bullish breakout |
Bearish breakout |
|
|
Expected outcome |
Potential bullish continuation or reversal |
Potential bearish continuation or reversal |
|
Breakout direction |
Upwards, above upper trendline |
Downwards, below lower trendline |
|
Sentiment shift |
Neutral/indecisive to more bullish |
Neutral/indecisive to more bearish |
|
Volume behaviour |
Declining volume during formation, with a possible increase at breakout |
Declining volume during formation, with a possible increase at breakdown |
Bullish symmetrical triangle
When the price breaks upward from a symmetrical triangle, it signals a bullish breakout. During the pattern’s formation, the market appears indecisive as prices consolidate and volatility diminishes. An upward breakout, however, indicates that buyers have regained control, shifting momentum in a bullish direction.
Confirmation of this bullish strength is stronger when the breakout is accompanied by increased trading volume. To estimate potential price targets, traders often project the height of the triangle upward from the breakout point – though, as with any pattern, outcomes are not guaranteed.
Bearish symmetrical triangle
Conversely, a breakout to the downside signals bearish momentum. While the symmetrical triangle also starts with uncertainty and consolidation, sellers ultimately gain the upper hand, driving prices lower.
A bearish breakout is often confirmed by a rise in trading volume, although this is not always present. Price targets are typically estimated by subtracting the triangle’s height from the breakout point. It’s important to remember this serves only as a guideline and is not a certainty.
Symmetrical triangles do not guarantee a specific outcome, and false breakouts can and do occur. To improve reliability, always confirm signals with additional technical indicators and stay mindful of the broader market context.
What is an example of symmetrical triangle breakout?
US 500 index CFD – bullish symmetrical triangle
Let’s say the US 500 index CFD is experiencing declining volatility following a strong bullish trend.
-
Formation – the price forms progressively lower highs and higher lows, clearly defining a symmetrical triangle pattern.
-
Volume confirmation – throughout the formation, trading volume declines, reflecting reduced trading activity and indecision among market participants.
-
Breakout – the US 500 CFD price breaks decisively above the upper boundary at 5,450, accompanied by a rise in trading volume, indicating bullish sentiment.
Conversely, had the price broken below the lower boundary at 5,400, traders might have anticipated a bearish move.
USD/JPY forex CFD – bearish symmetrical triangle
Now, let’s say the USD/JPY currency pair CFD, entered a period of consolidation following a bearish trend.
-
Formation – the USD/JPY price forms a symmetrical triangle, showing clear lower highs and higher lows.
-
Volume confirmation – trading volumes decline, supporting the presence of market indecision.
-
Breakdown – the CFD price breaks down decisively below the lower trendline at 160.50, with a heightened trading volume confirming bearish momentum.
Conversely, had the USD/JPY CFD price broken above 161.20, a bullish reversal might have been expected.
Past performance isn’t a reliable indicator of future results. Hypothetical examples do not reflect real events.
Common mistakes when trading triangle patterns
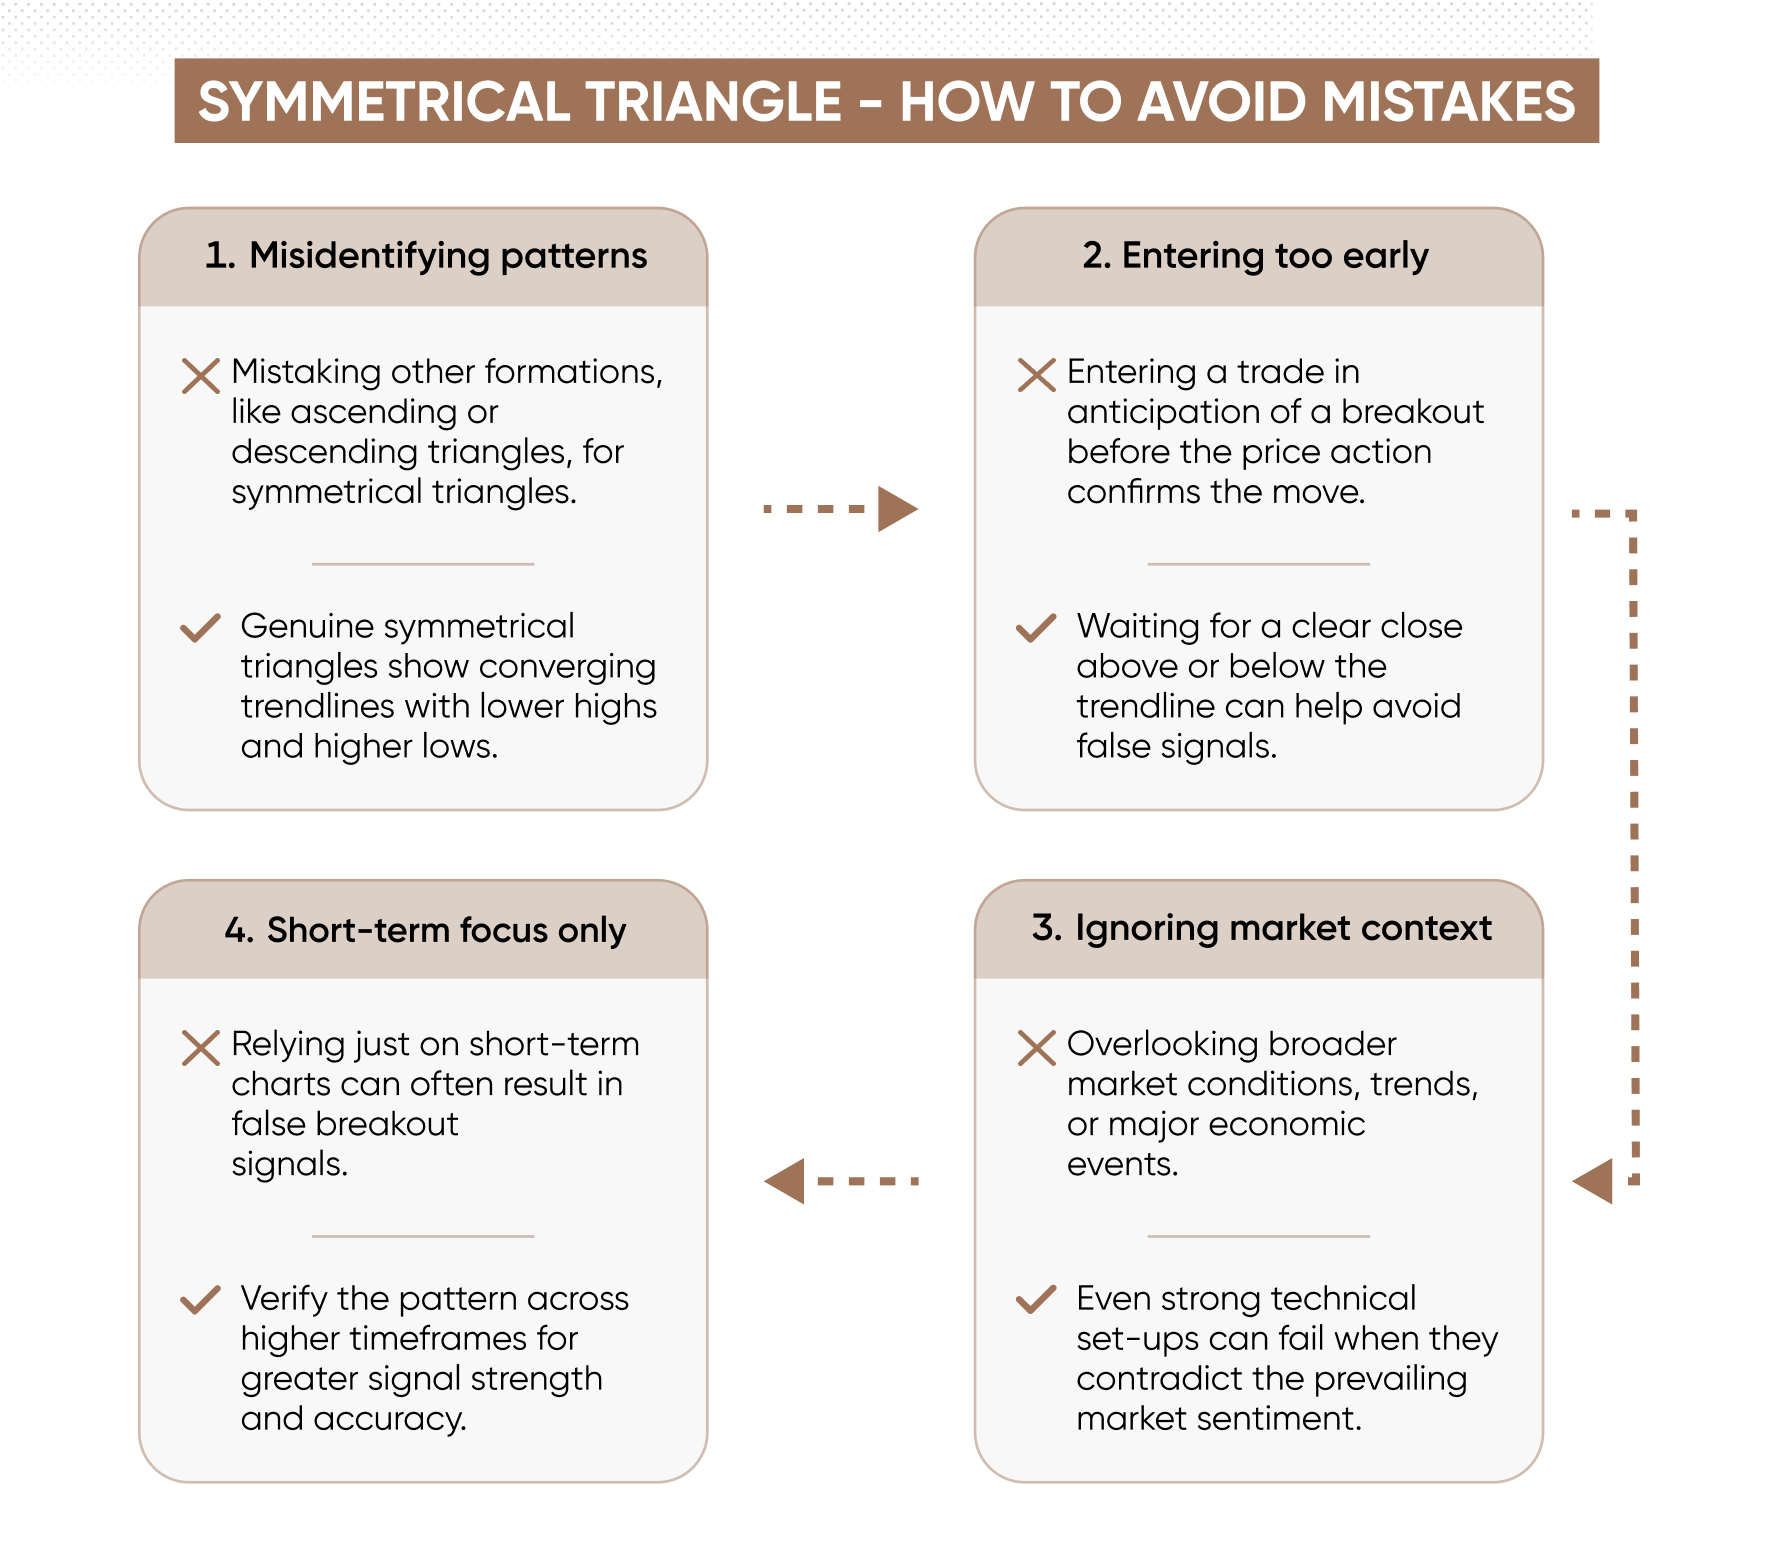
Even experienced traders can misstep when observing symmetrical triangle patterns, which can lead to potential losses. Here are some common mistakes – and how to avoid them:
Misidentifying other patterns as symmetrical triangles
Traders could mistakenly confuse other consolidation patterns, such as ascending or descending triangles, with symmetrical triangles. True symmetrical triangles are defined by converging trendlines that connect a sequence of lower highs and higher lows. While minor imperfections can occur in real markets, clear symmetry and consistent convergence are key. If the pattern doesn’t meet these criteria, it’s likely not a valid symmetrical triangle.
Entering trades before a confirmed breakout
Some traders act too quickly, jumping in before a decisive breakout. Remember, a symmetrical triangle represents market indecision – not direction. Entering a trade before the price closes convincingly above or below the trendlines – preferably with confirming factors like increased volume – can lead to false breakouts and reversals. However, be aware that not every valid breakout will be accompanied by a surge in volume.
Ignoring broader market context
Another pitfall is when traders focus solely on the pattern, ignoring wider market conditions. Even a technically solid breakout can fail if it goes against prevailing sentiment or coincides with major news or economic events. Always consider the broader market environment, using additional indicators or economic data to support your trading decisions.
Focusing solely on short timeframes
Relying only on short-term charts, such as five-minute or hourly timeframes, is a common mistake. Shorter timeframes can generate less reliable signals and more frequent false breakouts. Confirming triangle patterns on higher timeframes – like daily or weekly charts – can provide stronger validation and help inform more effective trading strategies.
FAQ
Is a symmetrical triangle pattern bullish?
A symmetrical triangle is not inherently bullish or bearish. It’s a neutral chart pattern that signals market consolidation, where buyers and sellers are in balance. The direction only becomes apparent once price breaks out of the triangle. An upside breakout is considered bullish, while a downside breakout is bearish. Wait for this confirmation, supported by additional technical indicators, rather than assuming the direction in advance.
What is the rule for a symmetrical triangle?
The classic rule for identifying a symmetrical triangle is to draw two converging trendlines: one along lower highs, the other along higher lows. The pattern is considered valid when at least two swing highs and two swing lows establish the converging shape. The breakout direction – up or down – often signals whether the trend will continue or reverse. Increased volume during the breakout is commonly sought as confirmation.
How to trade symmetrical triangles?
Trading symmetrical triangles generally involves waiting for a confirmed breakout above or below the pattern, ideally accompanied by rising volume. Traders often place entry orders just beyond the breakout level, with stop-loss orders set beyond the most recent swing high or low. Many use the widest part of the triangle to estimate profit targets. Entering before confirmation is risky; and risk management remains key.
Is the triangle pattern bullish or bearish?
A symmetrical triangle can precede either a bullish or bearish breakout. The pattern itself doesn’t predict direction – only that a significant move is likely. An upside breakout suggests bullish momentum; a downside breakout points to bearish sentiment. To interpret the signal, traders should consider context, including trend direction, volume, and confirmation from other technical indicators.