Piercing line candlestick pattern: a comprehensive guide

Remember, as with all technical analysis, while these patterns may give clues on potential future price action, past performance is not a reliable indicator of future results.
What is the piercing line candlestick pattern?
The piercing line is a bullish reversal pattern. It is important only when it follows a downtrend. The pattern shows that the price might go up soon.
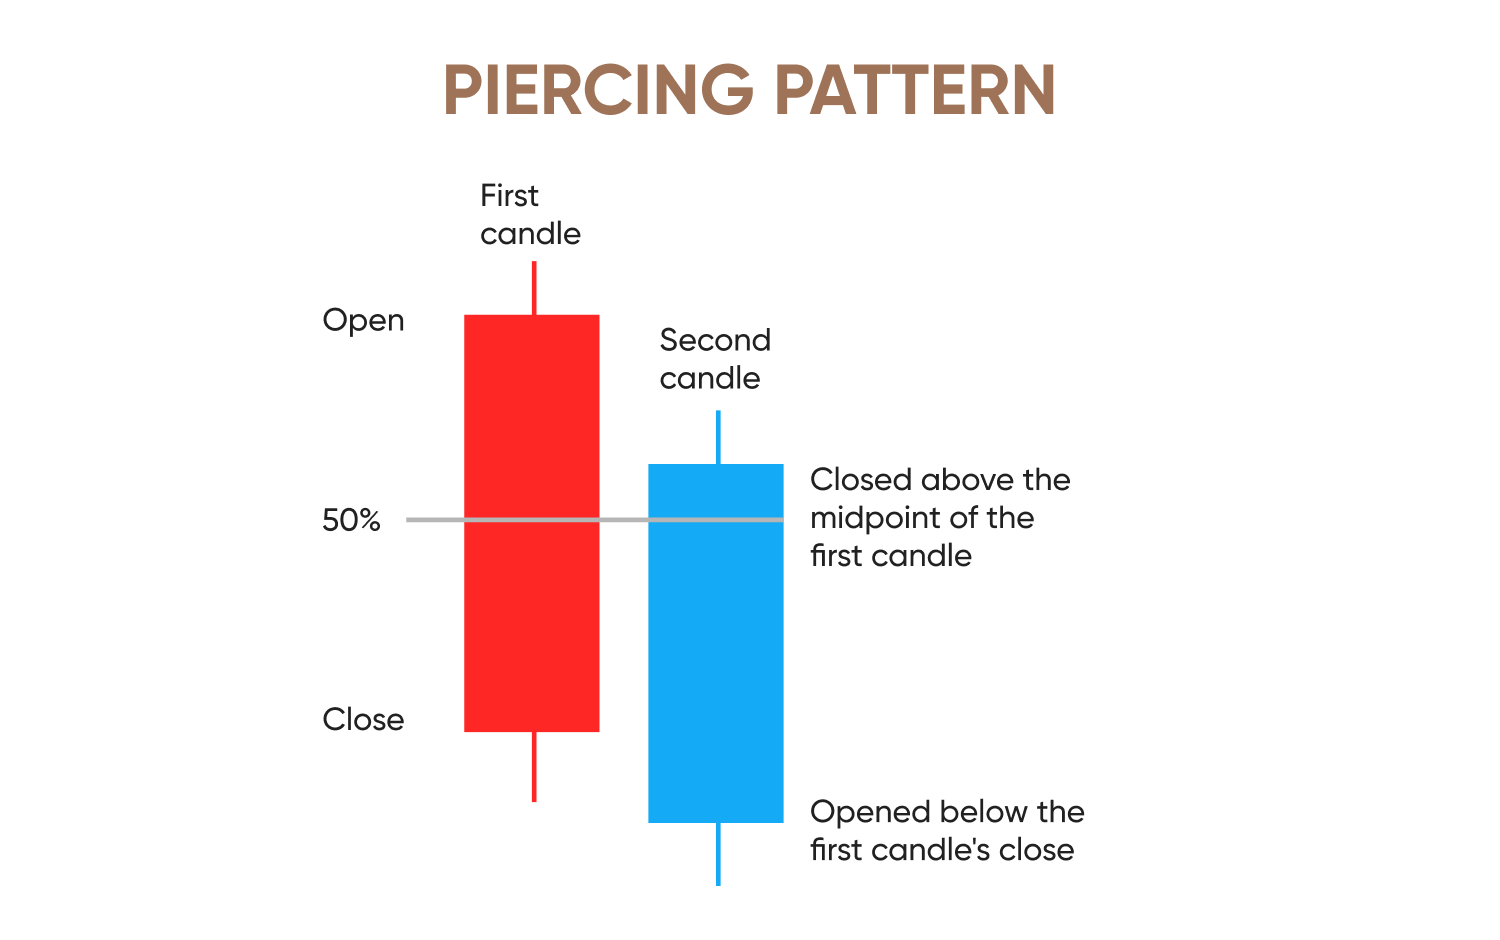
It is a 2-candle pattern – 1 bearish and 1 bullish. The first candle is long and red. The second candle is long and green. The name comes from how the pattern looks - The green candle ‘pierces’ the red one. It goes more than halfway into the red candle's body.
Past performance is not a reliable indicator of future results.
This pattern is a sign in a market where sellers were in charge. It tells you that buyers are gaining control and becoming stronger. This sets the stage for a reversal.
Remember that this pattern becomes meaningful only if it follows a decline in an asset’s price over a period of time. You would need an indicator to spot that trend – a trend indicator like moving averages can be used. If your chosen indicator shows a downward trend, you can look out for the piercing line pattern.
Suppose your trend indicator shows that prices are moving sideways. What do you do then? If there is no real downtrend, the piercing line pattern is not useful.
Understanding the psychology behind the pattern
The market is a battle. It is a battle between bulls and bears. Bulls want prices to go up. Bears want prices to go down. The piercing line pattern shows a shift in this battle.
First, the bears are winning. The price is going down. There is a long red candle. It shows strong selling pressure. The bears are confident. They think the price will keep falling.
Then, the second day starts. The price opens lower than the previous day's close. This is a gap down. The bears are happy. They think their control is strong. But then, something changes. The bulls start to buy. They buy aggressively. The price starts to rise. It rises all day long. It closes higher than the open. This makes the second candle green. The buyers are now very strong. They not only erased the gap down, but they also pushed the price up significantly.
The most important part is the close. The green candle closes high. It closes more than halfway up the body of the red candle. This is a huge sign. It shows that the bulls have overcome the bears. The bears who sold at the beginning of the day are now nervous. The bulls are confident. This shift in sentiment is the psychology. It is what makes the pattern a potential reversal signal.
How the piercing line pattern works
The piercing line pattern is easy to understand. It has 2 candles. Let's look at the mechanics.
Candle 1: this is the first candle. It is a long red candlestick. This candle confirms the current downtrend. It shows that sellers are in control. It has a long body. This means the price fell a lot during the trading period.
Candle 2: this is the second candle. It is a long green candlestick. This candle is the key. It opens with a gap down. This means its opening price is lower than the previous day's close. The bears are still in control at the start. However, the bulls take over. The price goes up all day. It closes much higher.
The most crucial part is the close of the second candle. The green candle must close above the midpoint of the first red candle's body. If it closes below the midpoint, it is not a true piercing line. The higher it closes, the stronger the signal. If it closes near the top of the body of the red candle, you can consider it as a very strong signal. This shows that the bulls are very powerful.
How to identify the piercing line pattern on a chart
You would need to check a few things to correctly identify a piercing line pattern on a chart. These are called the confirmation criteria.
- Look for a downtrend: the pattern is a reversal signal only after a clear downtrend. If the market is very volatile or you’re unable to identify a clear trend, the signal provided by the pattern is a weak one.
- The first candle must be bearish: long red candle.
- The second candle must be bullish: long green candle.
- Gap down: the second candle must open below the close of the first candle. This is very important.
- The close condition: does the green candle pierce the red one? The green candle must close above the midpoint of the red candle's body (area between the open and close). Remember that wicks are not included in this assessment.
Let's look at some examples. You can see this pattern in different markets. You can find it in forex and stocks. The rules are the same for all of them.
For example, on a stock chart, you see a stock price falling for several days. Then, a long red candle forms. The next day, the stock opens lower. But by the end of the day, it has a long green candle. This green candle closes more than halfway into the red candle. This is a piercing line pattern. It suggests a potential price increase.
Common mistakes happen when the conditions are not met. Some traders see a small green candle that closes just below the midpoint. They think it is a piercing line. This is a false signal. Always check for the midpoint rule. Also, do not trade this pattern in a sideways market. It is not designed for that. It needs a downtrend to be valid.
Piercing line pattern vs. other reversal patterns
The piercing line is not the only reversal pattern. It is good to know its differences from others. This helps you understand its strength.
Piercing line vs. dark cloud cover
The dark cloud cover is the exact opposite, as it is a bearish reversal pattern. It comes into play after an uptrend. First, a long green candle appears. Then, a red candle gaps up and closes more than halfway down the green candle's body. It signals that the price might fall. The logic is the same, just in the opposite direction.
Piercing line vs. engulfing pattern
The bullish engulfing pattern is very similar. It also has a red and a green candle. The key difference is the size. In the engulfing pattern, the second green candle completely engulfs (or covers) the first red candle. It is a stronger signal than the piercing line. The piercing line only "pierces" the first candle. It does not cover it completely. The engulfing pattern shows a more complete victory for the bulls.
Piercing line vs. hammer and morning star
The hammer is a single-candle pattern. It has a small body and a long lower wick. It also signals a bullish reversal. But it does not have the 2-candle structure or the gap down.
The morning star is a 3-candle pattern. It has a long red candle, a small "doji" or spinning top in the middle, and a long green candle. The Morning Star is often seen as a stronger signal because it shows indecision (the middle candle) before the reversal.
How to trade the piercing line candlestick pattern
Trading the piercing line pattern requires a plan. You need entry, exit, and stop-loss points.
Entry criteria
You should not enter a trade right when the pattern forms. You need confirmation. The confirmation is the next candle. Wait for the candle after the piercing line to close. If it is green and closes higher, this is a strong confirmation. You can enter the trade after this candle closes. Some traders wait for the price to break the high of the piercing line pattern.
It is also good to look for other things. For example, is the pattern forming near a support zone? A support zone is a price level where the price has stopped falling before. If the pattern forms at a support level, the signal is much stronger.
Exit points
You can use a few strategies for exiting. One way is to set a take-profit level. This can be a previous resistance level. A resistance level is a price where the price has stopped rising before. Another way is to use a trailing stop-loss. This moves your stop-loss up as the price rises.
Risk management
This is the most important part. It’s advisable to use a stop-loss. A stop-loss is an order to sell. It limits your loss if the trade goes against you. For the piercing line pattern, a good stop-loss may be placed below the low of the second green candle. If the price falls below this point, you might consider the pattern invalid and decide to exit the trade.
Trade the piercing line pattern without risking real money. Open a demo account.
Best indicators to use with the piercing line pattern
Indicators can help confirm the pattern. They give you extra confidence.
RSI (relative strength index): measures momentum
It tells you if a market is overbought or oversold. If the piercing line pattern forms when the RSI is below 30, this is a strong signal. It means the market is oversold. The price is due for a reversal.
Stochastic oscillator: similar to RSI
It also measures momentum. If the Stochastic is below 20 when the pattern forms, it confirms the oversold condition. This makes the reversal signal stronger.
MACD (moving average convergence divergence): shows relationship between 2 moving averages
When the piercing line pattern forms, look for the MACD lines to cross over. A bullish crossover is when the MACD line crosses above the signal line. This confirms the new upward momentum.
2 important things to keep in mind
Volume confirmation: look at the volume during the 2 candles
The second green candle should have high volume. High volume on the green candle shows strong buying pressure. It tells you that many traders are buying. This makes the signal much more reliable. Low volume on the second candle is a weak signal.
Multiple timeframes: more confident trading
You can use different timeframes. For example, you see a Piercing Line on a daily chart. Then, you can look at the 4-hour chart. You might see other bullish signals there. This gives you more confidence.
Trading strategies based on the piercing pattern
You can use different trading strategies. It depends on your risk tolerance.
However, neither approach guarantees profits, and past performance does not guarantee future results.
Conservative strategy: for traders who are careful
You wait for full confirmation. You see the Piercing Line. You then wait for the next candle to close higher. You also check your indicators. You want the RSI to be oversold. You want high volume on the second candle. You enter the trade only when all your conditions are met. This strategy has fewer trades but higher success rates.
Aggressive strategy: for traders who are willing to take more risk.
You enter the trade as soon as the second green candle closes. You do not wait for the next candle. You rely on the pattern itself. This strategy has more potential for profit but also more risk of false signals.
Multi-candle and multi-timeframe setups: combine strategies
For example, you see a Piercing Line on the daily chart. You then drop to the 1-hour chart. You look for a smaller bullish pattern on the 1-hour chart to confirm. This adds more layers of confirmation. It makes your trades stronger.
Ready to use the piercing line pattern in your trading strategy? Open a live account.
Pros and cons of the piercing pattern
Like any tool, the piercing line has strengths and weaknesses.
Strengths
- Simplicity: very easy to spot, has a clear 2-candle structure
- Early reversal signal: often appears early in a new uptrend, allowing you to enter a trade early and give you a better risk-to-reward ratio
- Clear logic: simple psychology behind the pattern - the shift from selling to buying is easy to understand.
Weaknesses
- False signals: pattern can sometimes fail. The price might go up a little and then continue falling. This is why you need confirmation.
- Dependence on context: not a magic bullet. It only works well after a strong downtrend. If you ignore the context, you will get false signals.
- Risk of gap down: sometimes, the price will open so low that the green candle does not have a chance to pierce the first candle.
Pro tip: avoid using this pattern in a choppy or flat market. It is not designed for that. Do not use it without other technical analysis indicators. It is best used with other tools like RSI, support zones, and volume.
Backtesting and statistical performance of the pattern
Backtesting is important. It tells you how well a pattern worked in the past. It gives you an idea of its reliability.
Research insights
Many studies have been done on candlestick patterns. Some studies show that the piercing line pattern has a good success rate. The success rate is higher when used with other indicators. The success rate varies from market to market. It also depends on the timeframe you are using.
Success rate and reliability
The success rate of the piercing line pattern is generally good. It can be a very reliable signal. But its reliability depends on the confirmation criteria. A Piercing Line with high volume and an oversold RSI is much more reliable. A weak Piercing Line, without confirmation, is not reliable.
What historical data tells us
Historical data shows that the pattern can be profitable under certain conditions. But past performance is not a reliable indicator of future results, and you should use a proper trading plan and apply sound risk management.