Understanding the pennant pattern: identification, interpretation, and trading techniques

Have you ever watched a flag flying on a windy day? It whips around on its pole for a moment, appearing chaotic. However, you know it's still firmly attached and will ultimately fly in the same direction as the wind. In trading, the pennant pattern is often used to describe a similar period of short-term consolidation within a broader trend. It doesn’t predict what will happen next, but it can help traders interpret market pauses and potential continuation scenarios based on past price behaviour.
This guide explains what this continuation pattern is and the psychology behind its formation. We’ll also break down the pattern’s key characteristics, differentiate it from similar patterns like flags and triangles, and explore the two main types: the bullish pennant and the bearish pennant. Finally, we’ll equip you with actionable strategies on how to trade pennant patterns, including entry and exit points, risk management, and which indicators work best in tandem with them.
Remember, while chart patterns may give clues on potential price action to come, past performance is not a reliable indicator of future results.
What is a pennant pattern?
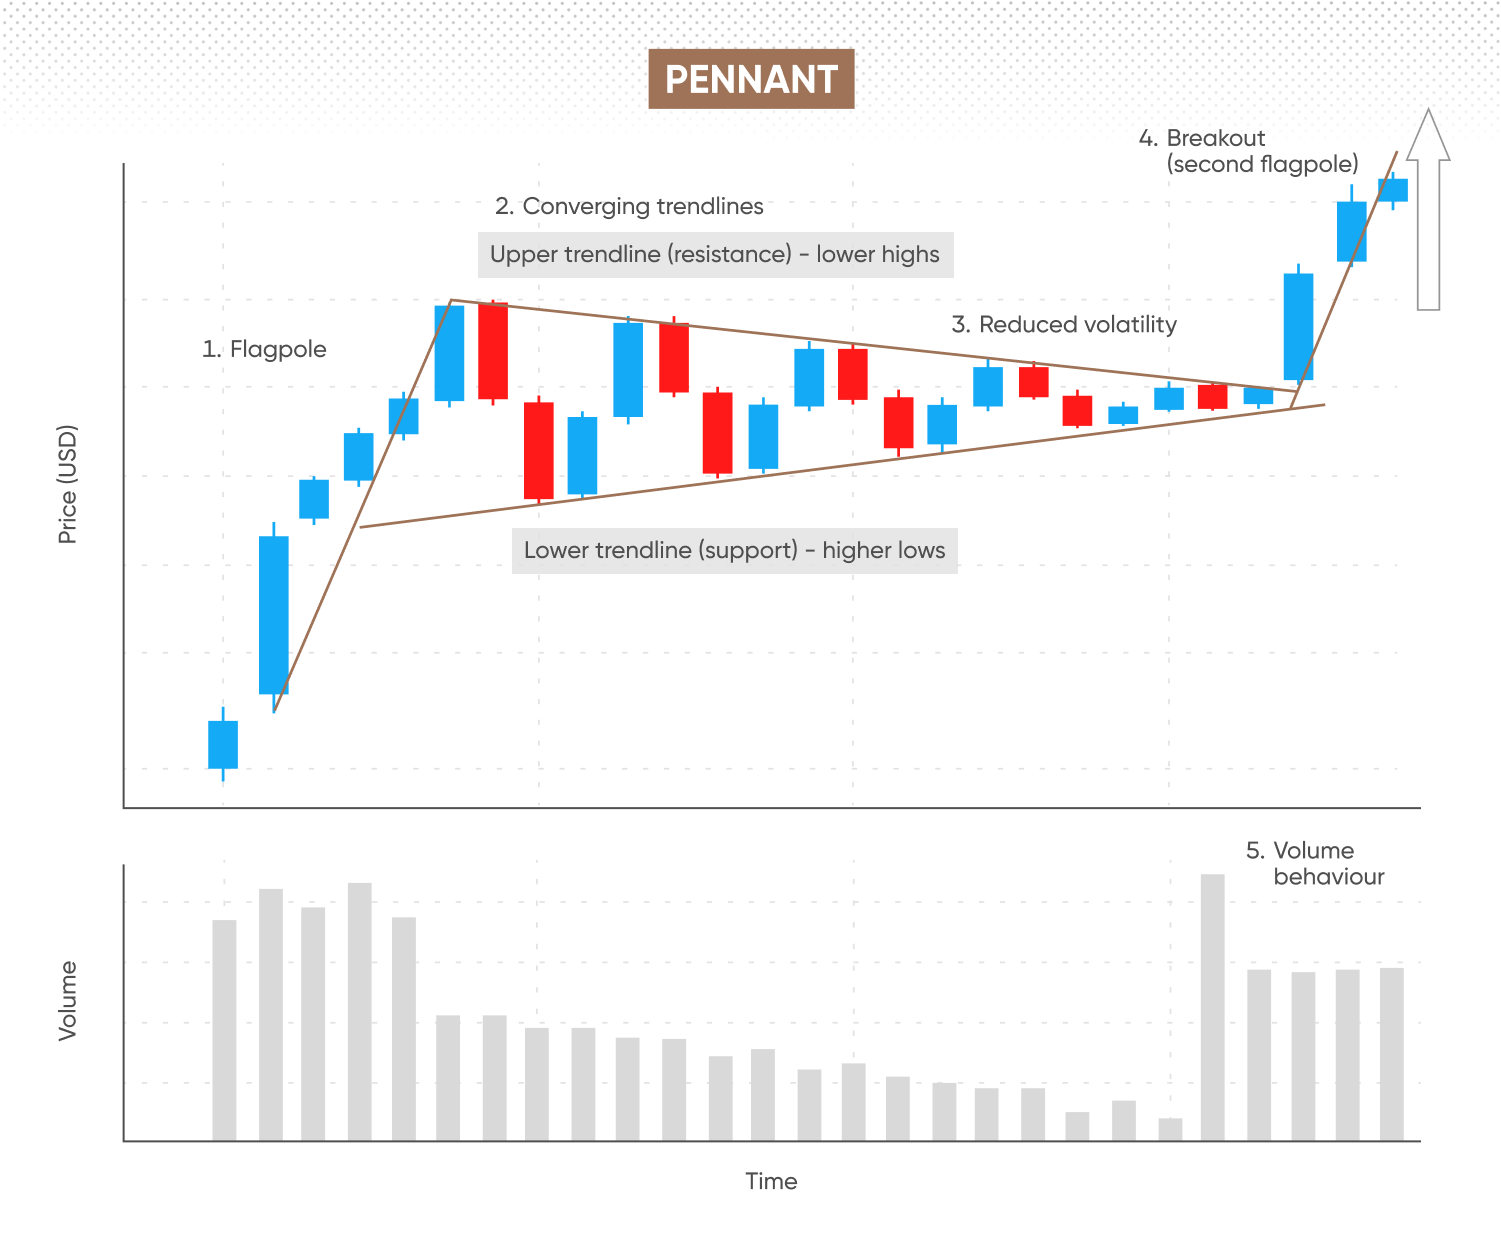
A pennant is a continuation pattern that shows a brief pause during a strong, ongoing trend. After this pause, the trend tends to continue in its original direction. This makes the pennant a short-term consolidation pattern that typically lasts between 1 and 3 weeks. The pattern comprises 3 distinct parts: a ‘flagpole,’ the pennant itself, and the ‘breakout.’
The flagpole is the first part of the pattern. It is an almost vertical price move that comes before the consolidation phase. The flagpole is accompanied by high trading volumes, reflecting a strong push by either buyers or sellers. After this sudden price surge or decline, the price action begins to consolidate into a smaller triangle shape. This is the pennant, which is formed by two converging trendlines connecting a series of lower highs and higher lows. The consolidation is a short period of relative calm, during which volatility decreases. Finally, the pattern is completed by a breakout from the pennant in the direction of the original flagpole. This breakout indicates that the trend has resumed in its original direction.
The psychology behind the formation of the pennant pattern provides a deeper understanding of the chart pattern’s reliability. The flagpole occurs due to conviction among buyers or sellers, which creates momentum. For a bullish pennant, a sudden increase in buyers pushes the price up rapidly. As the price reaches a high, some of these early buyers decide to take profits. Meanwhile, a new group of buyers, who missed the initial move, are waiting for a dip to enter.
This battle between profit-takers and new entrants creates the small pennant. The volume typically decreases during this period because both sides are hesitating. Eventually, the new buyers overwhelm the sellers, the price breaks out, and the original trend continues.
The opposite happens for a bearish pennant. Here, early sellers take profits, and new sellers enter on a brief rally. This leads to the price returning to the original downtrend.
Want to try out this chart pattern? Open a demo account.
Key characteristics of pennant patterns
A pennant isn’t just any small triangle. It has specific features that set it apart.
Past performance is not a reliable indicator of future results.
First is the shape, which is a small, symmetrical triangle. The converging trendlines are fairly steep, reflecting the quick, short-term nature of the consolidation. Unlike other chart patterns, a pennant must always follow a flagpole, which is a strong, almost vertical price move that is much larger than the pennant itself.
The volume behaviour is another key feature. During the formation of the flagpole, volume tends to be high, indicating strong conviction. As the price enters the consolidation phase of the pennant, volume may often drop meaningfully. This shows that market participants are pausing, and a period of indecision is taking place. This low volume is a key characteristic. After this, for the pattern to be considered valid, the breakout from the pennant must be accompanied by a sharp and substantial increase in volume. This confirms that the original momentum has returned, and the trend is likely to continue. A breakout on low volume is often a false signal.
The duration and timeframe of a pennant are also important. Pennants are short-term patterns. They usually form over a period of 1 to 3 weeks on daily charts. They can be seen on shorter timeframes like hourly or 4-hour charts, where they may last for a few hours or a day. A consolidation phase that lasts for several weeks or months is more likely to be a larger triangle or wedge pattern, not a pennant.
Finally, it is crucial to understand the breakout direction. A pennant is a continuation pattern, meaning the breakout is expected to occur in the same direction as the flagpole. A bullish pennant will break out to the upside, while a bearish pennant will break out to the downside. The flagpole’s direction dictates the expected breakout direction.
Types of pennant patterns
While the underlying structure and psychology of a pennant pattern remain the same, their direction classifies them into two primary types: bullish and bearish. Understanding the difference helps in informed decision-making.
Bullish pennants
A bullish pennant forms during an established uptrend. It begins with a strong upward price movement (the flagpole), followed by a brief consolidation period where the price action forms a symmetrical pennant shape. The converging trendlines indicate a temporary battle between buyers and sellers, with sellers taking profits and buyers waiting to enter at a lower price. This pattern resolves when the price breaks out decisively above the upper trendline of the pennant, with a noticeable increase in volume. The breakout confirms that the buyers have regained control, and the uptrend is set to continue. The target for a bullish pennant is typically measured by taking the length of the flagpole and projecting it from the point of the breakout.
Bearish pennants
The bearish pennant is the inverse of the bullish pennant. It forms during an established downtrend. The pattern starts with a sharp downward price movement (the flagpole), followed by a brief consolidation where the price action forms a symmetrical pennant. In this case, early sellers take profits, and new sellers wait for a slight bounce before re-entering their short positions. The consolidation concludes when the price breaks out decisively below the lower trendline of the pennant, accompanied by a surge in volume. This signals that the sellers have overpowered the buyers, and the downtrend is likely to continue. The price target is calculated by measuring the height of the flagpole and subtracting it from the breakout point.
Neutral pennants
Technically, there is no such thing as a ‘neutral pennant’ because a pennant, by its very nature, is a continuation pattern. The term ‘neutral’ might be used to describe the indecisive, low-volume consolidation phase itself. However, the pennant’s purpose is to signal a continuation of the previous trend. The ‘neutral’ period is simply a temporary state before a directional move is resumed. A trader’s job is not to guess the direction of the breakout but to wait for it to be confirmed before taking a position.
Learn more about reading chart patterns to strengthen your technical analysis.
How to identify a pennant on a chart
Learning how to identify a pennant pattern on a chart is a skill that takes practice. Following a step-by-step process can help you spot these patterns reliably.
-
Step 1: spot the flagpole: the first thing to look for is a strong, almost-vertical price movement. This impulsive move, the flagpole, must precede the consolidation. A pennant cannot form without this initial thrust.
Step 2: locate the consolidation: following the flagpole, look for a period of price consolidation where the price starts to make lower highs and higher lows, forming a small symmetrical triangle. - Step 3: draw the trendlines: connect the swing highs with a descending trendline and the swing lows with an ascending trendline. These two lines should converge, forming the pennant shape.
- Step 4: analyse the volume: this is a crucial step. The volume should have been high during the flagpole and should visibly decrease during the consolidation period within the pennant.
- Step 5: wait for the breakout: the pattern is not complete until a decisive breakout occurs. The price must close above the upper trendline for a bullish pennant or below the lower trendline for a bearish pennant.
- Step 6: confirm the breakout with volume: the breakout candle should be accompanied by a considerable increase in volume, ideally greater than the average volume of the consolidation period. A breakout on low volume is often a false signal.
The pennant pattern can be identified on various timeframes, from intraday charts (15-minute, 1-hour) to daily and weekly charts. The principles remain the same, but the duration of the consolidation will vary.
How to trade pennant patterns
Trading the pennant pattern requires a disciplined approach and a focus on confirming the pattern and managing risks.
Entry strategies
The golden rule for entering a trade is to wait for the breakout confirmation. Do not anticipate the breakout. A common entry strategy is to place a buy stop order just above the upper trendline for a bullish pennant or a sell stop order just below the lower trendline for a bearish pennant. A more conservative approach is to wait for a candle to close outside the pennant, confirming the breakout, and then enter on the next candle. This reduces the risk of a false breakout, although it may lead to a slightly less favourable entry price.
Stop-loss and take-profit placement
Placing a proper stop-loss is critical for risk management. A logical place for a stop-loss is just inside the pennant’s consolidation area, typically at the lowest swing low for a bullish pennant or the highest swing high for a bearish pennant. This placement ensures that if the breakout fails and the price re-enters the consolidation zone, losses are limited by closing the position.
To set a take-profit target, the most common technique is the ‘flagpole measurement.’ You measure the distance from the beginning of the flagpole to the start of the pennant’s consolidation. Then, project this distance from the point of the breakout to get your price target. For example, if the flagpole was a $5 move, you would target a $5 move from your entry point.
Volume confirmation and breakout strength
As mentioned earlier, volume is a key component. A strong, valid breakout is always confirmed by a surge in volume. It’s a sign that the momentum and conviction that led to the flagpole are back in full force. You can use a simple volume indicator to monitor this. Other metrics, like the length of the breakout candle or the speed of the breakout, can also indicate its strength. A long, powerful candle closing well outside the pennant’s trendline is a strong sign of a valid breakout.
Risk management and trade sizing
Proper risk management is crucial for all trading strategies. Before entering a trade, you should know exactly where your stop-loss will be placed. The distance between your entry point and your stop-loss is your risk per unit. You can then size your position based on your total account size and the maximum amount you are willing to risk on a single trade (such as 1%-2%). This ensures that even if you are stopped out, the loss will be manageable.
Mistakes to avoid
The most common mistakes when trading pennants include entering too early, before the breakout is confirmed, and failing to place a stop-loss. Another error is to ignore the volume signal. A breakout on low volume is a red flag. Always wait for all the elements of the pattern to confirm before acting.
Learn more about risk management to bolster your trading strategy.
Trading bullish vs. bearish pennants
Since the psychological backdrop and market context differ, the setups for bullish and bearish pennants can also differ considerably.
Bullish pennants often form in strong, rising markets, driven by a positive sentiment. The flagpole is created by excitement and optimism among market participants. During the pennant, there's a brief period of doubt, but the overall bullish sentiment usually prevails. Traders look for opportunities to ‘buy the dip’ in an uptrend. A successful bullish trade might be a stock that has a strong earnings report (flagpole), consolidates for a few days (pennant), and then breaks out to continue its rally.
Bearish pennants are found in declining markets and are fuelled by fear and panic. The flagpole is a sharp, fear-driven sell-off. The consolidation period is a brief moment of hope for buyers that the selling is over, but this hope is often dashed as the underlying fear takes over. This leads to a breakout to the downside. An example of this is a company issuing a disappointing profit warning (flagpole), a brief consolidation as some traders try to pick the bottom (pennant), and then a renewed wave of selling as the bad news sinks in (breakout). The trading psychology here is about reacting to the dominant emotion of fear.
Indicators that work well with pennants
Combining the pennant pattern with other technical indicators provides additional confirmation. Popular technical indicators for this include:
Moving averages
Using a moving average (MA), like the 50-day or 200-day simple moving average, can help confirm the overall trend. For a bullish pennant, the price should be trading above the MA. For a bearish pennant, the price should be below it. The MA can also act as a dynamic support or resistance level during the consolidation.
Volume indicators
On-Balance Volume (OBV) is a momentum indicator that uses volume flow to predict price changes. During the consolidation of a pennant, the OBV tends to be relatively flat or declining. A breakout is confirmed by a strong increase in OBV. Similarly, volume profile is another indicator that can show you where the bulk of trading activity took place. This helps identify potential support or resistance levels around the pennant.
Fibonacci retracement
Fibonacci retracement levels can be used to identify potential support within a pennant. For a bullish pennant, the consolidation might retrace to 38.2% or 50% of the flagpole’s move. This can provide a tighter area to monitor for a breakout.
RSI & MACD
The relative strength index (RSI) is a momentum oscillator. For a bullish pennant, the RSI might cool down from overbought conditions during the consolidation and then surge back up on the breakout. While using moving average convergence divergence (MACD), look for the MACD line to cross above the signal line as the breakout occurs, confirming a shift in momentum.
Combining these indicators increases confidence in the signals. For example, a bullish pennant breakout on a daily chart would be a high-probability trade if it is accompanied by a volume spike, the price is above the 50-day MA, and the RSI is trending up, all at the same time.
Benefits and risks of pennant patterns
The pennant pattern is popular because it provides clear, actionable signals. With its converging trendlines, the pattern offers defined entry and exit zones. The flagpole measurement provides a logical price target. This allows traders to manage their trades with precision. Also, the tight consolidation area provides a clear place to set a stop-loss. When a pennant pattern works as intended, it can offer a high reward-to-risk ratio.
However, like all indicators, this pattern also has some limitations. The primary risk associated with the pennant pattern is a false breakout. A false breakout occurs when the price moves outside the pennant’s trendline but then quickly reverses and moves back into the consolidation or even breaks out in the opposite direction. This is why waiting for volume confirmation is so important.
The short lifespan of pennants is both a benefit and a limitation. While it means you don’t have to wait long for a resolution, it also means the pattern is not as reliable as longer-term formations. It’s crucial to compare it with other continuation patterns. Flags are similar but have a rectangular shape. Triangles and wedges are broader and can signal either continuation or reversal. Pennants, being shorter in duration, are almost exclusively continuation patterns.
Pennant pattern vs. flag, wedge, and triangle
It’s easy to confuse a pennant with other chart patterns. Here's a brief comparison to help you differentiate them:
| Feature | Pennant Pattern | Flag Pattern | Wedge Pattern | Triangle Pattern |
|---|---|---|---|---|
| Shape | Symmetrical converging trendlines | Parallel trendlines (rectangle) | Converging trendlines, both sloping up or down | Symmetrical, ascending, or descending converging trendlines |
| Duration | Short-term (1-3 weeks) | Short-term (1-3 weeks) | Medium-term (several weeks to months) | Medium-term (several weeks to months) |
| Volume | Declining during formation, spiking on breakout | Declining during formation, spiking on breakout | Declining during formation, spiking on breakout | Declining during formation, spiking on breakout |
| Breakout | Continuation of the trend | Continuation of the trend | Can be continuation or reversal | Can be continuation or reversal |
The main visual difference is the shape of the consolidation. The pennant is a small, symmetrical triangle. The flag is a channel or rectangle. Wedges and triangles are larger formations that can signal a reversal, while pennants are almost always continuation patterns.
Common mistakes traders make with pennants
Even experienced traders can fall prey to common mistakes when dealing with pennants. Being aware of these pitfalls can save you from unnecessary losses.
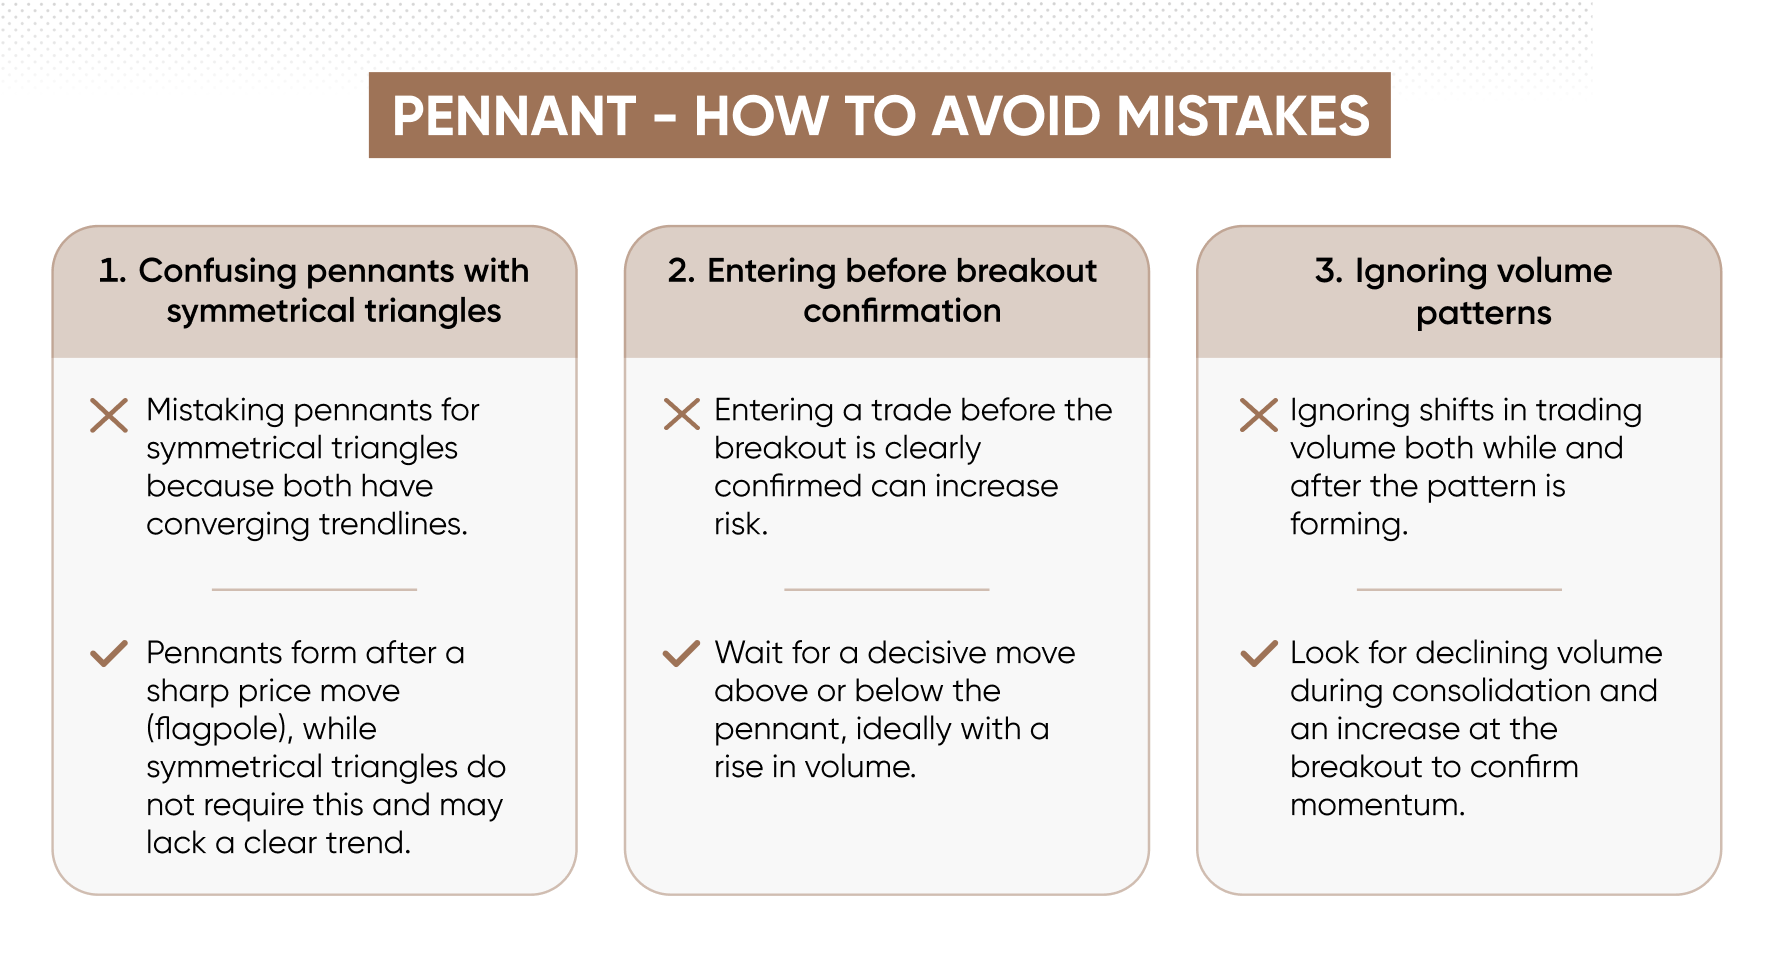
The most frequent mistake is entering too early, where you take a position before the breakout is confirmed. The price may approach the trendline, but until it decisively breaks and closes outside, the pattern is not complete.
Confusing pennants with similar patterns, such as a flag, wedge, or larger triangle, can lead to incorrect assumptions about the pattern’s duration and expected outcome. A wedge, for instance, might signal a reversal, whereas a pennant points to continuation.
Ignoring volume signals can also lead to misidentification of the pattern. A lack of volume suggests that the breakout lacks conviction and may fail. Traders who ignore this signal are often caught in false breakouts.
Not having a defined stop-loss in place is a recipe for disaster. If the trade goes against you, a small, controlled loss can turn into a significant one. Conversely, placing the stop-loss too tight can lead to being stopped out by normal market fluctuations, a phenomenon known as ‘whipsawing.’
Conclusion
The pennant pattern is a reliable continuation signal. By understanding its 3 components, the flagpole, the consolidation, and the breakout, you can confidently identify the pattern on a chart. However, the key to successful trading lies in confirming the pattern’s validity with a meaningful volume spike on the breakout and using other indicators.
It is important to note that pennant formations, like all technical patterns, can be volatile and unpredictable, and no strategy or pattern can guarantee success.
Always remember that discipline is your greatest asset. Wait for the confirmation before you enter. Place your stop-loss and take-profit targets logically. And never forget that the context of the overall market trend is crucial. Whether you are trading a bullish or a bearish pennant, it is the original strong trend that gives the pattern its power.
Make sure you practice using this pattern on a demo account. When you are confident, create an account and start trading.