Fibonacci retracement: A comprehensive guide to forex trading strategies

Fibonacci retracement is a widely used technical indicator. It helps traders identify potential areas where a market may pause or reverse. By measuring prior price moves, traders can use Fibonacci levels to highlight possible support and resistance zones, making it easier to plan entries, exits, or manage risk.
Fibonacci numbers appear throughout nature – in the spirals of a pineapple, the petals of a flower, and the arrangement of leaves on a stem. This natural sequence has also been applied as a reference tool in financial markets, though its effectiveness is debated and not universally viewed as predictive.
This guide explores how Fibonacci retracement levels are used in forex trading, outlining their purpose, application, and common interpretations.
What is Fibonacci retracement?
A retracement is a temporary price pullback that moves against the main trend. For example, if EUR/USD is rising, it may dip briefly before resuming its upward trend. This pullback is called a retracement – a short-term correction that does not alter the overall direction. Identifying these movements is useful for recognising potential entry points aligned with the main trend.
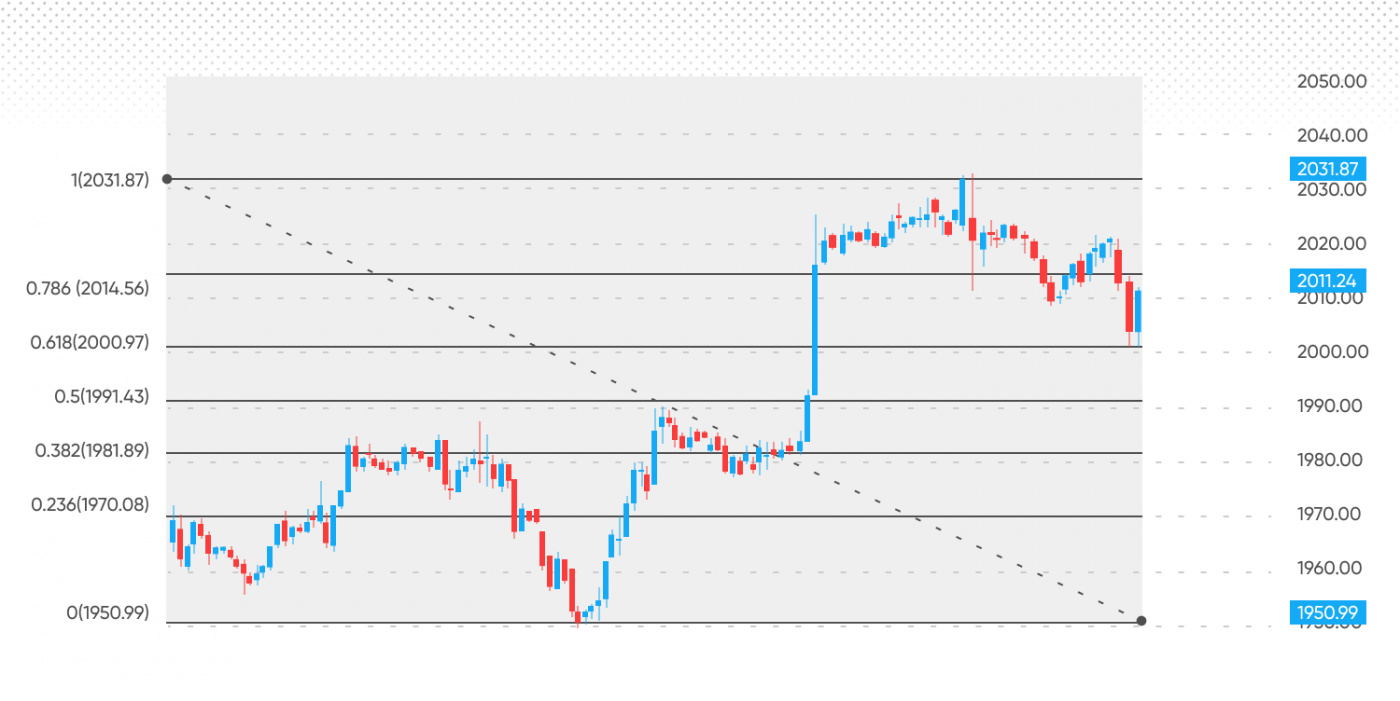
Fibonacci retracement is a technical analysis tool used to identify such pullbacks. It applies horizontal lines to a chart at specific percentages derived from the Fibonacci sequence. The most common levels are 23.6%, 38.2%, 50%, 61.8% and 78.6%.
The concept behind this method is that asset prices may encounter support or resistance near these retracement levels, where pauses or reversals can occur. However, these levels do not predict future movements, and their use is based on trader psychology and market behaviour, rather than proven causality.
Why do traders use Fibonacci retracements?
Fibonacci retracements help traders identify potential entry and exit zones and highlight areas where a price may reverse or consolidate. They can also assist with timing, showing where a market might retrace before continuing in the trend direction.
They’re also used in risk management, as traders may set stop-loss orders beyond key Fibonacci levels to help manage exposure.*
Fibonacci retracement levels are widely followed in forex trading. Because many traders monitor the same levels, they can at times become self-reinforcing reference points. However, academic research and market studies show no statistical evidence that prices naturally follow Fibonacci ratios. Their relevance depends on collective trader behaviour, not on any underlying financial law.
*Standard stop-loss orders are not guaranteed. Guaranteed stop-loss orders (GSLOs) incur a fee if activated.
The origins of the Fibonacci sequence
Leonardo Fibonacci was a 13th-century Italian mathematician known for popularising a numerical pattern that now bears his name. The sequence itself originated in earlier Indian mathematics and was introduced to Europe through Fibonacci’s text Liber Abaci.
The Fibonacci sequence is simple: each number equals the sum of the two before it – 0, 1, 1, 2, 3, 5, 8, 13, and so on. Its key feature is the golden ratio, which appears when a number in the sequence is divided by its predecessor. For example, 8 ÷ 5 = 1.6 or 13 ÷ 8 = 1.625. As the numbers grow, this ratio approaches 1.618 – the golden ratio, or Phi (ϕ).
The inverse of this ratio, 0.618, forms the basis for several commonly used Fibonacci levels. The 61.8% level is central to the method, while 38.2% (1 − 0.618) and the 50% level – though not derived from the sequence – are often included for their psychological significance.
How this applies to price behaviour in markets
Financial markets often display cyclical movements shaped by trader sentiment and behaviour. Waves of buying and selling can create patterns that appear to follow mathematical proportions such as Fibonacci ratios.
Using Fibonacci ratios in technical analysis does not imply that prices follow a natural law. Instead, traders use these levels to identify potential areas of interest because they’re widely observed. When many participants act around the same points, price reactions can occur due to collective behaviour, creating the appearance of a pattern.
This idea underpins Fibonacci retracement analysis – a method used to measure potential pullbacks within a broader trend. It provides a structured way to interpret price movements, though empirical research has not confirmed that Fibonacci ratios predict reversals. They are best used as reference levels within a broader analytical framework, not as stand-alone forecasting tools.
You can explore how the Fibonacci retracement indicator works on live charts using a demo account.
Key Fibonacci levels used in trading
The most common Fibonacci retracement levels are 23.6%, 38.2%, 50%, 61.8% and 78.6%.
- 23.6%: a shallow retracement that indicates a strong trend, with limited pullback and sustained momentum.
- 38.2%: a moderate level, often marking an initial support or resistance zone.
- 50%: not a Fibonacci number, but a widely recognised psychological midpoint, suggesting a potential half retrace before continuation.
- 61.8%: derived from the golden ratio, this level is seen as an area where a trend may resume if momentum remains intact.
- 78.6%: calculated from the square root of 0.618, representing a deep retracement that may precede a reversal or consolidation.a reversal or consolidation.
These levels are not predictive but can become self-reinforcing because they are closely monitored by technical traders and automated systems. Past performance is not a reliable indicator of future results.
How each level is interpreted
Each level can reflect a different stage of trend strength:
A shallow pullback to 23.6% may signal a robust trend. A retracement towards 38.2% or 50% is common in stable markets, while a deeper move towards 61.8% may represent a healthy correction before continuation. A fall to 78.6% can suggest slowing momentum or a possible trend reversal.
Traders generally view these levels as zones of interest rather than fixed turning points. Confirmation from price action, volume or complementary indicators is often used for additional context.
Difference between retracements and extensions
- A retracement is a temporary move against the main trend, where price briefly returns to a previous level before continuing in the same direction.
- An extension, by contrast, measures how far price may move beyond a prior swing, helping to identify potential profit targets or areas where momentum may fade.
Both are central to Fibonacci analysis, helping traders measure correction depth and project possible continuation levels. However, their reliability depends on trend strength, market context and supporting signals, rather than on the Fibonacci ratios alone.
How to draw Fibonacci retracement levels
Drawing Fibonacci levels is straightforward, but correct placement is essential for meaningful analysis. Here’s a step-by-step guide:
For an uptrend
- Find a clear swing low and a clear swing high (the lowest and highest points of the move).
- Click on the swing low.
- Drag the tool up to the swing high.
Place 0% at the swing low and 100% at the swing high; retracement levels (e.g. 38.2%, 50%, 61.8%) appear between them.
For a downtrend
Reverse the process:
- Find a clear swing high and a clear swing low.
- Click on the swing high.
- Drag the tool down to the swing low.
Here, 0% sits at the swing high and 100% at the swing low, with retracement levels in between. These levels highlight potential areas where price may pause or change direction; they are reference points, not predictive markers.
Tools and platforms to use
Most major trading platforms include an integrated Fibonacci tool, including MetaTrader MT4, MT5, and TradingView. You’ll usually find it in the drawing or analysis tools panel; placement may differ by platform. Select clear, significant swing points for accuracy.
Correct vs incorrect application of the tool
Correct selection of reference swing points is critical. Inconsistent swing points (e.g. mixing candle bodies and wicks or using minor pivots in choppy markets) can produce unreliable levels. Focus on clear, recent, significant moves within a discernible trend. Avoid applying the tool in highly volatile or ranging markets; zoom out to select appropriate swing highs and lows. Be consistent – use either wicks or bodies throughout.
How to use Fibonacci retracement in forex trading
The basic principle of using Fibonacci retracement in forex trading is to apply the levels to identify potential entry zones within a trend. During an uptrend, wait for a pullback, as the price may approach the 61.8% level before resuming its upward movement. This area can serve as a reference point for a potential entry if supporting signals are present.
This approach is widely referenced, but not every retracement to these levels leads to a reversal. Fibonacci levels should therefore be used alongside other forms of technical confirmation rather than in isolation.
Combining with trendlines, support and resistance
A Fibonacci retracement strategy is often more effective when combined with other technical tools. For example, in an uptrend, if a retracement level such as 61.8% aligns with a major trendline or key support area, this confluence can strengthen the analytical case. However, confluence increases probability, not certainty, as external market factors may still influence price movement.
Price action confirmation
Avoid entering a trade simply because the price reaches a Fibonacci level. Wait for price action signals that support the setup. Candlestick patterns such as pin bars or engulfing candles may indicate that buyers or sellers are reacting at that level. These signals can provide additional confirmation that a level may hold, but do not guarantee an outcome. Context and risk management remain essential when interpreting Fibonacci retracements.
Fibonacci extensions for profit targets
Extensions complement retracements. They are levels plotted beyond the 100% retracement mark and are used to identify potential profit targets once a trend resumes. When a trend is strong, price movement often extends past the previous high or low.
Fibonacci extensions provide a structured way to estimate how far a price move may continue before losing momentum, rather than predicting an exact turning point. This makes them a useful element of many CFD, Fibonacci, and forex trading strategies.
Key extension levels
The most commonly used Fibonacci extension levels are 127.2%, 161.8% and 261.8%. The 161.8% level, derived from the golden ratio, is widely observed as a key reference point in trending markets. The 127.2% and 261.8% levels are often used to highlight partial or extended profit zones. These levels are mathematical projections, not predictive tools, and should always be interpreted within the broader context of trend strength and market conditions.
Using extensions to set exits and targets
Once a trade is open, Fibonacci extensions can be used to identify potential exit zones. For instance, if a long position is entered near the 61.8% retracement level, a profit target could be set around the 161.8% extension. This helps create a predefined exit plan and supports risk management and trading discipline. Some traders may scale out at multiple extension levels – for example, taking partial profits near 127.2% and final profits around 161.8% – to reflect changes in market momentum.
Real trade example
Suppose EUR/USD is in an uptrend. You identify a swing low and swing high and apply the Fibonacci tool. The price retraces to the 61.8% level and forms a bullish candle. A long position is opened with a stop-loss placed below the retracement level, and the profit target set at the 161.8% extension. The price then continues higher and reaches the target, closing the position. While this example shows a typical use of Fibonacci extensions, outcomes depend on volatility and confirmation factors. The levels themselves do not guarantee that price will react or reach them.
Past performance is not a reliable indicator of future results.
Best Fibonacci trading strategies
Here are some commonly used trading strategies that incorporate Fibonacci tools.
Pullback trading in trends
This is one of the most common approaches. Wait for a trend to form, then look for a temporary pullback. Use the Fibonacci retracement indicator to identify potential reaction zones. When price shows signs of stabilising or reversing at a Fibonacci level – typically confirmed by price action – traders may consider entering in the direction of the main trend. While frequently used, these setups do not guarantee outcomes and should be supported by additional tools and market context for improved reliability.
Confluence trading with indicators
Combining Fibonacci levels with other technical indicators can provide stronger analytical context. RSI can help show whether a market is overbought or oversold. For instance, if price retraces to the 61.8% level while RSI signals oversold conditions, this may support a potential entry, though caution is still required. Moving averages can add further confirmation: when a moving average aligns with a Fibonacci level, it forms a confluence zone. These zones may increase the probability of a valid setup, but they do not ensure results.
Breakout confirmation with retracements
After a breakout from consolidation, price may pull back to retest prior resistance, which can act as new support. If a Fibonacci retracement level aligns with this area, it may reinforce the breakout’s validity and provide a reference zone for analysis. Breakout retests should always be confirmed with volume, price action, or complementary indicators to help filter out false signals.
Trend continuation setups
This approach aims to trade with the main trend. Pullbacks are a normal feature of trending markets, and Fibonacci levels can help highlight potential retracement zones for re-entry. Traders typically look for confirmation – such as momentum signals or bullish candlestick patterns – before acting near a Fibonacci level, as reversals are never certain.
Scalping vs swing with Fibonacci
Fibonacci retracement can be used across different timeframes. Scalpers may focus on five-minute charts, while swing traders analyse daily or weekly trends. The underlying principles remain consistent, offering flexibility across trading styles. However, the reliability of Fibonacci zones varies with timeframe and market volatility, so context is essential when applying them.
Past performance is not a reliable indicator of future results.
Pros and cons of using Fibonacci retracements
Fibonacci retracement is a straightforward technical analysis tool, easy to access and apply on most trading platforms. Its main strength is versatility, as it can be used across multiple markets, including forex, and equities. It offers a structured framework for identifying potential support and resistance zones, which may help in planning trade entries and exits.
However, there are limitations. Fibonacci retracements should not be used in isolation; their effectiveness increases when combined with other indicators or chart patterns. The selection of swing highs and lows is subjective, meaning two analysts may draw them differently and generate varying retracement levels.
In fast-moving or volatile markets, prices may move through Fibonacci levels with minimal reaction. Therefore, these levels are reference points, not predictive tools, and do not guarantee market direction.
Common mistakes to avoid
A common error in using a Fibonacci trading strategy is misidentifying swing highs and lows. Drawing the tool from incorrect points leads to inaccurate retracement levels. Always assess the broader trend and select clear, significant high and low points, rather than reacting to minor or noisy price movements. Accurate swing identification is essential for consistent Fibonacci analysis.
Fibonacci retracement works best in trending markets. Applying it in sideways or choppy conditions may produce unreliable levels, as there’s no clear directional trend for the retracements to reference. Confirm that a trend exists before applying Fibonacci levels; if not, other methods may provide better insight.
Traders should also avoid relying solely on retracement levels. Fibonacci ratios do not guarantee reversals, as prices can move directly through them. Confirmation from price action – for example, candlestick formations – and supporting indicators can improve reliability. However, using too many overlapping indicators can reduce clarity.
Overloading charts with multiple indicators often leads to conflicting signals. It’s usually more effective to focus on a few reliable confirmation tools that align with your core analysis, rather than combining numerous weaker signals.
Risk management with Fibonacci tools
Fibonacci levels can assist with risk management by highlighting potential areas for stop-loss placement. For example, in a long position, a stop-loss might be set just below a key retracement level to limit downside if price moves against the trade. However, placement should account for market volatility, not rely solely on Fibonacci levels, as price may temporarily move through these zones before reversing. This method promotes disciplined exits and forms part of many forex and CFD trading frameworks.*
*Standard stop-loss orders are not guaranteed. Guaranteed stop-loss orders incur a fee if activated.
Fibonacci tools are for reference, not prediction. They do not remove market uncertainty. Effective risk management should always include appropriate position sizing and a reminder to avoid risking more than you can afford to lose.
Advanced applications of Fibonacci
Once you’ve practised using the Fibonacci retracement indicator on a demo account, you may wish to explore these advanced techniques.
Fibonacci clusters and confluence zones
A Fibonacci cluster occurs when two or more retracement or extension levels from different swings or timeframes align near the same price. These clusters can highlight potential areas of support or resistance, as overlapping levels may attract trader attention, leading to self-reinforcing reactions rather than predictive accuracy. For example, if a 61.8% retracement from a major move coincides with a 38.2% retracement from a smaller move, the overlapping region may be considered significant. The strength of a cluster depends on the number and proximity of overlapping levels. This method is advanced and requires careful chart analysis.
Fibonacci fans, arcs, and time zones
Other Fibonacci-based tools include fans (angled lines), arcs (curved lines), and time zones (vertical divisions) based on Fibonacci ratios. These tools are designed to identify potential areas of support, resistance, or time-based reversals, rather than precise price points. They are more complex and less commonly used than retracements or extensions and generally require extensive practice and contextual confirmation, as their signals depend on chart interpretation and are not stand-alone indicators.
Multi-timeframe analysis
Multi-timeframe analysis involves overlaying Fibonacci levels from different periods, such as daily and four-hour charts, to identify where key retracement levels coincide. This approach can help filter false signals and may improve contextual accuracy, particularly when clusters or confluence zones appear at overlapping levels. For instance, a support zone visible on both the daily and four-hour chart may be viewed as more technically relevant than one appearing on a single timeframe.
Algorithmic application of Fibonacci
Algorithmic trading systems often incorporate Fibonacci levels as part of broader strategies. Trading algorithms can be programmed to respond to price movements near retracement or extension levels, executing trades automatically. These systems typically use Fibonacci levels within a wider analytical framework, combining technical signals and risk parameters. Their precision arises from data processing speed, not from any inherent predictive quality of Fibonacci ratios.
Explore how Fibonacci retracement works in practice with a demo account before trading live.
FAQ
What is the Fibonacci retracement indicator used for?
The Fibonacci retracement indicator helps identify potential areas of support or resistance during a market pullback. Traders use it to measure how far a price may retrace within a trend, defining reference zones for analysis rather than predicting future performance.
Do Fibonacci retracement levels predict price movements?
No. Fibonacci levels are analytical reference points, not predictive tools. They highlight areas where price reactions may occur due to trader behaviour, but they don’t guarantee reversals or continuations. Their effectiveness depends on market context and supporting confirmation.
What are the most common Fibonacci retracement levels?
The most used levels are 23.6%, 38.2%, 50%, 61.8%, and 78.6%. Each represents a different degree of retracement within a price move and is used to structure analysis, not to forecast outcomes.
How reliable are Fibonacci retracements in forex trading?
Fibonacci retracements can be useful for visual analysis, particularly in trending markets. Reliability improves when combined with other technical tools such as trendlines, support and resistance, or price action confirmation. Used alone, they should be treated as contextual guides rather than trading signals.