Trend trading strategy: how to use it
Delve into trend trading, its diverse strategies, and the tools needed to navigate various markets. Learn the art of following market trends.
What is trend trading?
Trend trading or trend following is a trading strategy that involves identifying the direction of a prevailing trend in the financial markets and then buying or selling assets in accordance with that trend.
Trend traders tend to use technical analysis tools, such as moving averages (MA), trend lines, and momentum indicators, to determine trends in the market. They will look for patterns in price movements and analyse charts to establish areas of support and resistance.
Once a trend has been recognised, trend traders tend to enter a trade in the direction of that trend and the goal is to ride the trend for as long as possible. As a trend trader, you may enter into a long position when the price is trending upward or a short position when the price is trending downward.
Key takeaways of trend trading
-
Trend trading is a strategy that identifies market trends and trades assets accordingly.
-
It relies on technical analysis tools, such as moving averages, trend lines, and momentum indicators.
-
Trend types include secular, primary, secondary, intermediate, and minor trends.
-
Trend-following strategies can involve moving averages, trend lines, and momentum indicators
-
Trend trading is versatile, suitable for various markets and timeframes, as its goal is to capitalise on market momentum.
-
Risks include false signals, lagging indicators, and trend reversals.
-
Backtesting and demo trading can help refine strategies before trading real money.
Trend trading explained
The Turtle trading experiment in the 1980s is often credited with popularising the trend-trading system. The experiment was conducted by the legendary commodities trader Richard Dennis, who believed that trading skills could be taught and that anyone could learn to become a successful trader.
Dennis selected a group of inexperienced traders, known as the “Turtles,” and taught them his trend-following system, which involved using technical analysis to identify and trade trends in the markets. The Turtles were taught to use a variety of indicators and risk-management techniques and it was a success.
It’s difficult to estimate exactly how much the Turtle traders made, but some sources state it was over $100 million. Several of the Turtle Traders went on to become successful traders in their own right, including Jerry Parker, who founded Chesapeake Capital and reportedly generated over $1 billion in profits for his clients, and Paul Rabar, who founded Rabar Market Research and reportedly achieved annual returns of over 20% for over two decades.
Note, however, that all trading, including trend following, contains high risk of a loss. Markets move up and down, trends reverse, and past performance is not a guarantee of future results.
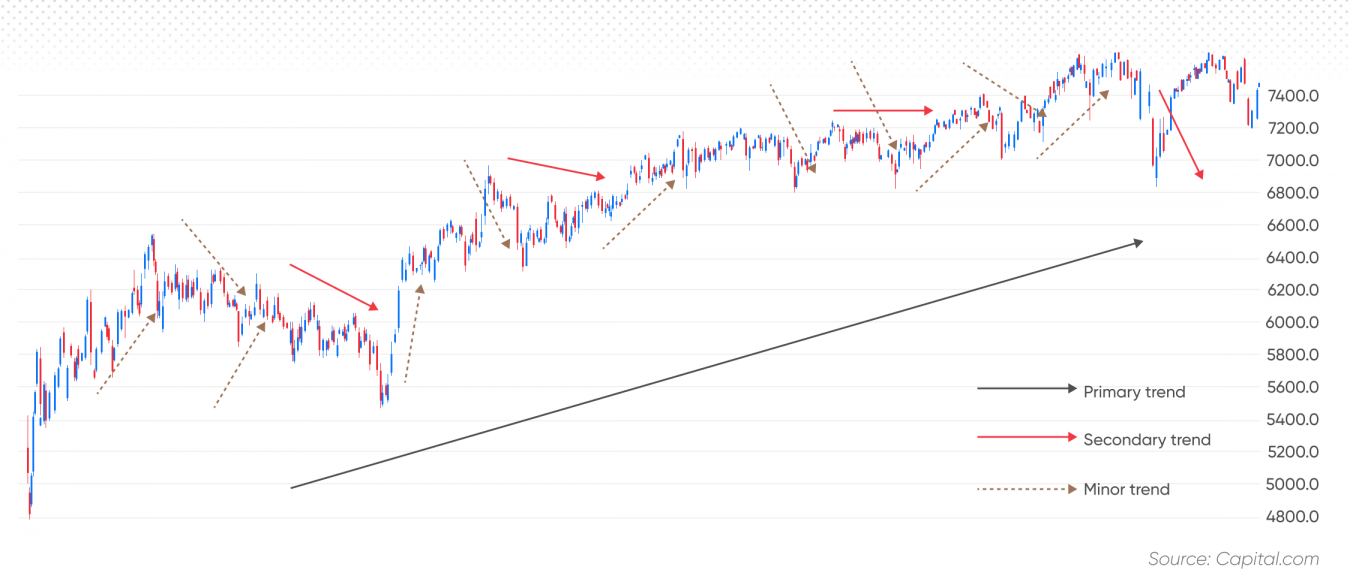
Different types of trends in trend trading
There are several types of trends trend followers may want to be aware of.
- Secular trends: Secular trends are long-term trends that last for years or even decades. They are usually caused by structural changes in the economy or changes in demographic trends.
- Primary trends: Primary trends are shorter-term trends that last for months or a few years. They are usually caused by changes in the business cycle or by political or economic events.
- Secondary trends: Secondary trends are shorter-term trends that last for weeks or a few months. They are usually caused by changes in investor sentiment or by technical factors.
- Intermediate trends: Intermediate trends are shorter-term trends that last for days or a few weeks. They are usually caused by changes in the supply and demand for a particular asset or by changes in the level of volatility in the market.
- Minor trends: Minor trends are very short-term trends that last for only a few days, and are the bread and butter of day traders and swing traders. They are usually caused by news events or changes in the level of trading activity in the market.
*Past performance is not a reliable indicator of future results
How to use a trend-trading strategy
Traders may choose to use a combination of trend-trading strategies, depending on their style and risk tolerance.
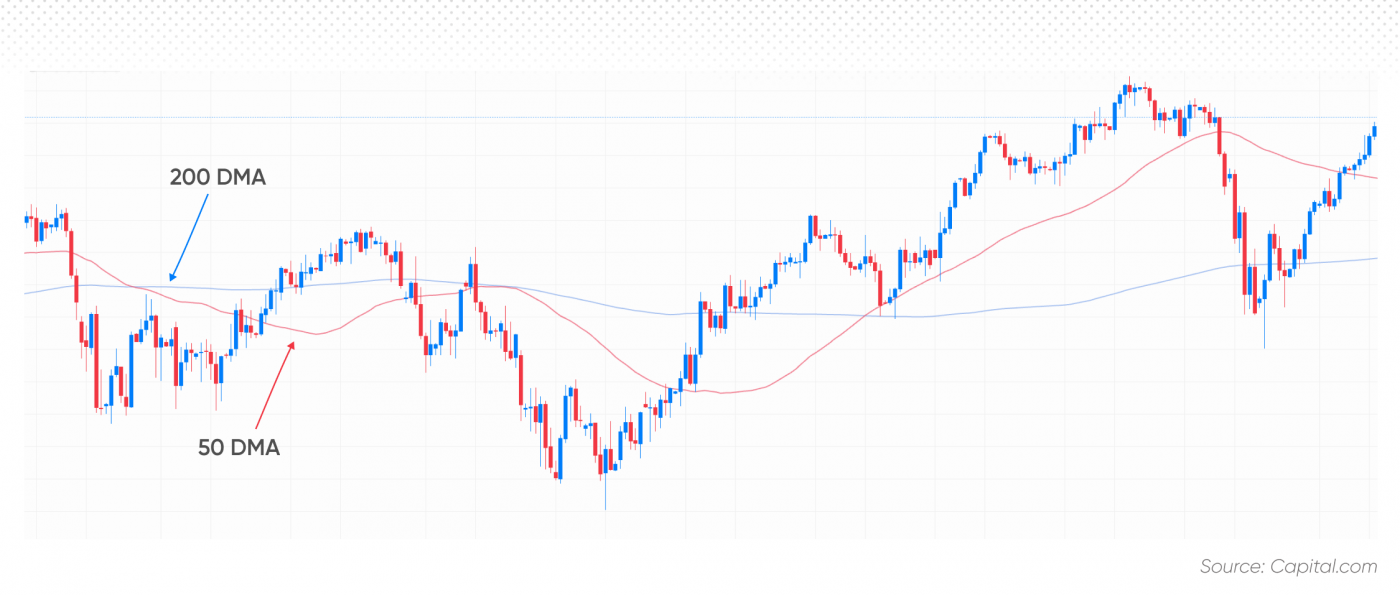
Moving averages
This strategy involves using the moving average (MA) indicator, which measures the average price of an asset over a specified time period.
A trader may look for a “golden cross” signal, this occurs when a short-term moving average (e.g. 50-day) crosses above a long-term moving average (e.g 200 day). This signal may be seen as a bullish indication that the trend is shifting upwards.
 *Past performance is not a reliable indicator of future results
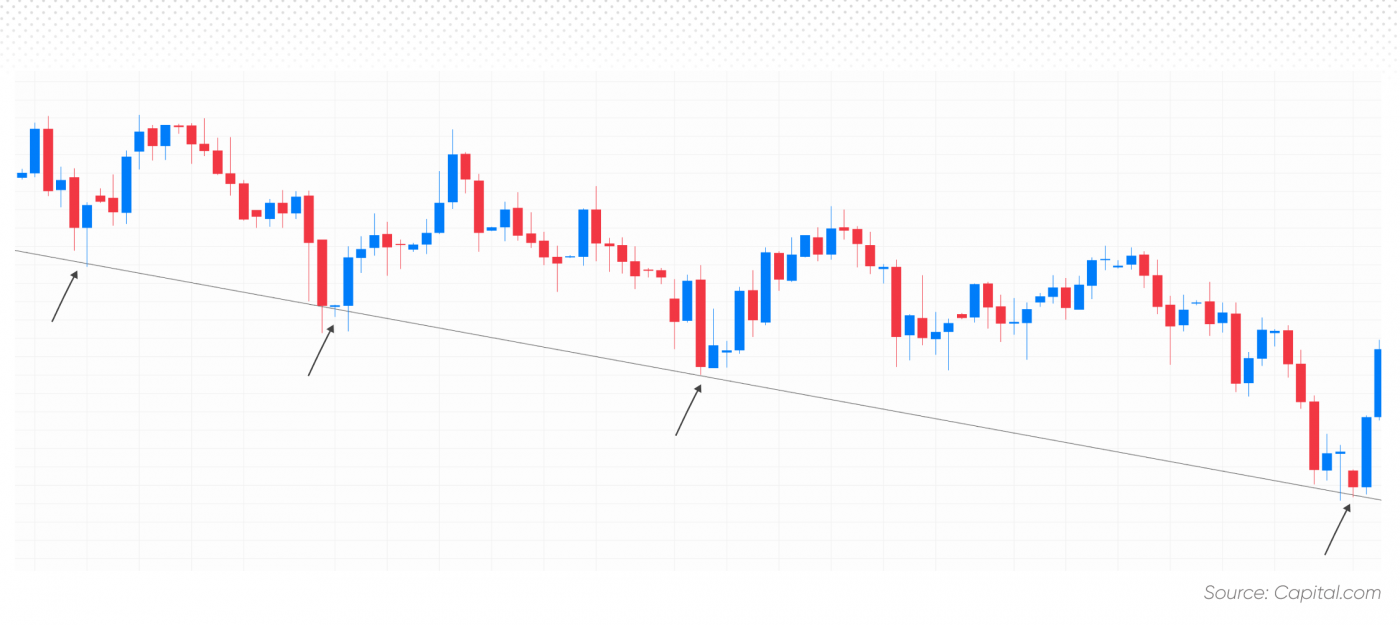
Trend lines
Trend lines connect the highs and lows of an asset’s price movements. They are straight lines that connect two or more price points on a chart, representing the direction and slope of a trend.
Trend lines can be used to pinpoint the direction of a trend. They can also be used in conjunction with other technical indicators and candlestick patterns to spot potential trading scenarios. For example, a trader may look for a bullish chart pattern, such as a double bottom, to form near an uptrend line, which may indicate a bullish momentum.
 *Past performance is not a reliable indicator of future results
Trend momentum
Momentum indicators are used to measure the strength of a trend and can help traders identify potential entry and exit points.
The indicators used are:
- Relative Strength Index (RSI): This measures the speed and change of price movements. It oscillates between 0 and 100 and is typically used to identify overbought and oversold conditions. A reading above 70 indicates an overbought condition, while a reading below 30 indicates an oversold condition.
- Moving Average Convergence Divergence (MACD): The MACD is a trend-following momentum indicator that consists of two lines: the MACD line and the signal line. When the MACD line crosses above the signal line, it indicates a bullish trend, while a cross below the signal line indicates a bearish trend.
- Stochastic Oscillator: The stochastic oscillator indicator compares an asset’s closing price to its trading range over a specified period. It oscillates between 0 and 100 and is typically used similarly to RSI - to identify overbought and oversold conditions.
Trend-trading example
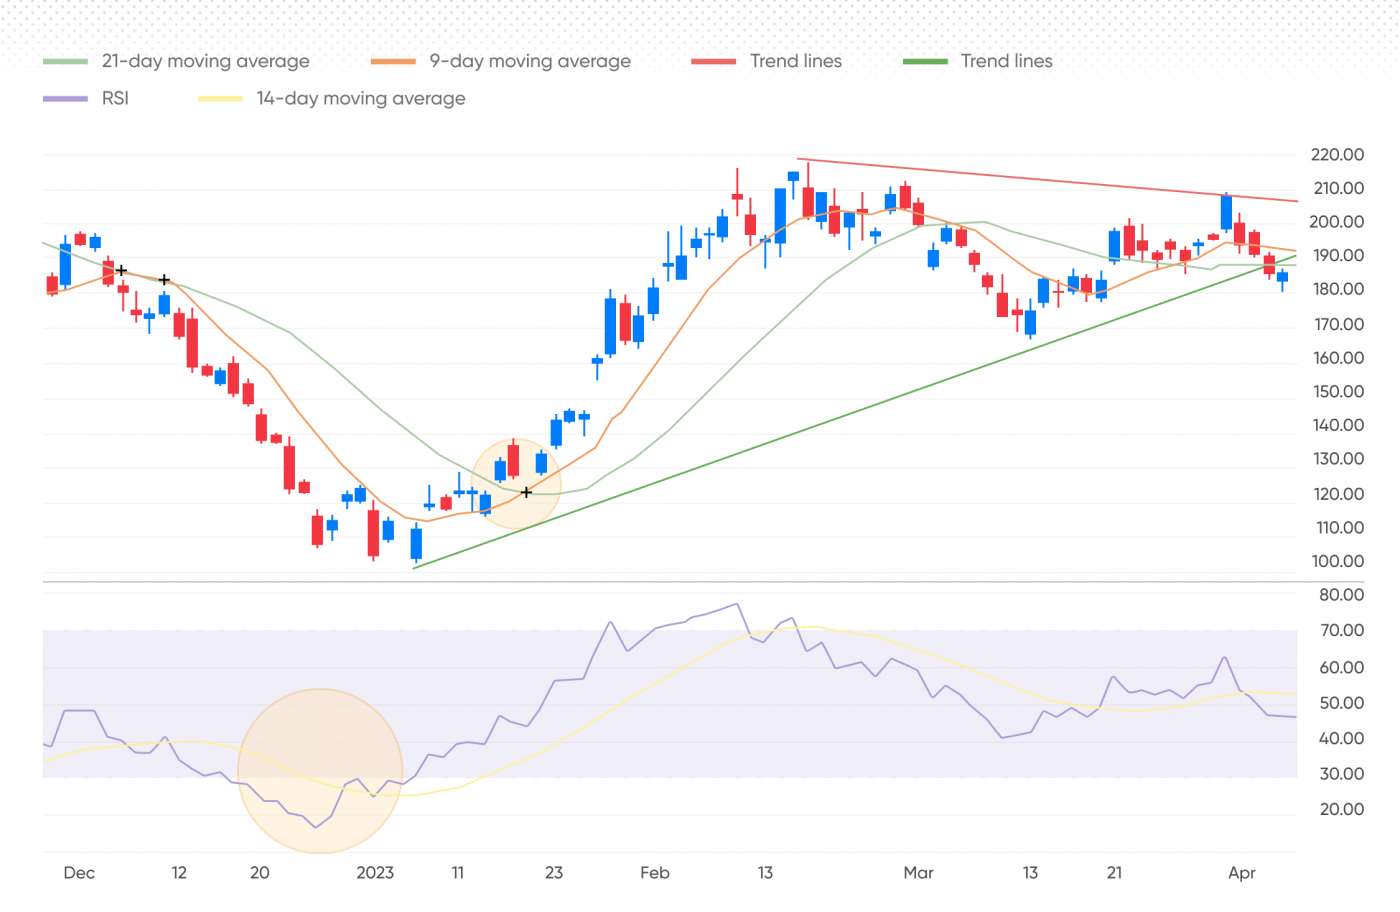 *Past performance is not a reliable indicator of future results
The chart above highlights activity over a few weeks and shows the 9-day moving average and 21-day moving average, trendlines and the RSI indicator below.
When the RSI falls below 30, indicating that the asset is oversold and a trend reversal is likely, it’s followed by a cross of 9 and 21-day moving averages, which too signals a potential bullish trend reversal. A trend-trader may have decided to buy the asset since there are two indicators confirming the reversal, and followed the trend until RSI shoots above 70, suggesting the asset is overbought.
Why choose trend trading?
- Suitable for various markets: Trend trading can be applied to various financial markets, including stocks, forex, commodities, and indices, making it a versatile strategy.
- Capitalise on market momentum: The basic idea behind trend trading is to identify the direction of the market, and then take positions that are aligned with the direction of the trend.
- Adaptable for various time frames: Trend trading can be used for various timeframes, which means it may be suitable for many strategies, from day trading to swing trading.
Risks of trend trading
- False signals: One of the downsides of trend trading is that it can generate false signals, leading to losses. Trends can be short-lived, and price movements can be volatile, making it challenging to identify the direction of the trend accurately.
- Lagging indicators: Trend trading often uses lagging indicators such as moving averages, which may not provide an accurate picture of the current market situation. By the time a trend is identified, it may have already been in place for some time, and the price may have already moved significantly.
- Risk of trend reversals: Trends can reverse at any time, and traders who have taken long or short positions based on the trend may suffer significant losses if the trend reverses.
How to start trend trading
The key steps involved in trend trading include:
Identifying trends: The first step in trend trading is to find out the direction of the trend. This can be done by analysing price charts and looking for higher highs and higher lows in an uptrend or lower lows and lower highs in a downtrend. Technical indicators such as moving averages and trend lines can also be used to highlight trends.
Selecting entry and exit points: Once a trend has been identified, the next step is to select entry and exit points. Entry points can be determined using technical indicators such as momentum oscillators and chart patterns.
Managing risk: Risk management is an important aspect of trend trading. Traders can use appropriate position sizing and risk-management techniques. Stop-loss orders can be used to limit potential losses. It should be noted that ordinary stop-losses do not protect from slippage, while guaranteed stop-losses do, however there is a fee associated with them.
Backtesting and demo trading
Backtesting involves testing a trading strategy on historical data to see how it would have performed in the past. This allows traders to evaluate the effectiveness of the strategy and make any necessary adjustments before risking real money in the markets.
Backtesting helps traders to identify the strengths and weaknesses of their strategy, as well as to refine their entry and exit points, risk management, and position sizing.
Demo trading, on the other hand, involves using a simulated trading account to practise executing trades based on a trading strategy. This allows traders to gain real-world experience without risking real money. Demo trading helps traders to develop confidence in their strategy, to practise managing risk, and to become familiar with the trading platform of their chosen broker they plan to use.
Conclusion
In summary, trend trading is a widely employed and adaptable trading strategy, which focuses on capitalising on market momentum through the identification and pursuit of prevailing trends.
Using technical analysis tools, such as moving averages, trend lines, and momentum indicators, traders can ascertain trends and evaluate their potential potency. By recognising the distinct types of trends – secular, primary, secondary, intermediate, and minor – traders can adapt their strategies for varying market conditions and timeframes.
Trend-following strategies may use moving averages, trend lines, and momentum indicators, including to establish entry and exit points while assessing a trend's strength. The versatility of trend trading allows its application across diverse financial markets, including stocks, forex, commodities, and indices.
FAQs
What is trend trading in simple terms?
Trend trading is a strategy that involves identifying the direction of a prevailing trend in the financial markets and then buying or selling assets in accordance with that trend.
What are the types of trends?
There are three types of common trends, the first is a secular trend, which are long-term and last for years or decades. The second is a primary trend, this is short-term and can last for a few months. The third is a secondary trend, again it is short-term and can last a few weeks. The fourth and fifth are intermediate trends and minor trends, both are short term and last a few days.
Is trend trading profitable?
Like other trading strategies, trend trading can be profitable but it can also lead to losses as markets can be volatile. Traders should have a trading strategy in place, understand the markets and deploy a risk-management programme.
What is an example of trend trading?
An example of trend trading is when a trader identifies a long-term trend in a particular asset, such as a stock, currency pair, or commodity, and then seeks to profit from the trend by taking positions that align with the direction of the trend. For instance, if a trader identifies an uptrend in a stock, they may buy the stock and hold onto it as long as the trend continues. If the trend begins to reverse, they may sell the stock to realise profits or cut losses.
How do you identify a trend in trading?
There are several ways to spot a trend in trading. The first is visual, a trader can look at a price chart of an asset and visually inspect to see patterns that indicate a trend. The second is moving averages, these show you trends over a specified time period. The next are trendlines, which connect the high and low points of the asset price of a specific period and then there are technical indicators, such as RSI and MACD, that may help you find trends.