Descending channel pattern: a comprehensive guide for traders

Remember, as with all technical analysis, while these patterns may give clues on potential future price action, past performance is not a reliable indicator of future results.
Here’s what you need to know to identify and use this pattern effectively in your trading strategy.
What is a descending channel?
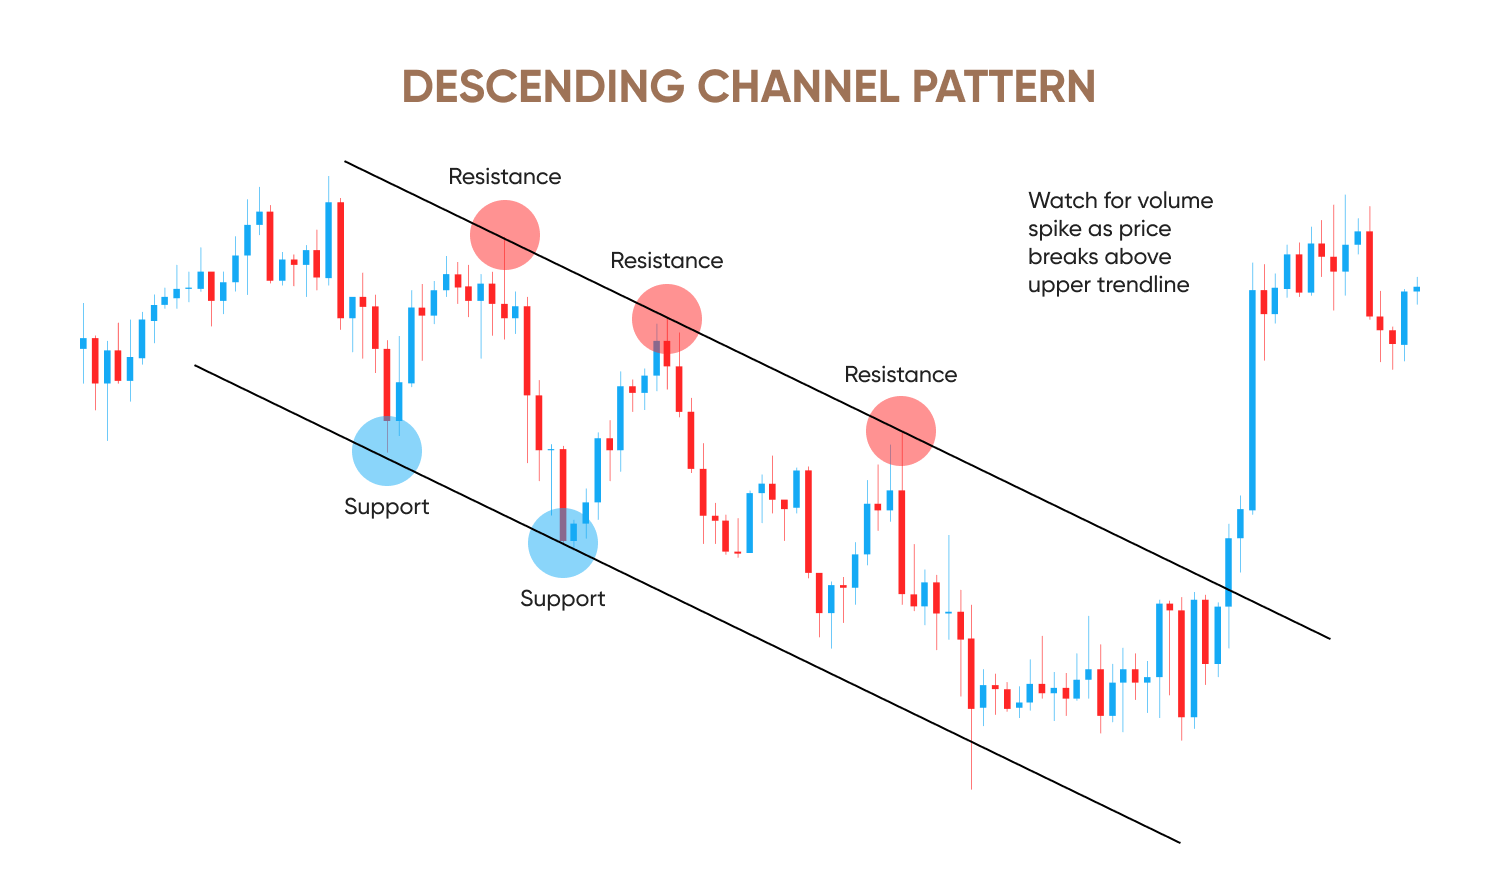
A descending channel pattern, also known as a falling channel pattern, is a popular chart pattern used in technical analysis. It shows a clear downtrend in an asset’s price. The pattern is formed by 2 parallel, downward-sloping trendlines. The upper line acts as dynamic resistance, connecting a series of lower highs. The lower line acts as dynamic support, connecting a series of lower lows. The price of the asset moves between these 2 lines. This pattern can signal either a continuation of a downtrend or a reversal to an uptrend, depending on how the price breaks out of the channel.
Key characteristics of the pattern
The descending channel pattern can be recognised by a series of lower highs and lower lows. The upper trendline connects the peaks (the lower highs), and acts as a dynamic resistance level. The lower trendline connects the troughs (the lower lows), and acts as a dynamic support level. These 2 trendlines are drawn to be parallel to each other. The more times the price touches and bounces off these trendlines, the more reliable the pattern is considered.
Price movement between two downward-sloping trendlines
An asset’s price tends to oscillate within the boundaries of the descending channel. It moves down, hits the lower support trendline, bounces up toward the upper resistance trendline, and then falls again. This ‘zigzag’ movement of the price inside the channel shows that sellers are in control, but buyers are still stepping in at lower and lower prices. The pattern indicates that the bearish momentum is steady but not accelerating.
How does a descending channel differ from other chart patterns?
An ascending channel is the opposite of a descending channel. It is a bullish pattern formed by 2 parallel trendlines that slope upwards. The price makes higher highs and higher lows, indicating an uptrend.
A horizontal channel usually forms during sideways markets. This pattern is also known as a trading range or rectangle. It has 2 parallel trendlines that are horizontal. The price moves sideways, indicating a period of consolidation, where buying and selling pressure are relatively balanced.
Open a demo account to see how the descending channel pattern forms on real price charts without risking real money.
How to identify a descending channel
To identify a descending channel pattern, you first need to draw the upper and lower trendlines connecting the lower highs and lower lows.
The upper trendline, or resistance line, connects at least 2 or more lower highs. It shows that sellers are consistently pushing the price down. The lower trendline, or support line, connects at least 2 or more lower lows, indicating where buyers are stepping in to prevent a further price drop. For the pattern to be valid, these 2 trendlines must be roughly parallel. The more times the price touches these lines without breaking them, the stronger the pattern.
Price behaviour within the channel
The price action within a descending channel is characterised by a series of lower highs and lower lows. The price moves in a clear ‘zigzag’ fashion, bouncing between the upper and lower trendlines. Each rally up to the resistance line is weaker than the last, and each decline to the support line pushes the price to a new low. This behaviour confirms a steady, although controlled, downtrend. Traders can use this pattern to look for opportunities to sell near the upper trendline and take profits near the lower trendline.
Volume behaviour
Volume is a crucial factor in confirming a descending channel pattern. Typically, the volume will decrease as the price oscillates within the channel, showing that the downtrend is losing momentum. The most important volume signal, however, occurs at the descending channel breakout. A significant spike in volume when the price breaks decisively above the upper trendline provides strong confirmation that a new upward trend is beginning. A breakout without a corresponding increase in volume is often a false breakout, which can quickly reverse and lead to losses.
Past performance is not a reliable indicator of future results.
Key components of the pattern
To use the descending channel in forex or stock trading, you first need to know its basic components.
Channel slope and duration
The channel is defined by its downward slope. A steep slope shows a strong, rapid downtrend. A shallow slope indicates a slower, more controlled decline. The duration of the pattern can vary from hours to months. The longer the channel, the more meaningful the eventual descending channel breakout or breakdown.
Number of touchpoints needed
To be considered valid, a descending channel needs at least 2 distinct touchpoints on both the upper and lower trendlines. The more times the price touches and respects these lines, the more reliable the pattern becomes. A pattern with 3 or more touches on each side is considered very strong.
Breakout zones
The descending channel breakout is the most important event. A breakout occurs when the price breaks decisively above the upper resistance line or below the lower support line. A break above the top line is a bullish signal and a signal for a potential trend reversal. A break below the bottom line is a bearish signal and a signal of continuation of the downtrend.
Correct vs. incorrect channel structure
A correct channel structure has 2 clearly parallel trendlines. These lines must contain the price movement without any big breaks. If the lines are not parallel, the pattern is likely a different formation, such as a descending wedge. A wedge has converging trendlines and often signals a reversal, whereas a channel can signal either continuation or reversal. It is important to familiarise yourself with the various chart patterns to strengthen your technical analysis skills.
How to trade the descending channel pattern
There are 2 primary strategies for trading a descending channel: trading within the trend and trading the breakout.
However, traders should be aware that descending channel patterns can produce false signals, and these strategies do not guarantee profits. Past performance does not guarantee future results.
1. Trend-following strategy
This strategy involves shorting the asset at the upper trendline and buying at the lower trendline.
Entry: enter a short position when the price touches the upper trendline. Enter a long position when the price touches the lower trendline.
Stop-loss: place a stop-loss just outside the opposite trendline to protect against a breakout.
2. Breakout strategy
This is the most common strategy. However, remember to wait for the breakout to be confirmed before opening a position.
Entry: wait for breakout confirmation. This occurs when the price closes a candle decisively above the upper trendline (bullish) or below the lower trendline (bearish).
Stop-loss: place a stop-loss just inside the channel, near the breakout point. This limits losses if the breakout is false.
Profit target: measure the vertical height of the channel at the widest point. Project this distance from the breakout point to get a price target.
Here’s a checklist to help you confirm a breakout
- Step 1Identify a clear descending channel pattern.
- Step 2Ensure there are at least 2 touches on both trendlines.
- Step 3Wait for a breakout candle.
- Step 4Confirm the breakout with increased volume.
- Step 5Wait for the candle to close outside the channel.
- Step 6Place your entry order.
- Step 7Set your stop-loss and profit target.
Real-world example of a descending channel
Brent crude prices remained in a descending channel in the first 5 months of 2025. Prices dropped from close to $80 per barrel in January to around $64 per barrel by May. The move was driven by excess supply concerns, with OPEC+ announcing plans to increase output, as well as fears of lower demand, due to expectations of a global economic slowdown triggered by geopolitical unrest and US tariffs.
Past performance isn’t a reliable indicator of future results.
Best indicators to use with the descending channel
You can increase confidence in your descending channel pattern strategy by using other technical indicators to confirm signals and manage risk.
Moving averages
Moving averages, like the simple moving average (SMA) or exponential moving average (EMA), provide a clear picture of the trend. During a bearish trend, the price generally stays below a long-term moving average (such as the 50-day SMA). A potential descending channel breakout to the upside is stronger if the price breaks above the moving average as well as the channel’s upper trendline. This ‘confluence’ of signals increases the probability of a successful trade.
Relative strength index (RSI)
RSI is a momentum indicator that measures the speed and change of price movements. In a descending channel, the RSI often moves between the 30 (oversold) and 70 (overbought) levels. A trade can be confirmed when the price touches the channel’s lower trendline and the RSI falls into the oversold zone (below 30). This signals a potential bounce within the channel. A bullish divergence occurs, where the price makes a new lower low, but the RSI makes a higher low. This is a strong sign of weakening bearish momentum and can precede a breakout.
Moving average convergence divergence (MACD)
MACD is a powerful trend-following and momentum indicator. When the price is moving within a descending channel, the MACD line is usually below the zero line, confirming the downtrend. A bullish descending channel breakout is often signalled by a bullish MACD crossover (the MACD line crosses above the signal line) or a MACD line crossing above the zero line. Both indicate a shift in momentum to the upside.
Bollinger bands
Bollinger bands consist of a moving average with 2 standard deviation bands, one above and one below the moving average line. The bands expand during high volatility and contract during low volatility. A ‘Bollinger squeeze’ is when the bands contract, showing decreasing volatility. This can signal a significant price move, such as a descending channel breakout. When the price reaches the lower band, it can be considered oversold. This could signal a potential bounce off the channel’s lower trendline.
Volume analysis
Volume is one of the most important indicators to use. Declining volume during the formation of the descending channel pattern suggests that the downtrend is losing steam. However, a big spike in volume at the moment of a breakout (especially to the upside) provides strong confirmation that the move is genuine. Without a volume spike, a breakout is more likely to be a false breakout or a ‘head fake.’
Pros and cons of trading the descending channel
The biggest advantage of the descending channel is its clear structure and logic. The pattern is easy to identify, and its trading logic is straightforward. Traders can apply both a trend-following strategy or a breakout strategy while using this pattern. The pattern is a good choice for trend-following and breakout setups. It also works well for different trading styles.
However, there is the risk of false breakouts. The price can break out of the channel only to quickly reverse, leading to losses. This is why good risk management is crucial. Without proper stop losses and position sizing, false breakouts can be very costly. Another drawback is that the descending channel pattern can be confused with a falling wedge pattern. The converging lines of a falling wedge can be mistaken for the parallel lines of a channel.
Risk management when trading channels
Risk management is essential for any trading strategy, especially with channels. To limit losses, place the stop-loss order just outside the channel. For a bullish breakout, place it below the upper trendline. For a bearish breakout, place it above the lower trendline.
Position sizing is also important. Disciplined traders don’t risk more than 1%-2% of their total trading capital on a single trade. Also, always aim for a risk-reward ratio of at least 1:2. This means your potential profit is at least double your potential loss.
In addition, learn how to handle false breakouts. If a trade hits your stop-loss, accept the small loss and look for a new setup. Don’t chase the trade or try to re-enter without a new confirmed signal.
Finally, strengthen your trading psychology to prevent emotions from influencing your decisions.
Descending channel vs. other patterns
As mentioned earlier, it is vital to differentiate a descending channel from similar patterns. The main difference between a descending wedge and descending channel is that in the latter, the trendlines are parallel. In a descending wedge, the trendlines converge. A wedge typically signals a potential bullish reversal, while a channel can be either a continuation or reversal pattern. The descending channel pattern must also be distinguished from a horizontal channel. Horizontal channels show a sideways market with no clear trend.
When to use the descending channel pattern
The descending channel pattern is a versatile tool that can be used across different timeframes, volatility conditions, and market types. Its effectiveness depends on how well you adapt your strategy to the specific context.
Best timeframes
The pattern can be found on any timeframe, from intraday charts (1-minute, 5-minute) to long-term charts (daily, weekly, monthly). Longer timeframes (daily, weekly) tend to produce more reliable patterns with fewer false breakouts. This is because a longer timeframe filters out a lot of the short-term market noise. A pattern that lasts for weeks or months is generally a stronger signal. Shorter timeframes (intraday) can also be used but are more prone to false signals. They require tighter risk management and a more vigilant approach to confirmation.
Volatility conditions
The descending channel is most effective in markets with low to moderate volatility. When volatility is low, the price movement is more controlled and respects the channel’s boundaries. This makes it easier to trade within the channel, as bounces off the support and resistance lines are more predictable. During periods of high volatility, the price can move erratically, leading to frequent false breakouts. The channel might not hold, and the pattern could be invalidated quickly. It is crucial to use additional confirmation indicators and a strict stop-loss in these conditions.
Market types
The descending channel pattern is a universal chart pattern. It can be applied to any market where price charts are used.
Forex: the descending channel forex strategy is popular because currency pairs often trend for extended periods. The liquidity of the forex market can make channel patterns clear and reliable.
Stocks: the pattern is very common in stock trading. The long-term nature of stock trends means that daily and weekly descending channels can provide excellent trend-following and reversal opportunities.
Tips for success with the descending channel strategy
Here are some tips to help you make the most of the descending channel chart pattern:
- Always confirm breakout with volume: a breakout without a significant increase in volume is a red flag and should be viewed with suspicion.
- Confirm with other indicators: A trade becomes much higher probability when the descending channel breakout is confirmed by other indicators like the RSI or MACD.
- Avoid trading near news releases: high-impact news can cause unpredictable price swings and lead to false breakouts.
- Keep expectations realistic: No trading strategy is 100% accurate. Losses are part of the game. Focus on a good risk-reward ratio and disciplined execution.
Ready to apply the descending channel pattern to your trading strategy? Open a live account.