Johnson & Johnson stock forecast: Third-party price targets
Johnson & Johnson (JNJ) is trading at $190.38 as of 2:34pm UTC on 13 October 2025, moving within an intraday range of $188.05 to $191.79.
The stock has risen approximately 31% year to date, reaching new all-time highs amid a broader healthcare sector rally (Reuters, 1 October 2025).
The healthcare giant’s recent momentum reflects renewed investor confidence following relief across the pharmaceutical sector over a potential tariff reprieve, after Trump administration agreements with companies such as Pfizer (Reuters, 13 October 2025). This comes ahead of the company’s third-quarter earnings on 14 October, with analysts projecting earnings growth and solid performance across its MedTech and oncology divisions, despite ongoing biosimilar competition affecting its blockbuster drug Stelara (Yahoo Finance, 26 September 2025).
Johnson & Johnson stock forecast: Analyst price target view
Morgan Stanley (Equal-Weight)
Morgan Stanley maintains its Equal-Weight rating, setting a one-year price target of $178, implying limited upside from current levels. The firm notes steady cash flows in MedTech and consistent drug launch momentum amid patent expiries (GuruFocus, 10 October 2025).
Bernstein (Market Perform)
Bernstein raises its price target to $193 for the next twelve months, citing resilient immunology sales and greater pipeline visibility following recent FDA approvals (GuruFocus, 6 October 2025).
B of A Securities (Neutral)
BofA Securities retains a Neutral rating and lifts its one-year target to $198, referencing stronger-than-expected second-quarter revenue and manageable litigation provisions (MarketBeat, 3 October 2025).
Guggenheim (Buy)
Guggenheim reiterates its Buy rating with a $206 target. The firm highlights Johnson & Johnson’s product lifecycle position following the loss of Stelara exclusivity, expecting pipeline catalysts and a solid balance sheet to support valuation stability (Investing.com UK, 8 October 2025).
Goldman Sachs (Conviction Buy)
Goldman Sachs maintains its Conviction Buy rating and increases its twelve-month target to $212, citing sustained performance across pharmaceutical operations and potential Medicare pricing benefits (MarketBeat, 9 October 2025).
Predictions and third-party forecasts are often inaccurate, as they can’t account for unforeseen market events. Past performance should not be relied upon as a reliable indicator of future results.
JNJ stock price: Technical overview
On the daily chart, Johnson & Johnson (JNJ) at $190.38 as of 2:34pm UTC on 13 October 2025 remains above its key simple moving average (SMA) cluster – the 20-, 50-, 100-, and 200-day SMAs near $182, $178, $168, and $161 respectively – with the 20-over-50 alignment still intact. Momentum indicators show extended conditions, as the RSI(14) stands at 75.9, while the ADX(14) at 29.8 indicates an established trend.
The first resistance level is around $194 (R2); a daily close above this level could bring $200 into focus. On pullbacks, initial support sits near the $182 pivot, with a deeper support area around the 100-day SMA near $168. A sustained move below this area may open the way toward last week’s lows (TradingView, 13 October 2025).
This technical analysis is provided for informational purposes only and does not constitute financial advice or a recommendation to buy or sell any instrument.
Johnson & Johnson share price history
Johnson & Johnson (JNJ) closed at $186.26 on 7 October 2025. Two years earlier, JNJ was trading near $157.60 in mid-October 2023, then moved into the $162–$168 range by late 2023 before ending 2024 at $144.35, amid broader market volatility.
During the first half of 2025, the stock recovered to the $155–$160 area, gaining steady momentum through August with closes near $178–$180. It has risen approximately 28.9% year to date and 17.2% year on year as of 7 October 2025.
Past performance is not a reliable indicator of future results. Share prices are indicative and may differ from live market prices.
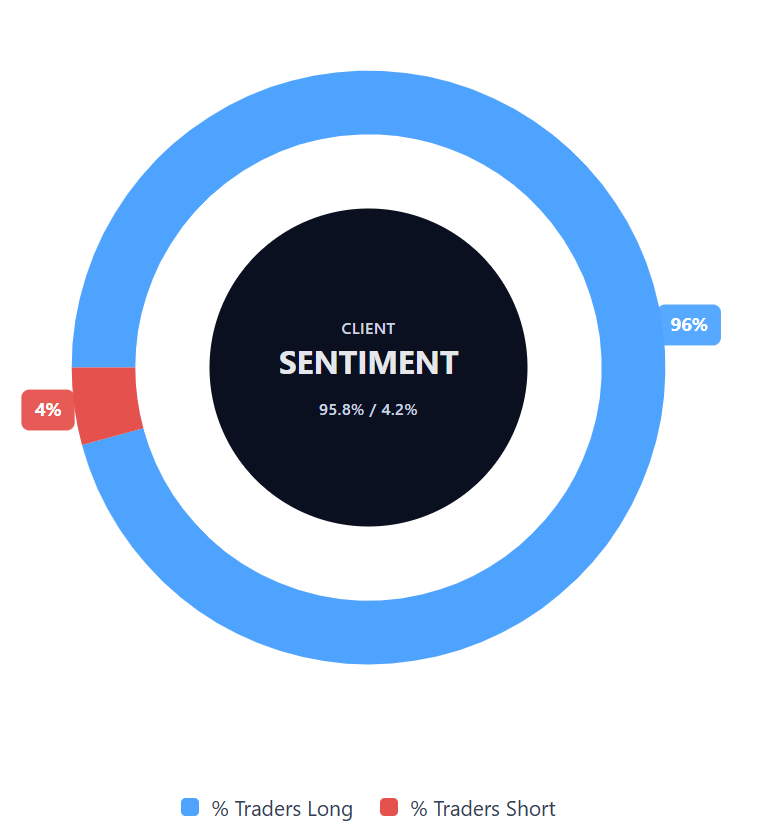
Capital.com’s client sentiment for Johnson & Johnson CFDs
As of 13 October 2025, buyers accounted for 95.8% and sellers for 4.2%, keeping Johnson & Johnson CFDs in buy-dominant territory with a 91.6 percentage point difference in favour of buyers.
This data reflects open positions on Capital.com and may change over time.
FAQ
Is Johnson & Johnson a good stock to buy?
Capital.com does not provide investment advice. Whether a stock is suitable depends on individual circumstances, financial goals and risk tolerance. Traders can use fundamental and technical analysis, along with educational resources available on Capital.com, to make informed trading decisions. Past performance is not a reliable indicator of future results.
Could Johnson & Johnson stock go up or down?
Like all listed shares, Johnson & Johnson’s price may rise or fall in response to market conditions, company performance and broader economic factors. Technical indicators – such as RSI, moving averages, and support or resistance levels – can help traders assess price trends, but they do not predict future movements.
Should I invest in Johnson & Johnson stock?
This decision depends on an individual’s financial position, objectives and approach to risk. Capital.com provides access to Johnson & Johnson share CFDs, enabling traders to speculate on price movements in either direction without owning the underlying asset. Contracts for difference (CFDs) are traded on margin, and leverage can amplify both profits and losses.