Forex Majors Test Key Levels
The US dollar has shown signs of strength in recent trading sessions, buoyed by encouraging developments in the US manufacturing sector. Specifically, the dollar's rise comes on the heels of news that the US manufacturing industry expanded in March for the first time since September 2022.
The US dollar has shown signs of strength in recent trading sessions, buoyed by encouraging developments in the US manufacturing sector. Specifically, the dollar's rise comes on the heels of news that the US manufacturing industry expanded in March for the first time since September 2022.
The resurgence in US manufacturing is particularly significant given its substantial contribution to the overall economy, accounting for 10.4% of GDP. The end of 16 consecutive months of contraction in manufacturing activity underscores a shift in trajectory, potentially signalling broader economic recovery.
Monday's momentum in manufacturing, coupled with Friday's report of easing US prices, has prompted a recalibration of market expectations regarding a potential rate cut in June. This adjustment has propelled the greenback to key levels against several major currency counterparts, reflecting renewed confidence in the US economic outlook.
EUR/USD
EUR/USD has descended towards a critical support zone, which has been established by the swing lows of December 2023 and February 2024. This support zone aligns with the 61.8% Fibonacci retracement level of the rally observed between October and December 2023.
If the market shapes a bullish reversal pattern, such as a double bottom formation, a bullish engulfing candlestick pattern, or a fakeout candle where the market breaches the support level momentarily before rebounding above it, potential buying opportunities may emerge for traders focusing on reversals.
EUR/USD Daily Candle Chart
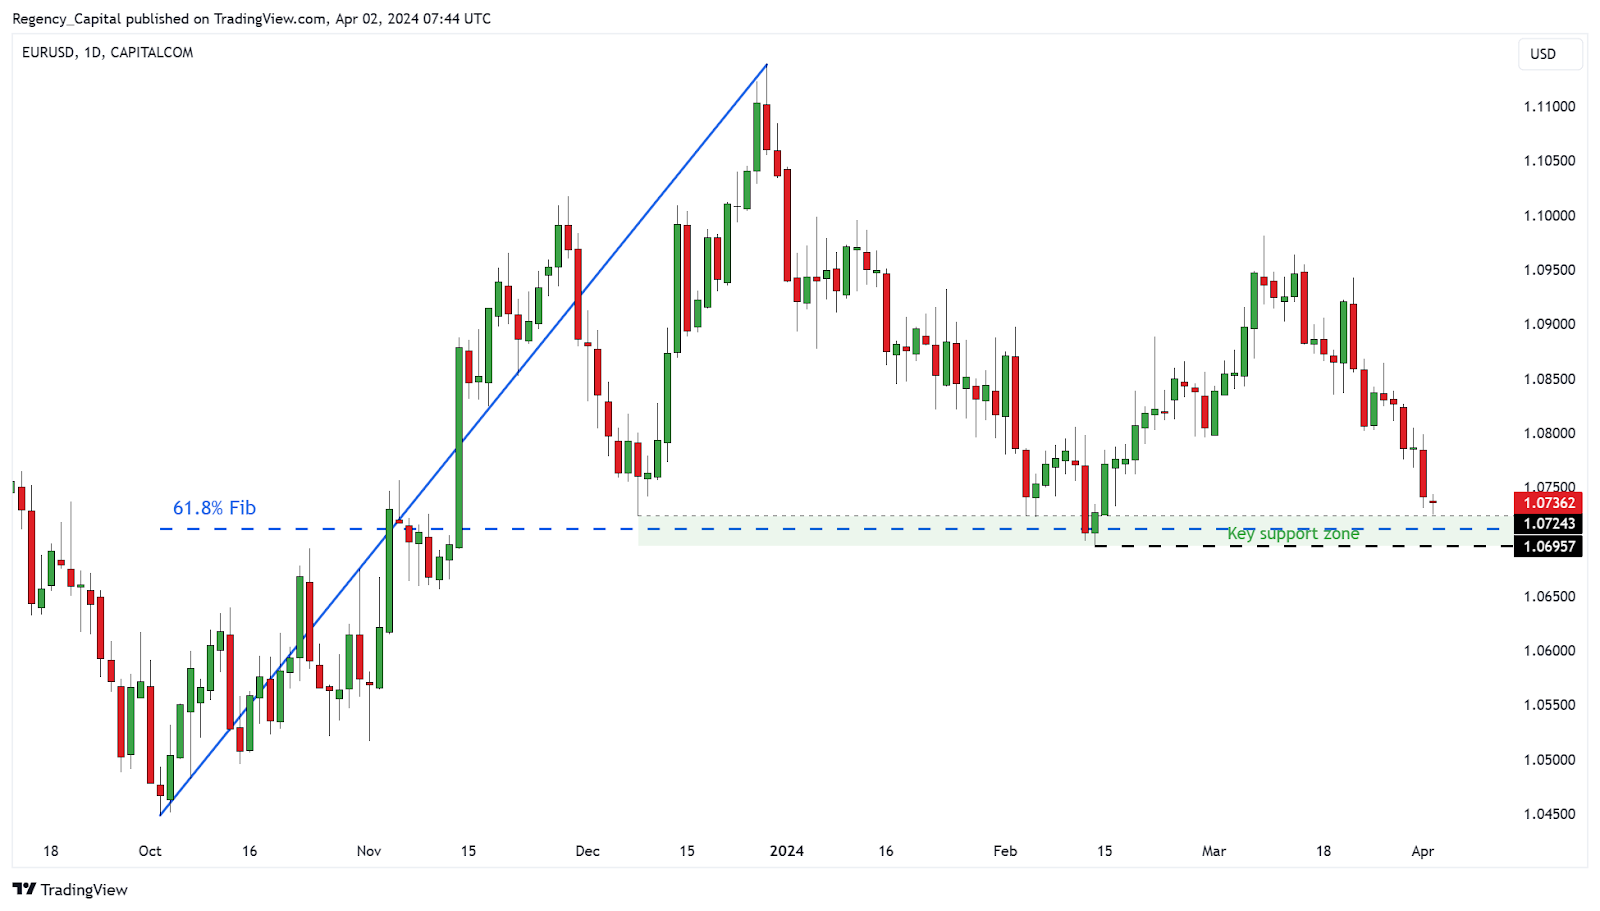
(Past performance is not a reliable indicator of future results)
GBP/USD
GBP/USD’s market structure has been rangebound since mid-December 2023. Having failed to break above the top of the range in March, GBP/USD has retreated towards the bottom of the range – creating a potential buying opportunity for reversal traders looking to play the range.
GBP/USD Daily Candle Chart

(Past performance is not a reliable indicator of future results)
USD/JPY
Among major forex pairs, USD/JPY stands out significantly as the pair approaches levels not witnessed since 1990. This critical resistance level potentially signals a trigger for intervention by the Bank of Japan. Finance Minister Shunichi Suzuki and top currency official Masato Kanda have recently reiterated the government's readiness to implement decisive measures to tackle excessive currency fluctuations.
As USD/JPY hovers below this pivotal threshold, traders must consider the heightened risks linked to substantial volatility when central banks intervene in the market.
USD/JPY Daily Candle Chart
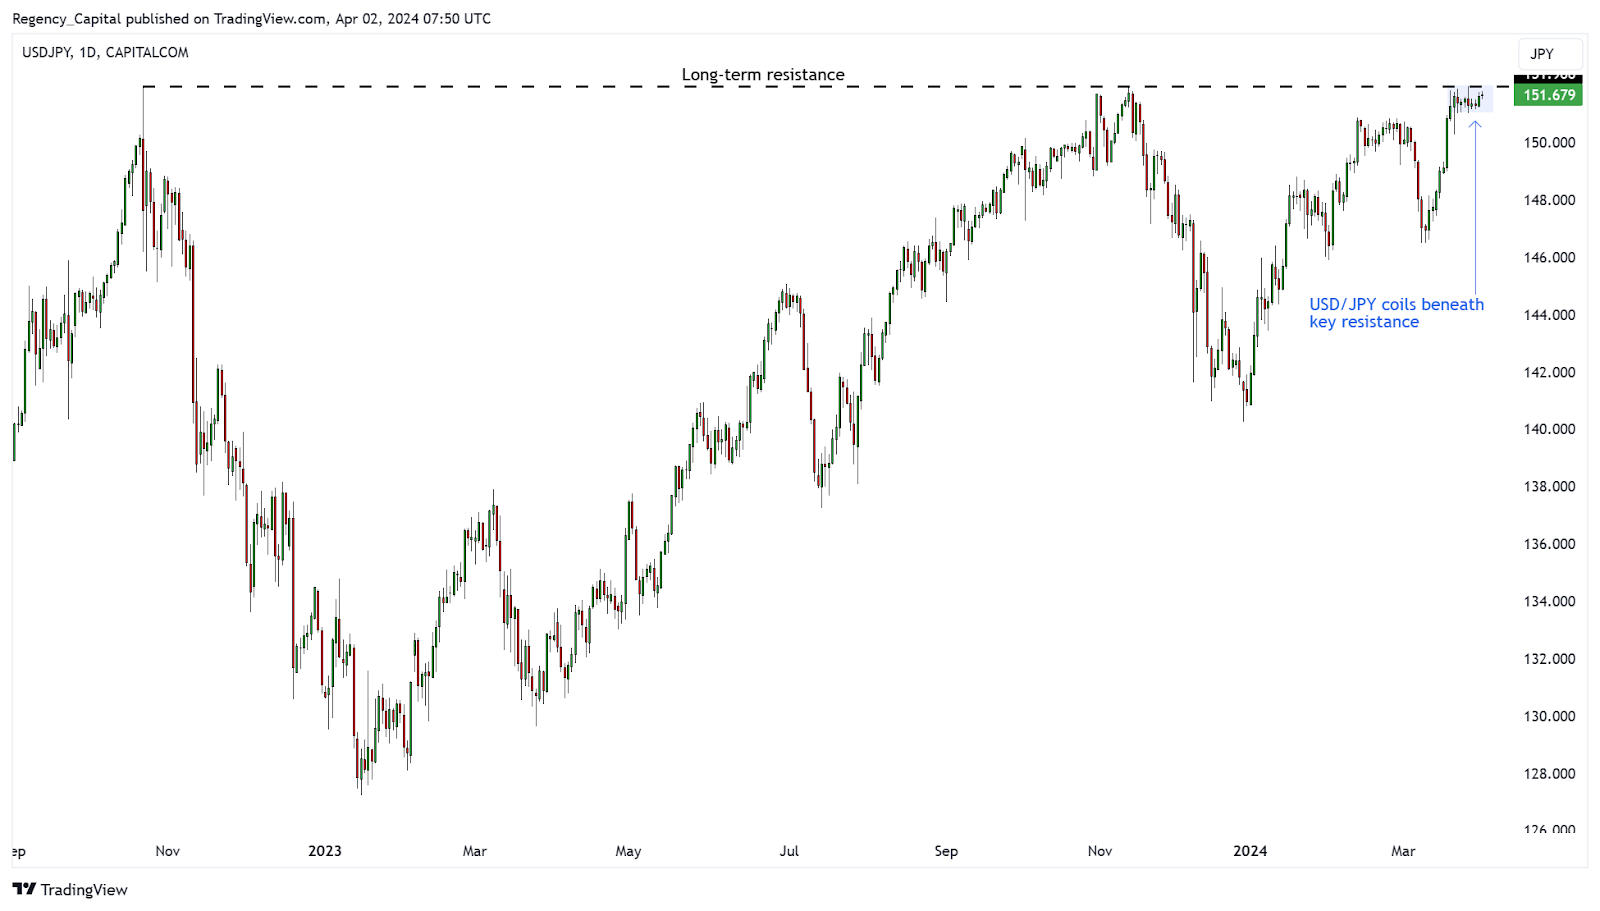
(Past performance is not a reliable indicator of future results)