Earnings Season Volatility: Netflix & Tesla in Focus
Options expiration is now behind us, which should lead to a broader trading range across the stock market and potentially greater volatility.
On top of that, the US earnings season will move into full swing this week, with Netflix and Tesla as the headline reports.
S&P 500
The S&P 500 rebounded on Friday, 17 October, by 53 basis points, continuing to find support at 6,600 and resistance just below 6,700. The options expiration on Friday, 17 October, likely played a big role in the tight trading range seen over the past few days, but that should change this week as gamma levels in the market drop, resulting in an expanded range.
Market maker options gamma positioning is likely to be negative at the start of the week, meaning their hedging flows will move with the direction of the index. In practice, that means market makers will be sellers in a down tape and buyers in an up tape, creating a more volatile trading environment. To start the week, the call wall in the S&P 500 sits around 6,750, while the put wall is near 6,500.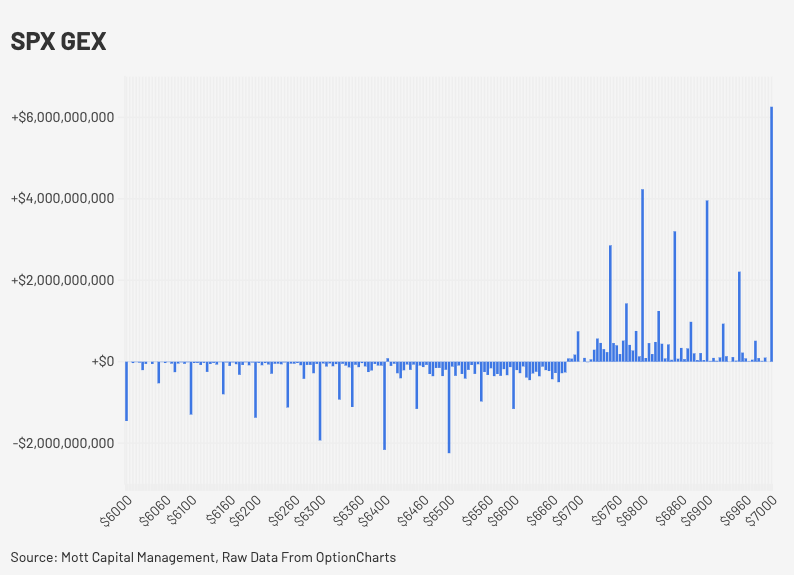
(Source: OptionCharts)
(Past performance is not a reliable indicator of future results)
Additionally, the S&P 500 has continued to fail at, and remain below, the 20-day moving average. This may indicate that systematic funds, such as commodity trading advisers (CTAs), are selling at that level. As long as the index continues to trade beneath the 20-day moving average, it could suggest that CTAs remain net sellers in the market.
The combination of CTA flows and negative gamma positioning may contribute to volatility expansion and could signal continued downside risk.
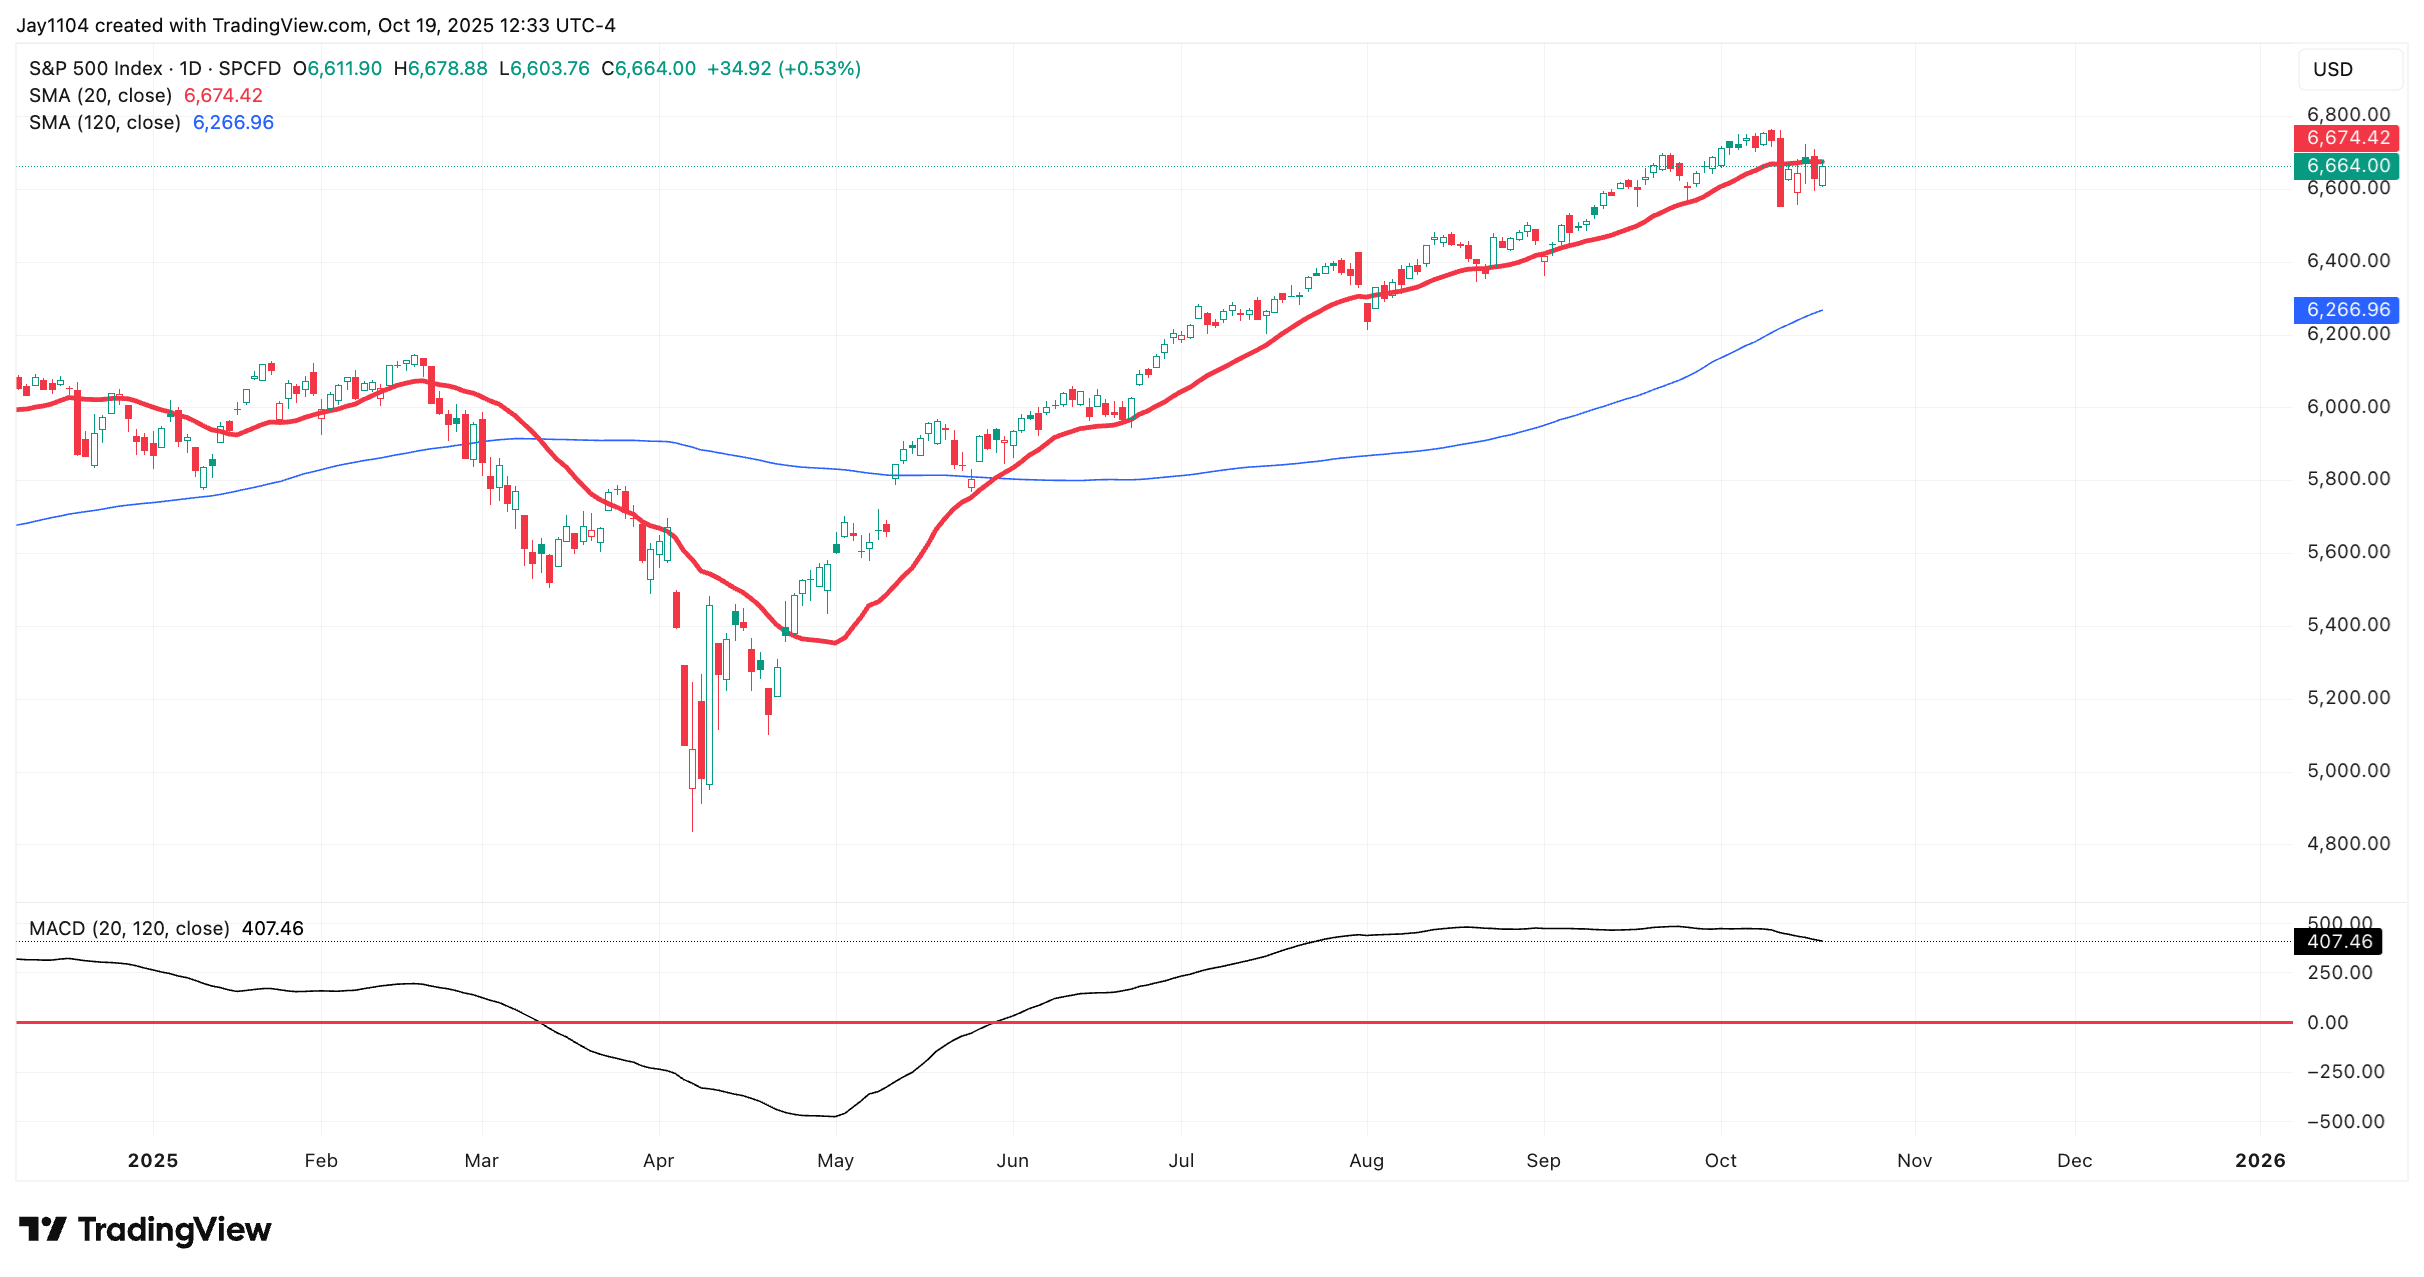
(Source: OptionCharts)
(Past performance is not a reliable indicator of future results)
Netflix Earnings
Netflix will report results on Tuesday, 21 October, after the close of trading. The stock is expected to see a price swing of around 6.7%, either up or down. Implied Volatility for the options expiring, 24 October, remains very high — above 70% as of Friday’s close — and is likely to continue rising in the lead-up to the results that evening.
Because option delta positioning for the options expiring this Friday is positive, it means that when the company reports results, call options are more likely to lose greater value, which could trigger bearish market maker flows as hedges are unwound. Additionally, the stock is currently in positive gamma territory, suggesting that market makers may also be sellers if the share price rises. The region with the most negative put gamma appears to be around $1,150. If the stock can drop below $1,150, then further downside could follow.
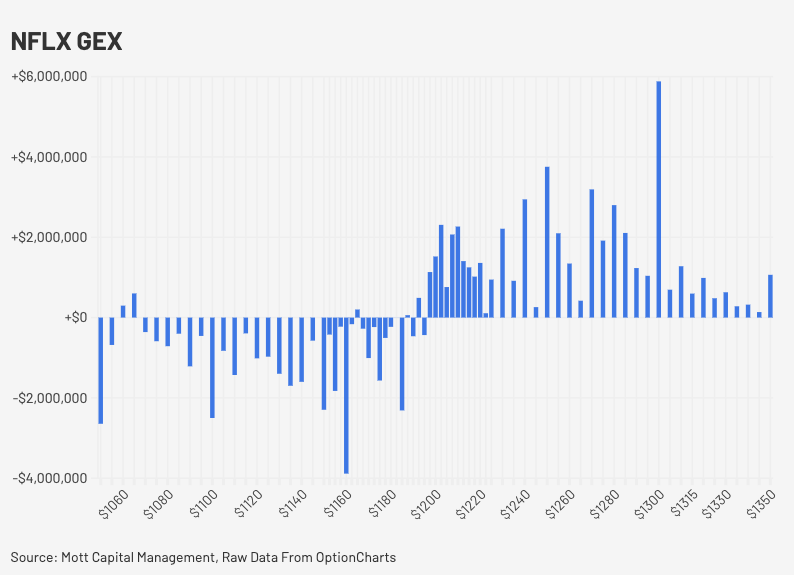
(Source: OptionCharts)
(Past performance is not a reliable indicator of future results)
The technical chart shows that a bearish descending triangle pattern has formed, and if the stock falls below support at $1,150, the next major level of support does not appear until around $1,100. The relative strength index also indicates that momentum has been negative and trending lower in recent weeks.
Taken together, the options positioning and technical trends may point toward a short-term bearish bias for Netflix — unless the company manages to deliver a significant upside surprise when it releases its earnings report.
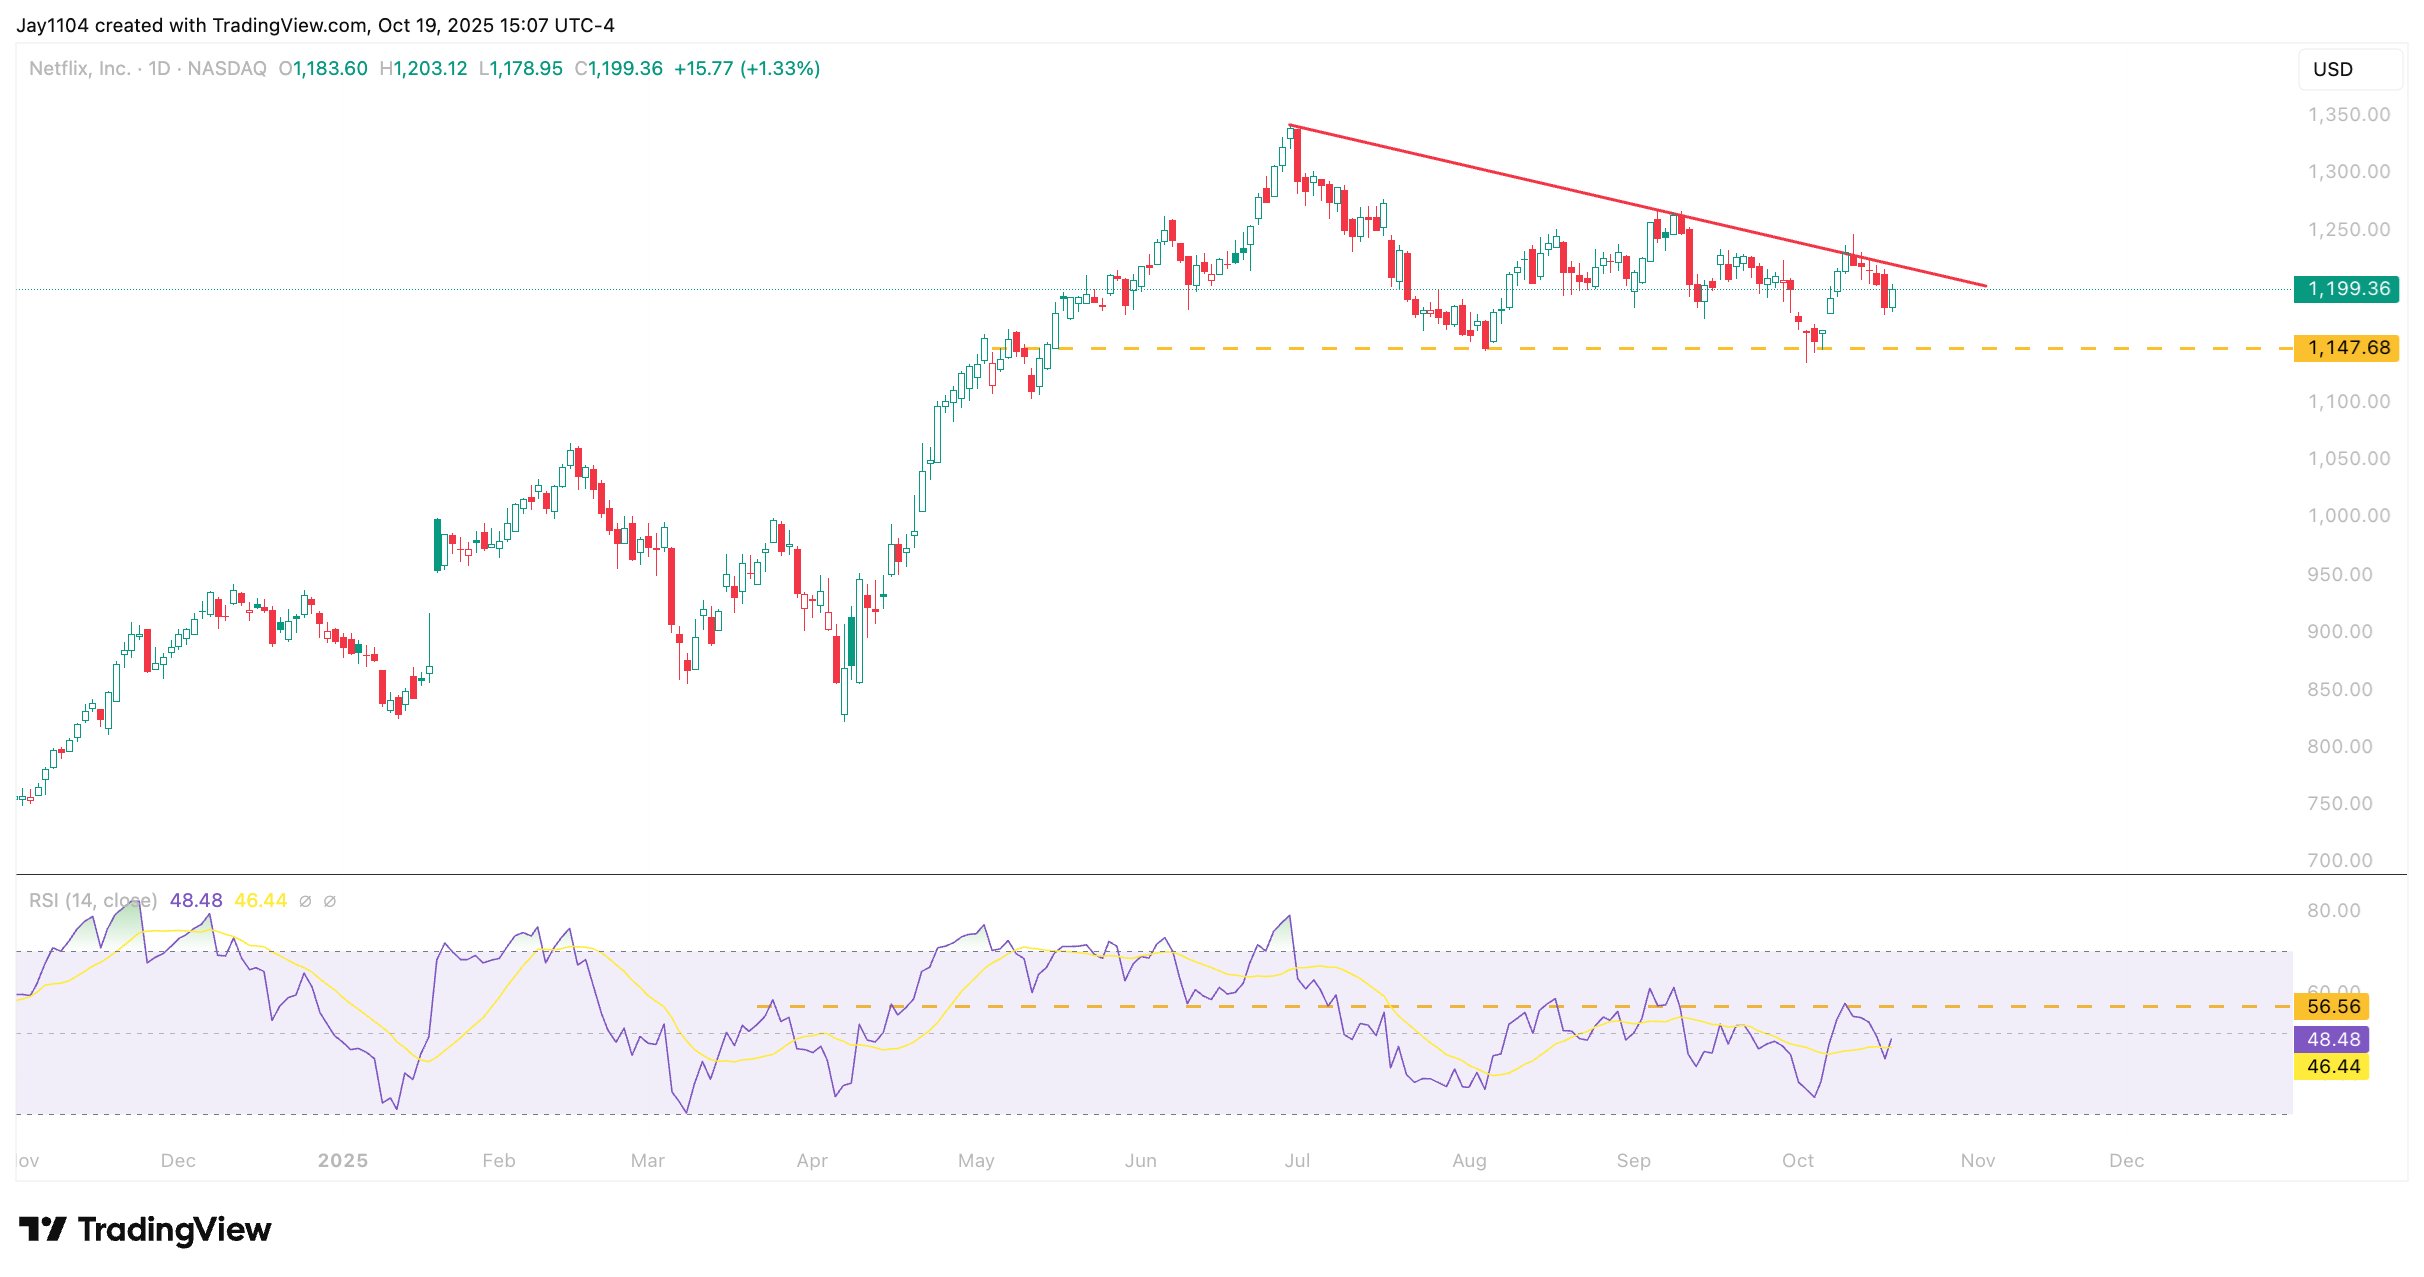
(Source: OptionCharts)
(Past performance is not a reliable indicator of future results)
Tesla Earnings
Tesla will report results on Wednesday, 22 October, after the close of trading in the US. The stock is expected to see a price swing of around 6.7%. Like Netflix, implied volatility for Tesla has risen above 70% for options expiring on 24 October and is likely to continue increasing until just before the company reports.
Options delta positioning is very bullish for Tesla, which means that following the results — and after implied volatility drops — delta values are likely to decline sharply. This could leave market makers over-hedged, resulting in selling pressure. From a client perspective, call option premiums are also likely to fall significantly, potentially prompting further call selling, which could pressure the shares lower.
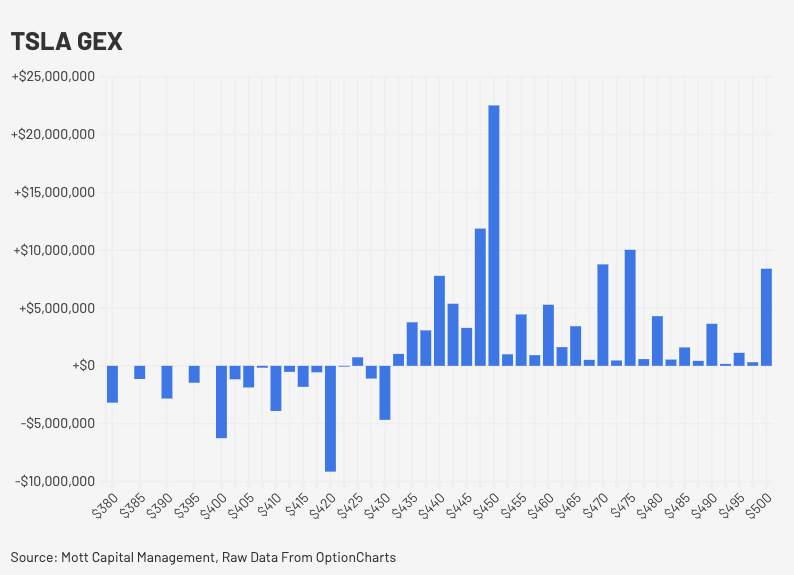
Gamma positioning is also bullish, with the largest concentration of call gamma around $450 and put gamma near $420. This suggests the stock may remain confined within a trading range between $420 and $450. Additionally, because the stock is in positive gamma, market makers are likely to be buyers if the stock falls and sellers if it rises.
For the downside to develop meaningfully, the stock would need to fall quickly below $420 after the results, as put gamma is significantly lower than call gamma, meaning a move lower faces weak support.
(Source: OptionCharts)
(Past performance is not a reliable indicator of future results)
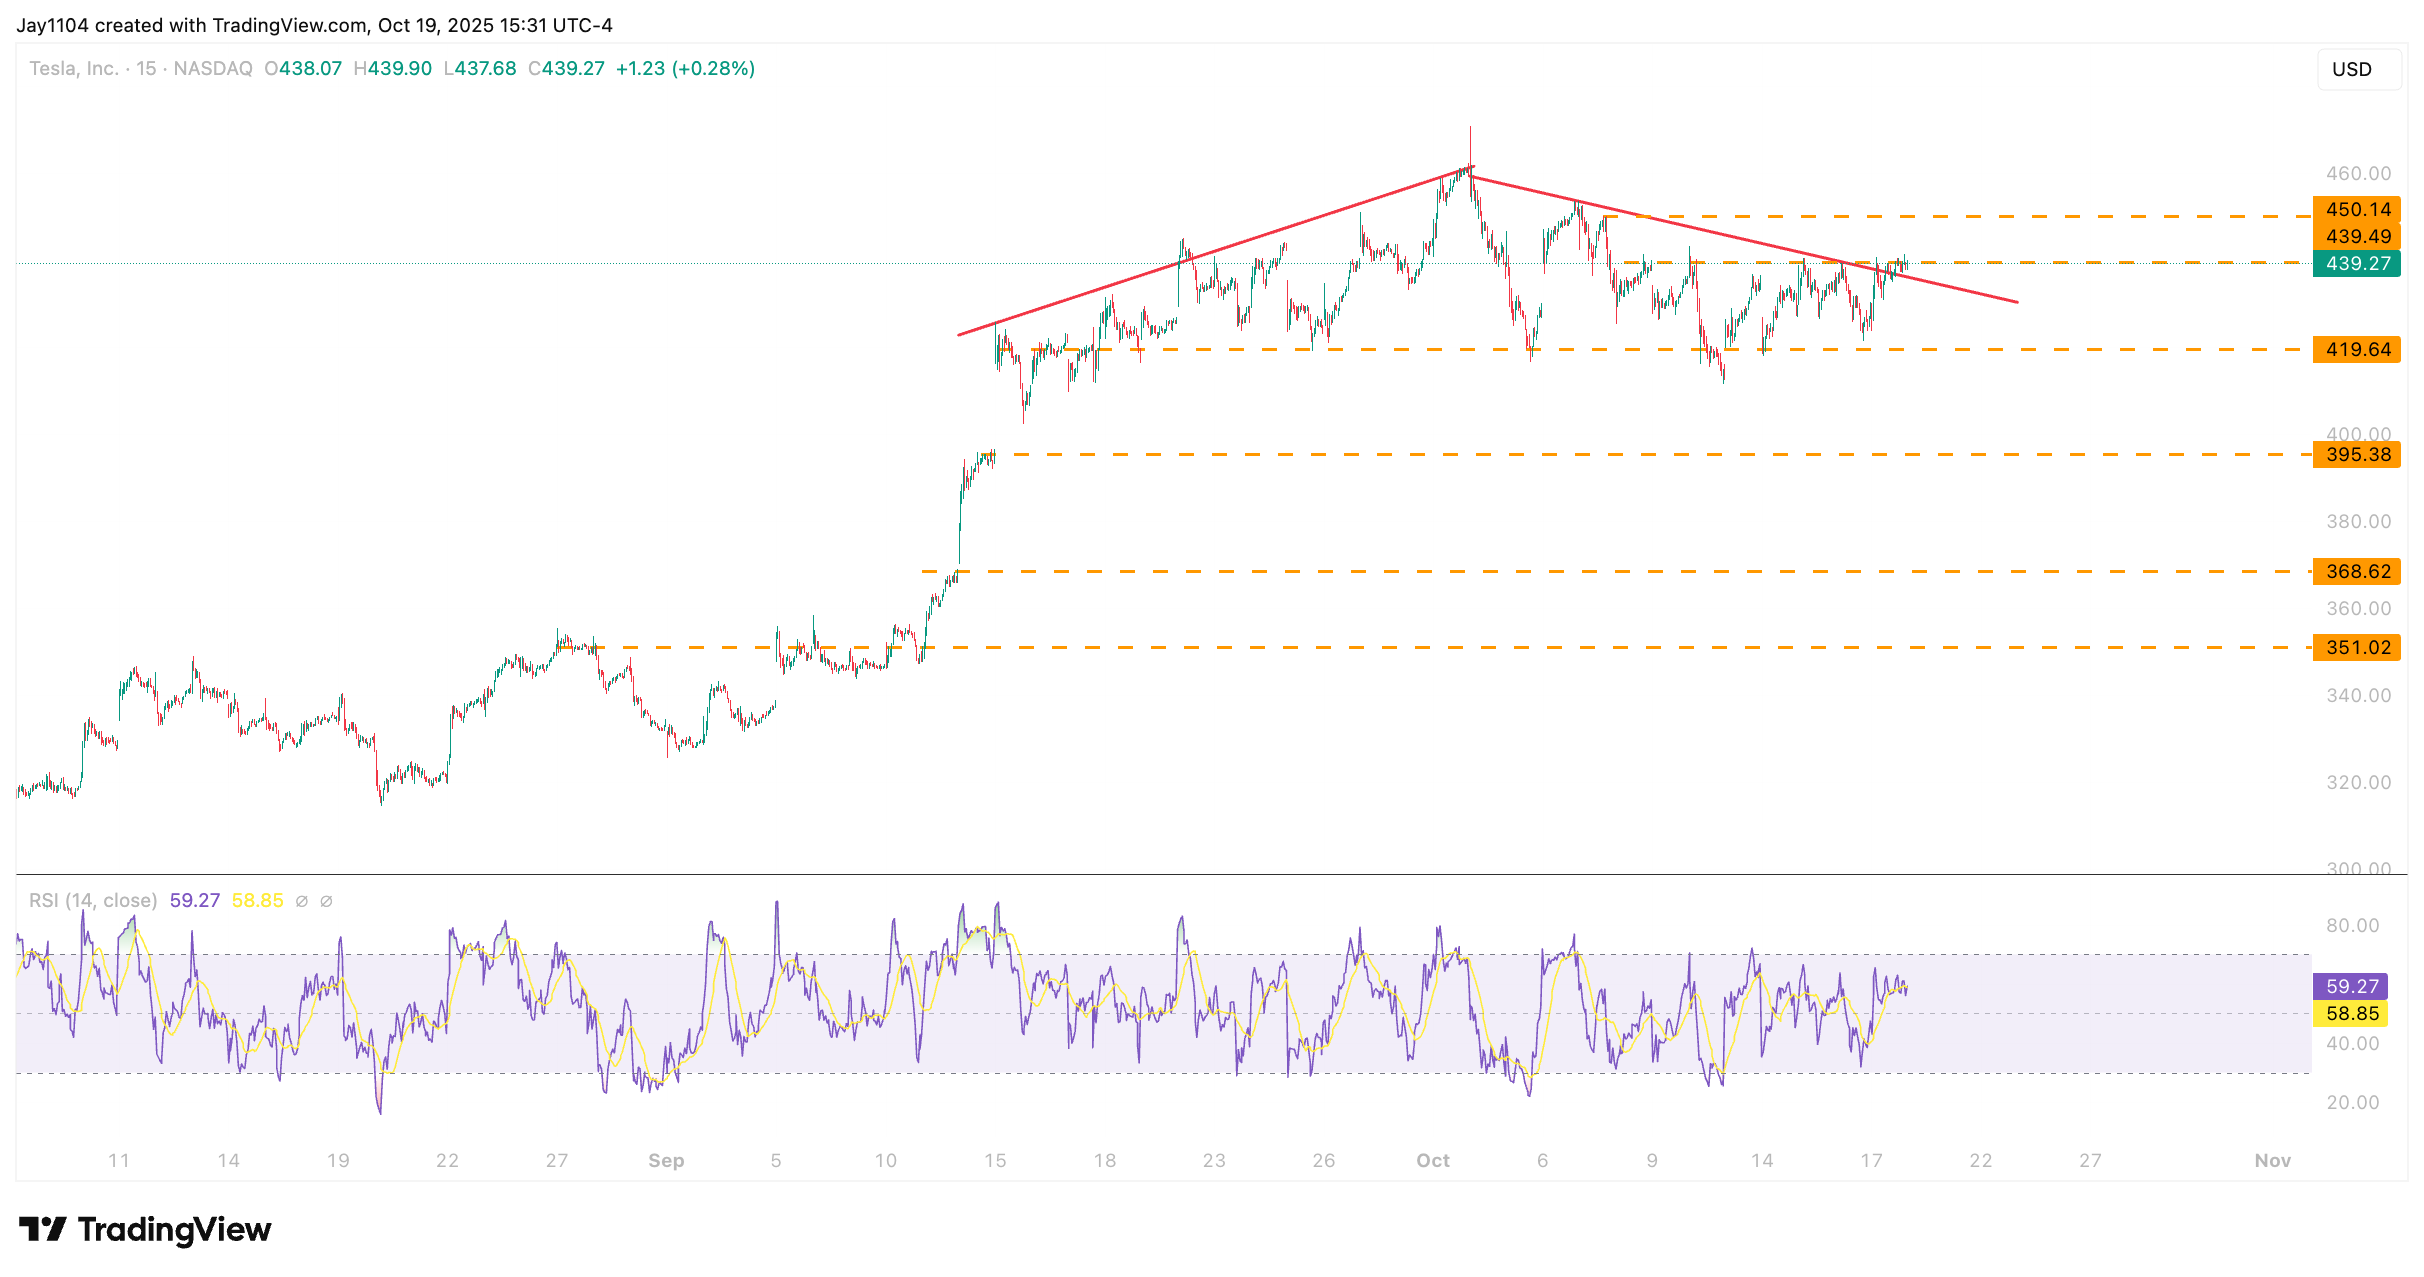
Technically, the stock appears to have formed a distribution pattern and would need to break below $420 to open the door to a potential decline towards $395. Meanwhile, resistance looks fairly strong in the $450 to $460 region, indicating limited upside potential unless results significantly exceed expectations.
(Source: OptionCharts)
(Past performance is not a reliable indicator of future results)