Five things traders learned this US earnings season
S&P 500 earnings beat expectations, valuations improved, and the Magnificent Seven led the way.
The US earnings season for the third quarter is all but over. Here are five things traders learned this reporting period.
The S&P 500 is delivering double digit earnings growth
The S&P 500 exceeded expectations again in the Q3. The market is on course to deliver 13.4% earnings growth for the the period*, vastly exceeding the 7.9% estimate heading into it. The result was underpinned by a better than expected 8.4% expansion in revenues and an increase in profit margins to a 16 year high of 13.1%. It extends a streak of double digit earnings growth for Wall Street, with resilient economic activity translating into an expected expansion in profits for the calendar year of 2025 of nearly 11%.
Magnificent Seven earnings are still beating expectations - but by less than before
The Magnificent Seven stocks remain the main drivers of the S&P 500’s earnings growth. However, its outperformance is slowing down. The group delivered 18.4% growth versus the 11.9% growth for the “S&P 493”*. This exceeded the roughly 14% growth projected by analysts heading into the reporting period. But that was down from the nearly 27% and 28% growth delivered in Q1 and Q2. Profits are forecast to re-accelerate again amongst the cohort as investors push further into 2026. The expected ramp up of artificial intelligence monetisation has analysts predicting that the Magnificent Seven will return to earnings growth somewhere in the mid 20% range by Q2 and Q3 of next year.
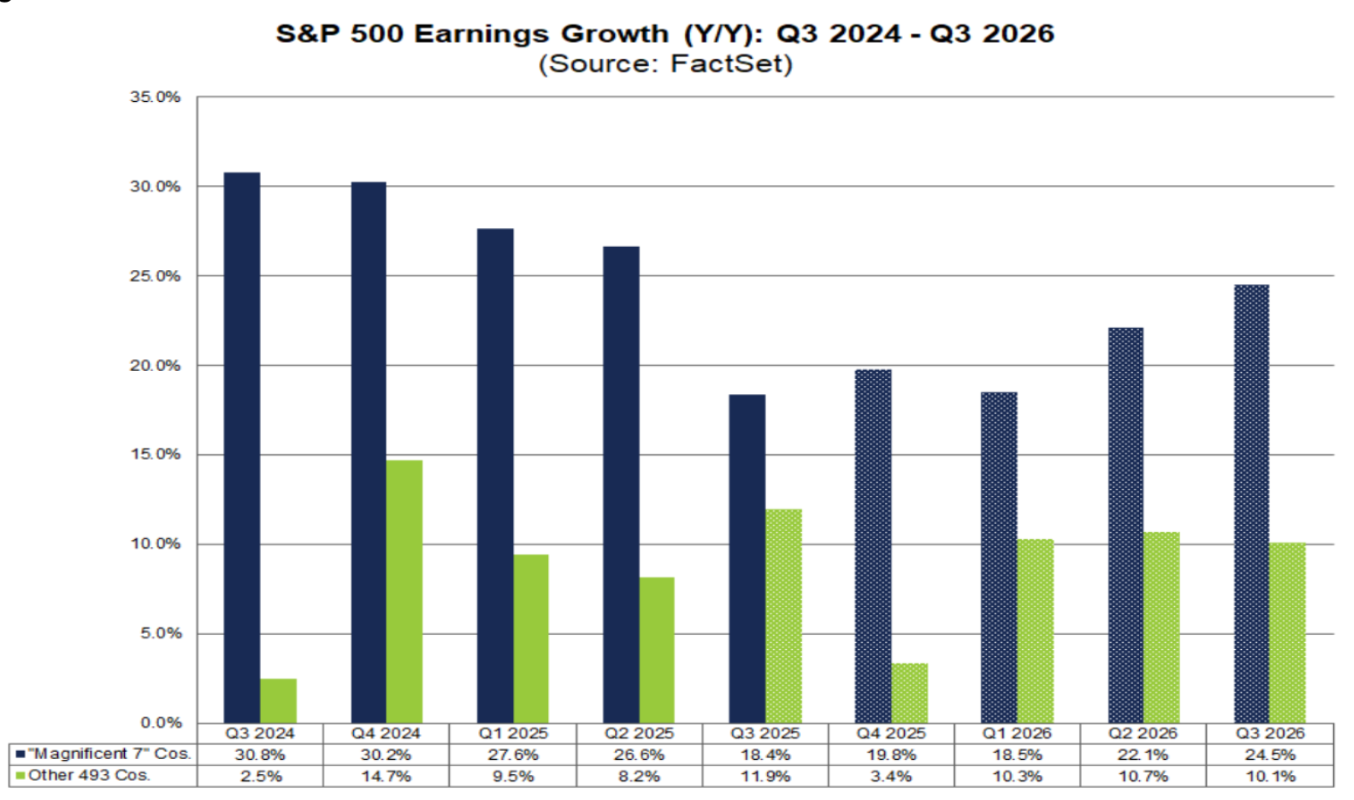
(Source: FactSet)
Earnings growth is broadening out
Earnings growth was deeper and broader for the S&P 500 in Q3. 83% of companies posted upside surprises for the quarter*. Meanwhile, the number of sectors reporting earnings growth widened to nine. The IT sector was predictably the strongest because of strength in semiconductor companies. But in a sign of improving earnings cyclicality, cyclical sectors, especially the financial sector, posted very strong earnings growth. Every sector also posted topline expansion, indicating strong fundamental earnings momentum that analysts think will accelerate into the new calendar year.
Analysts expected strong earnings growth in the year ahead
Solid guidance has led analysts to upgrade expectations for future earnings growth across the S&P 500. EPS growth projections for Q4 have been revised higher to 7.5%, with double digit earnings expected for FY26. This includes forecasts of 12.2% and 13.3% EPS growth in Q1 and Q2 respectively*. Companies backed up this optimism with their earnings revisions during the Q3 reporting period. Guidance was generally positive, with the percentage of companies providing negative guidance falling below historical averages.
Valuations are rich but not as rich as before
The S&P 500 remains richly valued, historically speaking. However, valuations moderated throughout the earnings period, courtesy of the upward revisions to the earnings outlook and the drop in stock prices seen throughout November. The S&P 500’s Forward 12-Month P/E Ratio fell from above 23 and levels reminiscent of the COVID bubble and Dot.com boom, to a still high but less extreme 21.5* towards its end. There remains fears about overinvestment in artificial intelligence infrastructure and the failure of tech firms to deliver the earnings growth expected going forward. However, such fears are yet to materialise in actual results.
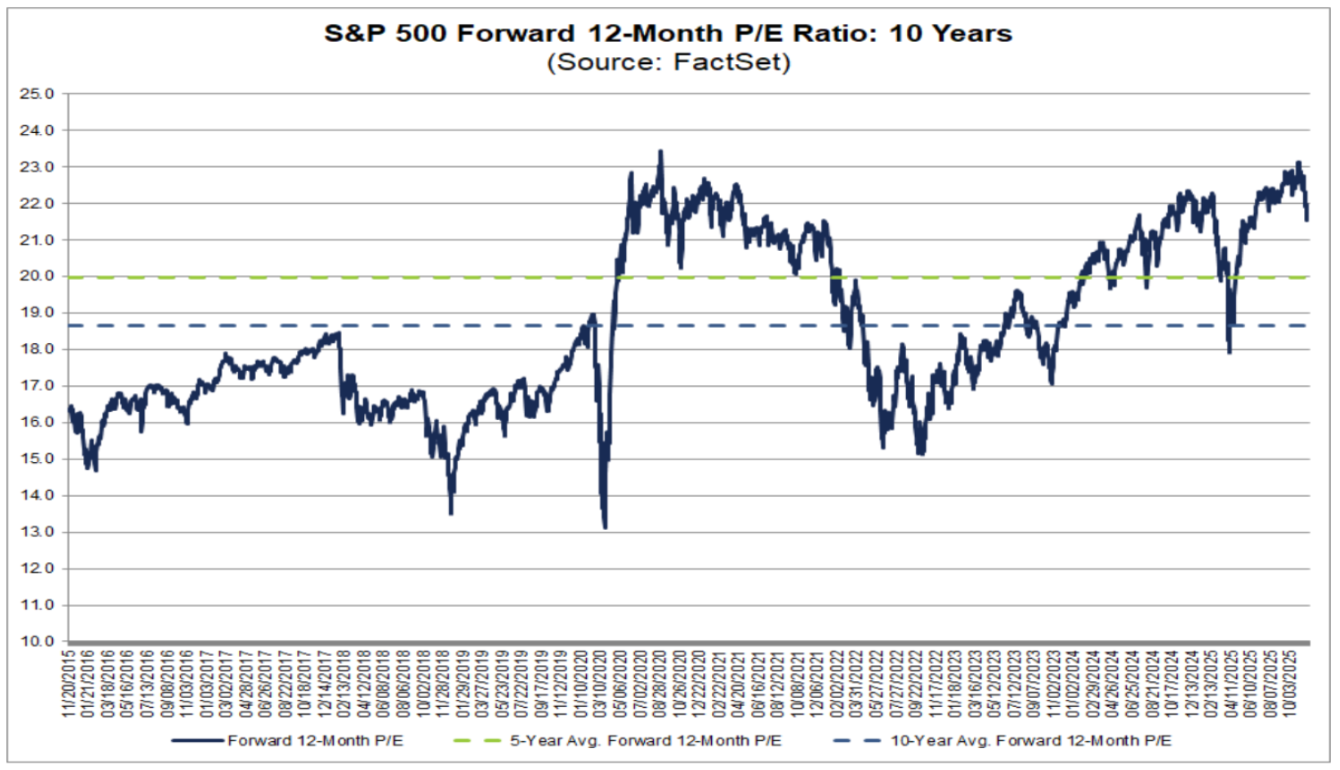
(Source: FactSet)
* Data according to FactSet as of 21st of November, 2025