Hong Kong 50 forecast: US trade status decision
Hong Kong 50 tracks the Hang Seng Index. The market recently responded to the US decision not to renew the 2020 order revoking Hong Kong’s special trade status. Past performance is not a reliable indicator of future results.
The Hang Seng Index, referred to as the Hong Kong 50 (HK50) on CFD trading platforms such as Capital.com, is trading near $25,314.20 at 10.14am UTC on 28 July 2026, holding within the day’s $25,047.30–$25,411 intraday range. Past performance is not a reliable indicator of future results.
The market has drawn some support from the US decision not to renew the 2020 order revoking Hong Kong's special trade status (Reuters, 17 July 2026). Beijing said Washington had confirmed the decision following recent US–China trade talks and tariff reductions (Japan Times, 18 July 2026). Meanwhile, Hang Seng constituents, including technology and property companies, have recorded mixed sessions amid continued scrutiny of cross-border brokerage restrictions affecting mainland investors' access to Hong Kong-listed shares (Reuters, 8 June 2026).
Third-party Hong Kong 50 outlook: trade-status shift
As of 28 July 2026, third-party Hong Kong 50 predictions point to a broad range of possible price levels through 2026 and 2027. The projections reflect differing expectations for Chinese policy support, earnings growth and technology-sector momentum.
Trading Economics (macro model update)
Trading Economics projects that the HK50 will trade at 24,374.13 points by the end of the current quarter, with a 12-month projection of 21,945.18 points. The model bases its outlook on global macroeconomic variables used in its algorithmic forecasting framework rather than company-specific developments, so its projection reflects broad economic inputs rather than a detailed assessment of individual Hang Seng constituents (Trading Economics, 28 July 2026).
HSBC Private Bank (North Asia CIO update)
HSBC's North Asia CIO team projects that the Hang Seng Index will reach 28,000 points by the end of 2026, revising its previous internal target upwards. The bank's chief investment officer for North Asia links the forecast to an expected recovery in Hong Kong's retail sector, resilient property-market performance, a strong IPO pipeline and continued AI-related development, though these assumptions remain sensitive to changes in economic activity, policy implementation and corporate earnings (The Standard, 28 May 2026).
Citi (equity strategy note)
Citi projects that the Hang Seng Index will reach 29,600 points by the end of 2026, implying an increase of roughly 12.1% from the level referenced at the time of its forecast. The bank bases its projection on expectations of structural earnings improvement and states a preference for mainland A-shares over Hong Kong-listed technology shares, suggesting its broader regional outlook does not imply equal performance across all Chinese equity markets (The Standard, 27 May 2026).
Forecasts.org (statistical model)
Forecasts.org's rolling statistical model projects a July 2026 monthly average of 22,882 points, with an average error band of plus or minus 838 points, and forecasts a rise towards 25,300 points by January 2027. The model derives its estimates solely from historical price patterns rather than fundamental or macroeconomic analysis, so it may not fully account for unexpected policy decisions, earnings changes or shifts in investor sentiment (Forecasts.org, 15 July 2026).
Predictions and third-party forecasts are inherently uncertain, as they cannot fully account for unexpected market developments. Past performance is not a reliable indicator of future results.
Hong Kong 50: macroeconomic backdrop and sector news
The Hang Seng Index closed 0.41% higher on 28 July 2026 at 25,310.85 points, with the Hang Seng China Enterprises Index up 0.85% to 8,436.25 points and the Hang Seng Tech Index adding 0.61% to 4,730.61 points (Xinhua, 28 July 2026).
On the macro side, Hong Kong's economy grew 5.9% year on year in the first quarter of 2026, with the government forecasting full-year growth of 2.5%–3.5%; consumer prices rose 1.7% in April, unemployment held at 3.7% for February–April, and retail sales rose 12.8% year on year in March (HKTDC, 30 June 2026).
Financials remain Hong Kong's largest listed sector by market capitalisation, followed by technology services and electronic technology (TradingView, 26 October 2025). Reuters has flagged a record wave of IPO lock-up expiries, concentrated in July and September, as a potential source of secondary selling pressure (Reuters, 5 July 2026), with roughly HK$255 billion in shares set to unlock in July alone (China Daily HK, 24 June 2026). This coincides with continued new listing activity, including AI-related technology flotations, after Hong Kong IPOs hit a five-year high in early 2026 (Financial Times, 4 April 2026).
HK50 index price: technical overview
As of 10.14am UTC on 28 July 2026, the HK50 index trades near 25,314.20. Its 20-, 50-, 100- and 200-day moving averages stand at approximately 24,374, 24,588, 25,178 and 25,753, respectively, according to TradingView.
The price remains above the three shorter-term averages but below the 200-day simple moving average. The 20-day average also sits above the 50-day average, which may point to positive short-term momentum, although moving averages are backward-looking and do not predict future performance.
The 14-day relative strength index stands at 60.76, while the average directional index is 15.95. Together, these readings suggest that momentum has improved, but the trend remains relatively weak.
The nearest classic resistance pivot, R1, is around 25,111, with the price already above this level. A sustained move higher could bring R2 near 27,342 into focus. On the downside, the classic pivot near 23,815 provides a lower reference, while the 100-day and 200-day averages may also act as technical levels.
The nine-period Hull moving average stands near 25,215. Wider differences across Classic, Fibonacci, Camarilla and Woodie pivots show that support and resistance levels vary by method (TradingView, 28 July 2026).
This technical analysis is for informational purposes only and does not constitute financial advice or a recommendation to buy or sell any instrument.
Hong Kong 50 index history (2024–2026)
The Hong Kong 50 index began August 2024 trading near 16,700 and reached a low of 16,497.90 on 6 August 2024 amid broad market weakness.
It then rose into early October, reaching an intraday high of 23,510.80 on 7 October 2024 after China announced further stimulus measures.
The index subsequently moved higher through late 2025 and early 2026, reaching 27,403.10 on 10 February 2026. Earlier in this period, HK50 had fallen to 18,811.60 on 8 April 2025 amid tariff-related risk aversion in global markets before recovering over the following days.
During the first half of 2026, the index moved lower from its February peak and traded at 22,792.60 on 1 July 2026 before recovering part of the decline.
Hong Kong 50 closed at 25,317.30 on 28 July 2026, approximately 26.4% higher year on year, but around 7.6% below its February 2026 high.
The price history shows that the index has experienced several pronounced advances and pullbacks over the period. It also illustrates why recent gains should be considered alongside the scale and frequency of earlier declines.
Past performance is not a reliable indicator of future results. Prices are indicative and may differ from live market prices.
Hong Kong 50 (HK50): Capital.com analyst view
Hong Kong 50’s price action in 2026 has reflected a balance between supportive factors and periods of volatility. The index moved from a February high above 27,400 points to around 25,300 points in July, as Chinese policy announcements, technology-sector earnings expectations and an active Hong Kong IPO pipeline shaped market sentiment.
These factors could influence the index in either direction. Stronger earnings, further policy support or improved investor demand may lift expectations, while delays to policy measures, weaker results or lock-up expiries could add pressure. Global factors, including US interest-rate expectations, the US dollar and broader risk appetite, may also affect Hong Kong-listed equities.
Technology-sector performance and mainland capital flows remain important, but their impact will depend on regulation, investor participation and corporate earnings. Overall, the outlook remains open rather than directional.
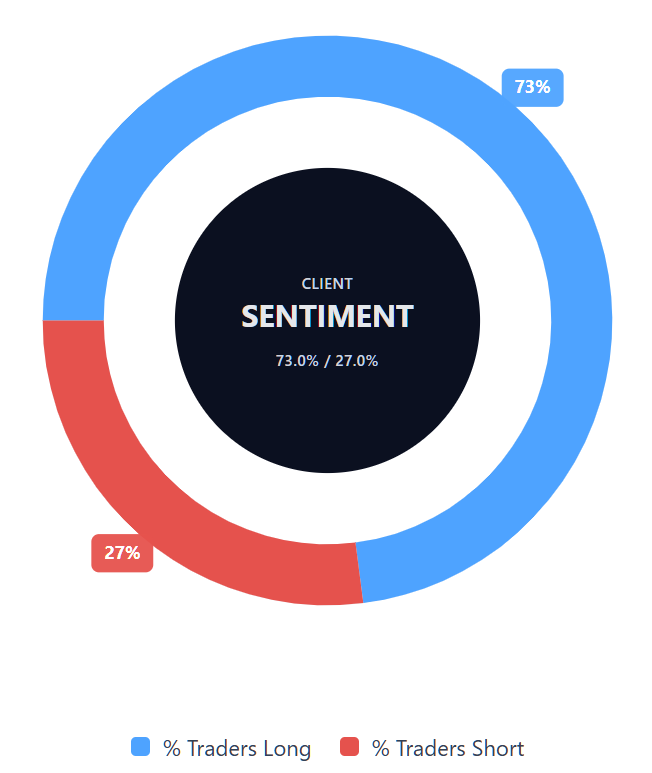
Capital.com’s client sentiment for Hong Kong 50 CFDs
As of 28 July 2026, Capital.com client positioning in Hong Kong 50 CFDs shows 73% buyers and 27% sellers, placing buyers 46 percentage points ahead of sellers. The figures represent open positions held by Capital.com clients at the time of publication and can change. They show how current clients are positioned, not how the wider market will move.
Client sentiment does not predict future performance and should not be considered in isolation.
Summary – Hong Kong 50 2026
- Hong Kong 50 traded near $25,314.20 at 10.14am UTC on 28 July 2026, up 26.4% year on year but below its February peak above 27,400.
- The price remained above shorter-term moving averages, while an RSI near 61 and a low ADX pointed to positive but limited trend strength.
- Key influences include Chinese policy, technology earnings, IPO activity, lock-up expiries, US rate expectations and broader market sentiment.
- Recent developments include the US trade-status decision, mixed sector performance and varied third-party forecasts for 2026 and 2027.
Past performance is not a reliable indicator of future results.
FAQ
Could Hong Kong 50 go up or down?
Hong Kong 50 could move in either direction. Factors that may support the index include stronger company earnings, additional Chinese policy support, improved investor demand and continued IPO activity. Risks include weaker-than-expected earnings, delayed policy measures, regulatory changes, lock-up expiries and deteriorating global sentiment. Technical indicators in the article show improved short-term momentum but limited trend strength, while third-party forecasts present a wide range of possible outcomes rather than a consistent directional view.
Should I invest in Hong Kong 50?
The article does not recommend investing in Hong Kong 50. Whether exposure to the index is appropriate depends on individual circumstances, financial goals, time horizon and tolerance for loss. Traders should consider the index’s sensitivity to Chinese policy, technology-sector earnings, capital flows and broader global market conditions. They should also distinguish between investing in underlying assets and trading CFDs, as CFDs are leveraged products that can lead to rapid losses and do not provide ownership of the underlying index.
Can I trade Hong Kong 50 CFDs on Capital.com?
Trading Hong Kong 50 CFDs on Capital.com lets you speculate on movements without owning the underlying asset and to take long or short positions. However, contracts for difference (CFDs) are traded on margin, and leverage amplifies both profits and losses. You should ensure you understand how CFD trading works, assess your risk tolerance, and recognise that losses can occur quickly.