Featured articles

DAX 40 continues to push to new highs
The DAX 40 sees six consecutive days of gains as the index pushes to new highs driven by risk-on sentiment
09:54, 12 January 2026

From Caracas to Wall Street: how the U.S.–Venezuela crisis could move markets
The start of the new year has marked a dramatic escalation in the United States’ confrontation with Venezuela.
08:53, 9 January 2026

Intel stock split: what it means for traders
Intel’s long history of stock splits reflects the company’s evolution through several major technology cycles, from early PC growth to data-centric expansion. With its most recent split taking place more than two decades ago, questions often arise about whether Intel may adjust its share structure again.
15:49, 19 December 2025

Tesla stock forecast: Could Q1 2026 earnings lift targets?
Tesla (TSLA) is a US-listed automotive and clean energy company whose shares trade on the Nasdaq and are closely monitored for earnings performance, delivery data and developments in technology and manufacturing. Explore third-party TSLA price targets and technical analysis.
9 hours ago

Deutsche Telekom stock forecast: Pre-FY2025 price targets
Deutsche Telekom is a Germany-based telecommunications company listed on the Frankfurt Stock Exchange, with operations spanning mobile, broadband and digital services in Europe and the US through T-Mobile US. Explore third-party DTE price targets and technical analysis.
10 hours ago

Trading the Dow 30 as Tariff Uncertainty Returns
Red in the futures market sees contained retreat continuing to test its shorter-term technicals, while in sentiment there’s been a shift to net short among CoT speculators.
12 hours ago

Apple stock forecast: Third-party price targets
Apple Inc is a US-based technology company listed on the Nasdaq under the ticker AAPL, generating revenue from hardware products such as the iPhone and Mac, alongside a growing global services business. Explore third-party AAPL price targets and technical analysis.
14:55, 20 February 2026

Market Mondays: Markets Rattled as Tariff Uncertainty Returns
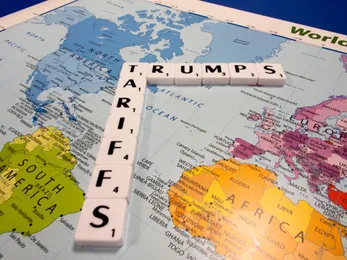
Markets digest the latest ruling on Trump's tariffs and how the administration may look for other avenues to impose higher duties.
9 hours ago

Trading the Dow 30 as Tariff Uncertainty Returns
Red in the futures market sees contained retreat continuing to test its shorter-term technicals, while in sentiment there’s been a shift to net short among CoT speculators.
12 hours ago

Cooling but not cracking: The UK’s delicate economic balance
The UK economy is showing signs of fatigue with minimal growth and a slowing labour market, but inflation still remains above target.
10:38, 18 February 2026

Hong Kong 50 forecast: Third-party targets
The Hong Kong 50, a CFD that references the Hang Seng Index, tracks the performance of some of the largest and most actively traded Hong Kong-listed companies, making it a widely followed benchmark for regional equity markets.
14:20, 17 February 2026

Market Mondays: Markets Rattled as Tariff Uncertainty Returns
Markets digest the latest ruling on Trump's tariffs and how the administration may look for other avenues to impose higher duties.
9 hours ago

Oil Climbs as Geopolitical Risk Returns
Oil prices rise as markets price in a higher chance that the escalating conflict between Iran and the US could cause supply disruption.
11:26, 19 February 2026

Market Mondays: Volatility Dominates as Precious Metals Lead the Narrative
Markets trade with caution after the recent volatility as traders await the latest employment and inflation data from the US.
11:36, 9 February 2026

Are oil markets underestimating escalation risks between Iran and the US?
Oil markets have remained slightly subdued in recent weeks despite the rising tensions between the US and Iran.
12:13, 4 February 2026

Market Mondays: Markets Rattled as Tariff Uncertainty Returns
Markets digest the latest ruling on Trump's tariffs and how the administration may look for other avenues to impose higher duties.
9 hours ago

Cooling but not cracking: The UK’s delicate economic balance
The UK economy is showing signs of fatigue with minimal growth and a slowing labour market, but inflation still remains above target.
10:38, 18 February 2026

United States interest rate forecast: Third-party predictions
As the Federal Reserve adjusts policy, where might US interest rates be in five years?
14:51, 12 February 2026

NOK/PLN forecast: Third-party price targets
Norwegian krona Polish zloty (NOK/PLN) is a foreign exchange cross that compares Norway’s krone with Poland’s zloty, reflecting relative economic conditions and monetary policy in both countries.
14:46, 12 February 2026

Zcash price prediction: Third-party outlook
Zcash (ZEC) is a decentralised cryptocurrency launched in 2016, designed to offer optional transaction privacy, and it trades on major crypto exchanges against the US dollar and other digital assets. Explore third-party ZEC price targets and technical analysis.
12:08, 18 February 2026

Pi Network price prediction: Third-party outlook
Explore third-party PI price targets and technical analysis.
11:35, 18 February 2026

BitTorrent price prediction: Third-party outlook
BitTorrent (BTT) is a crypto token associated with the BitTorrent protocol and the Tron blockchain, trading at fractions of a US dollar within a market shaped by liquidity, regulation and broader crypto trends. Explore third-party BTT price targets and technical analysis.
12:25, 17 February 2026

Fartcoin price prediction: Third-party outlook
Fartcoin (FARTCOIN) is a Solana-based cryptocurrency that trades on digital asset exchanges and has recorded notable price volatility since launch, reflecting shifts in liquidity and broader crypto market conditions. Explore third-party FARTCOIN price targets and technical analysis.
11:08, 17 February 2026
