Trading Gold’s short-term bull channel
Denial of Fed Chair Powell’s removal has meant a pullback off the highs, but what will it take to get gold prices to break out of its short-term bull channel?
There was quite a bit to digest yesterday starting with US pricing data that was lighter – and in the current inflationary environment – better than anticipated. Headline PPI (Producer Price Index) dropped from 2.6% y/y (year-on-year) to 2.3% and beneath 2.5% expectations, and a similar story for core from 3% to 2.6%. Growth m/m (month-on-month) was lacking another positive sign with flat prints for both headline and core instead of 0.2% forecasts, though previous readings were revised higher to 0.3-0.4%.
In all, lighter pricing data at a time when policymakers are looking to keep inflation in check is seen as a plus, but bearing in mind we have yet to get the final figures on tariffs, and in turn yet to feel its full impact once they are finally set in stone. We heard from a few FOMC (Federal Open Market Committee) members, Williams that it’s “entirely appropriate” to maintain their “modest restrictive stance of monetary policy”, and Barkin that many firms are still trying to pass on price increases but there are “consumers who are exhausted by inflation, who are already trading down”. Looking at the latest ‘Beige Book’ out of the Federal Reserve (Fed), and it showed less mention of uncertainty compared to June but a larger belief in higher prices coming due to tariffs, with many firms passing on “at least a portion of cost increases to consumers through price hikes or surcharges, although some held off raising prices because of customers’ growing price sensitivity, resulting in compressed profit margins”.
But where the Fed and many of its members see inflation going and their preference for a hold on policy is one thing, while the preference for US President Trump is for lowering interest rates sizably and sooner rather than later. There has been much talk (and posts) regarding Fed Chairman Powell from Trump, but the rumors yesterday regarding that he would “likely” fire Powell soon only for him to deny it afterwards gave markets a jolt.
The initial report combined with lighter pricing data helped gold prices move higher yesterday (see below regarding who won out on the strategic front) with the greenback in retreat on the FX front, only for nearly all its gains to be undone as of writing this morning once the dust settled and the reports proved false.
As for today, more pricing data via export and import price indices, the weekly claims, and focus on the US consumer with retail sales for the month of June. Expectations are for a small increase and so too for its core reading, and follows contraction back in May. Keep in mind the figures aren’t adjusted for inflation. A few FOMC members will also be speaking where one has been talking of a possible rate cut when they meet later this month, but market pricing (CME’s FedWatch) is nearly fully pricing in a hold with slight majority odds of a 25bp (basis point) cut in September.
Gold’s technical overview, strategies and levels
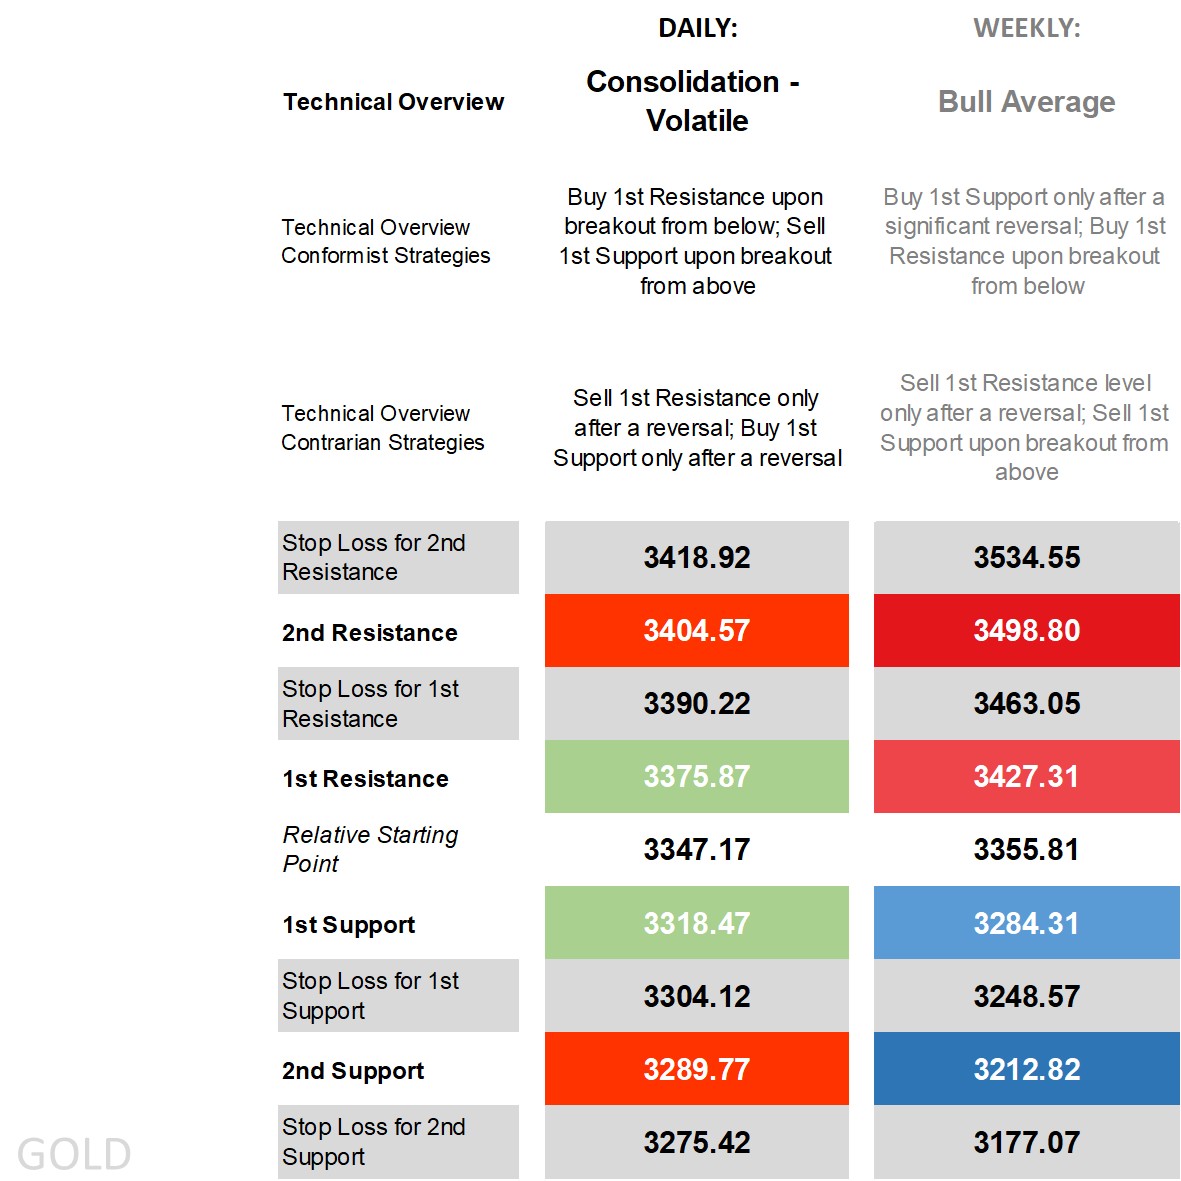
Looking at the technicals on the weekly time frame, and it was and remains ‘bull average’ with price working within a long-term bull trend channel and a couple key technical indicators still green. Zooming into the daily time frame and the story isn’t as bullish even if price is above all its main moving averages (as of yesterday’s close) and price working within a much smaller and shorter bull trend channel.
The moves yesterday gave conformist buy-breakout strategies the edge on the initial rumor of Fed Chair Powell with price moving beyond its previous 1st Resistance level and its stop loss before pulling back and triggering sell-after-reversal strategies for contrarian strategists. Fading strategies are naturally avoided in times of an uptick in volatility as they are more prone to getting stopped out.
As for the daily time frame’s technical overview? Tempting as it may be to label it something bullish with price above key moving averages, when combined with other indicators like an RSI (Relative Strength Index) in the middle, price in the middle of narrow Bollinger Bands, a non-trending ADX (Average Directional Movement Index), and an inconclusive DMI (Directional Movement Index) with the +DI slightly below the -DI, and it’s closer to ‘consolidation – volatile’. That keeps breakout strategies in the conformist camp even if intraday fails to provide the necessary follow-through, and usually requires an additional session (or two) to give buy- or sell-breakouts the edge over contrarian reversal strategies.
Capital.com’s client sentiment for Gold
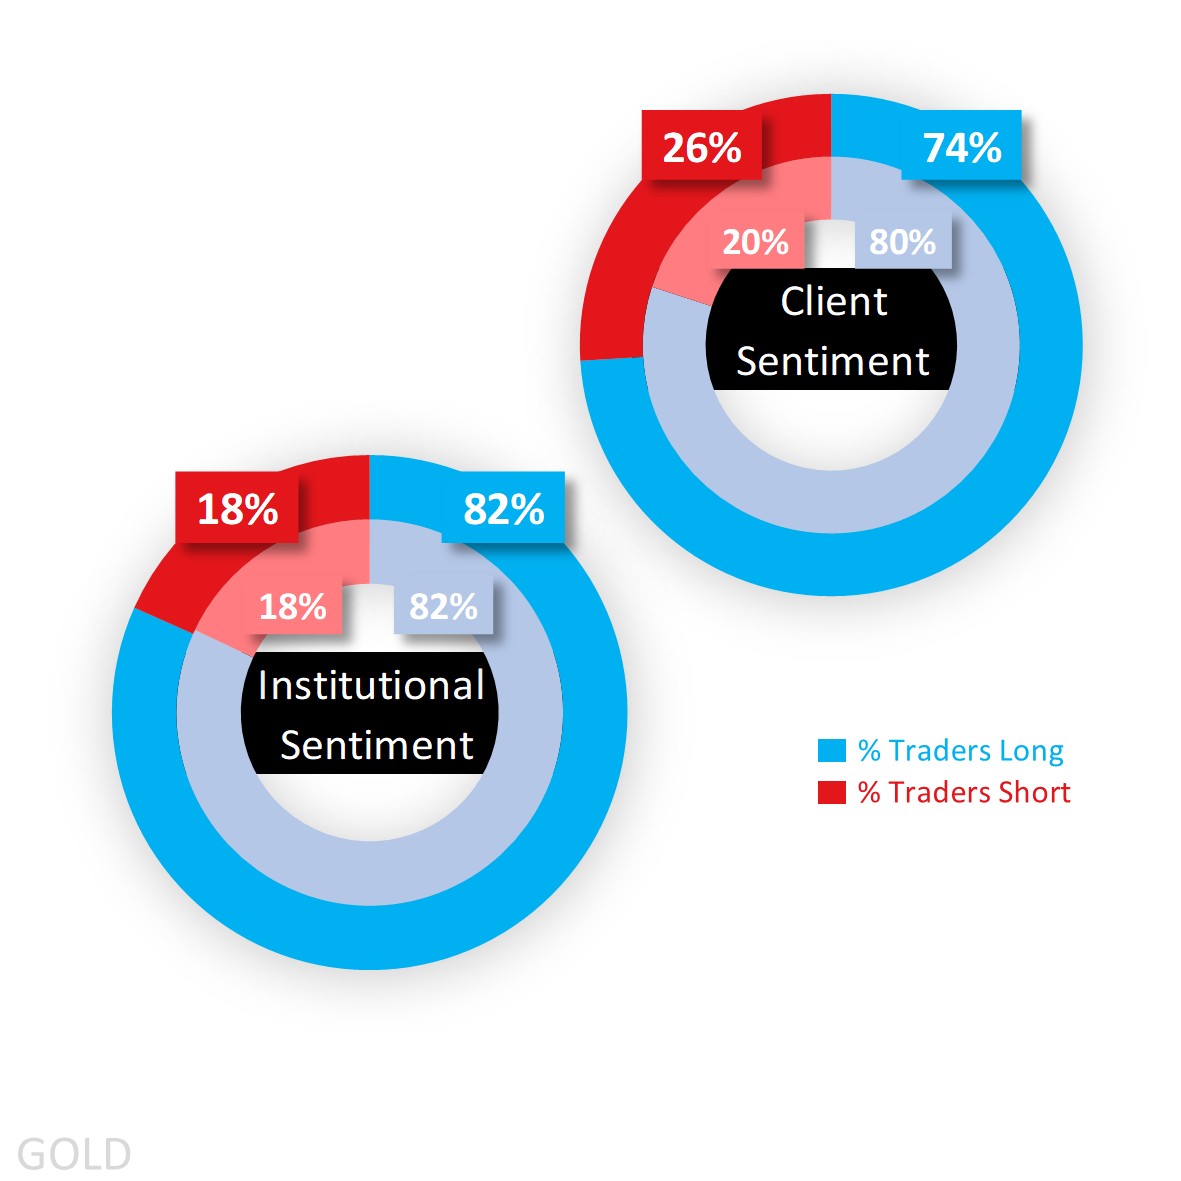
In terms of sentiment, it’s been a story of majority buy bias among clients for ages now, much of it in heavy to extreme buy territory. They might have been extreme buy 80% yesterday, but the pop higher enticed some longs into closing out and some shorts into entering reducing that buy sentiment to a (still heavy) 74% as of this morning. The pullback that followed has taken it closer to 77% as of writing as fresh shorts get further enticed to close out.
As for CoT (Commitment of Traders) speculators, they remain extreme buy and holding at 82% according to the latest report out of the CFTC, with the increase in longs (by 3,054 lots) larger than the increase in shorts (by 2,066) but not enough to move the needle in percentage terms.
Client sentiment mapped on the daily chart
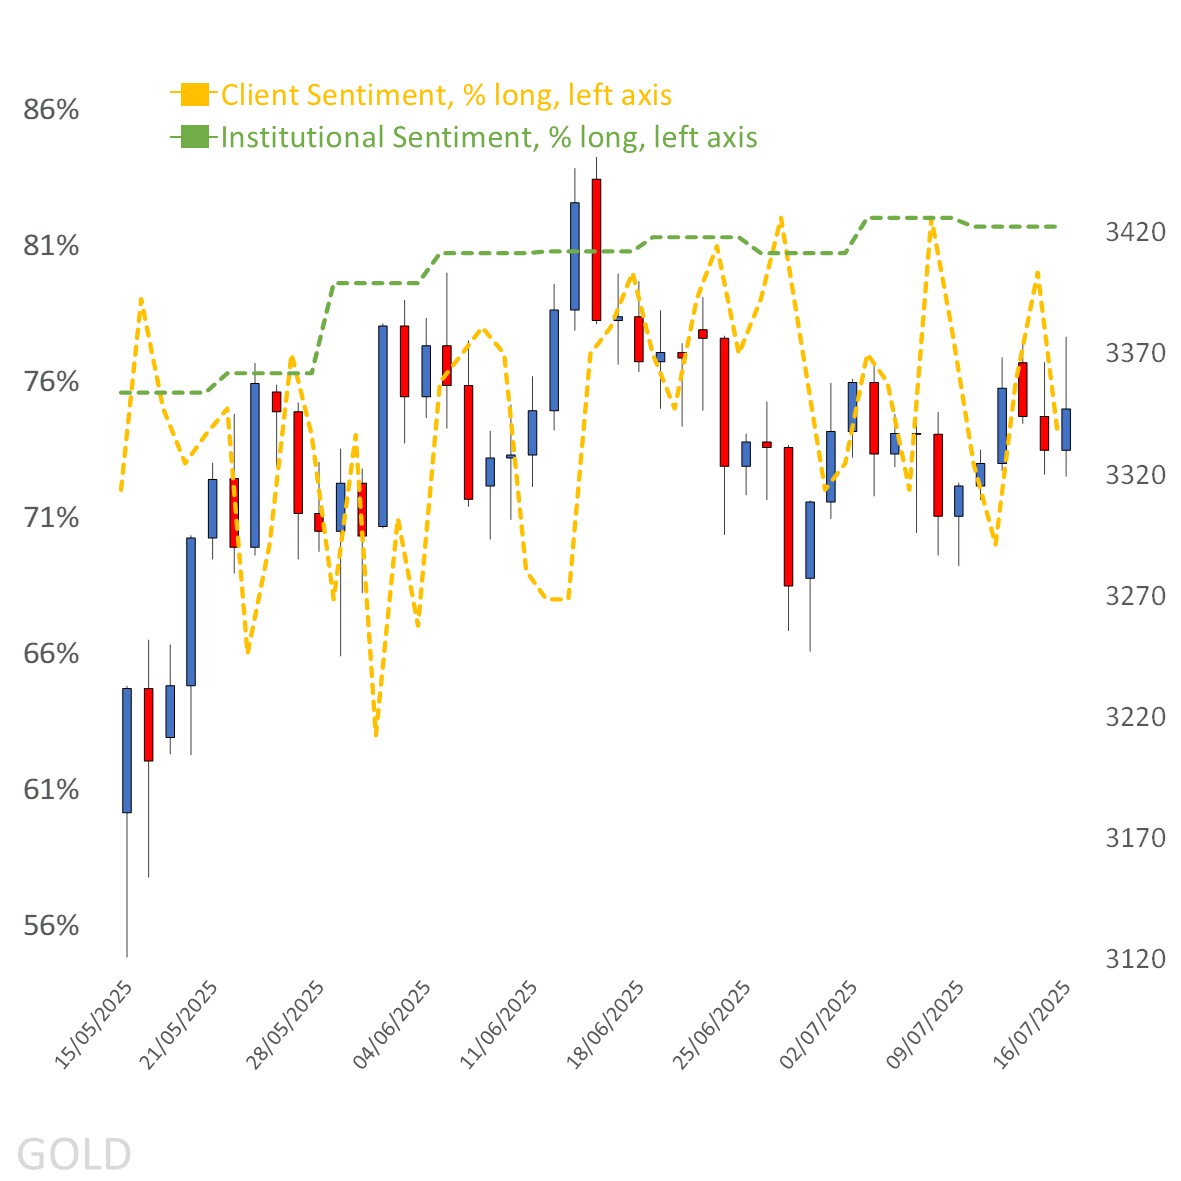
Source: Capital.com
Period: May 2025 – July 2025
Past performance is not an indicator of future results.
Gold’s chart on Capital.com platform with key technical indicators
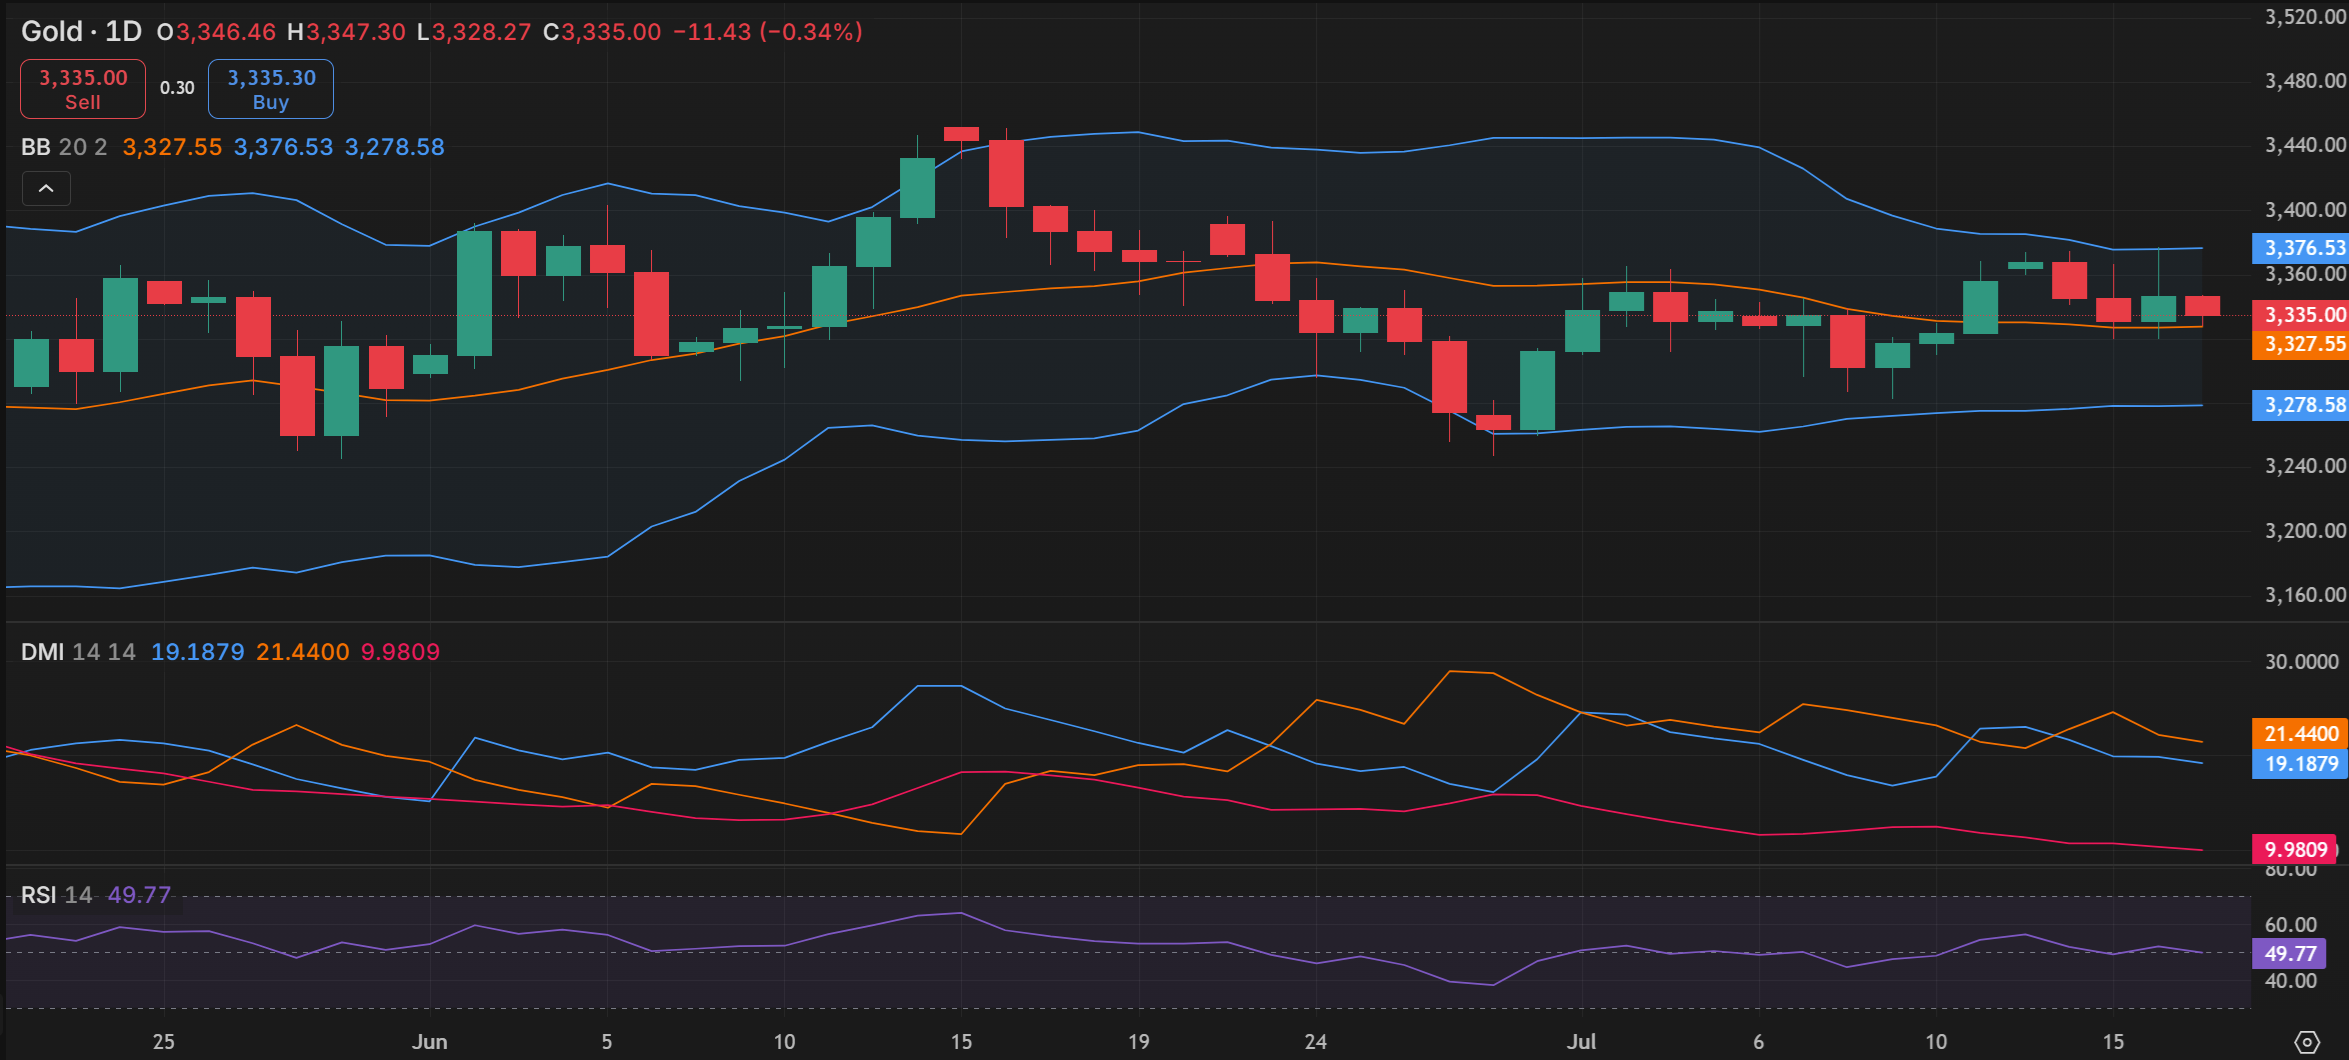
Source: Capital.com
Period: May 2025 – July 2025
Past performance is not an indicator of future results.
Read more: Gold price forecast 2025: Third-party targets
RISK DISCLAIMER
CFDs are complex instruments and come with a high risk of losing money rapidly due to leverage. 82.12% of retail investor accounts lose money. You should consider whether you understand how CFDs work and whether you can afford to take the high risk of losing your money.
Past performance is no guarantee of future results. Professional clients can lose more than they deposit. All trading involves risk.
RESEARCH DISCLAIMER
THE PRESENT MATERIAL MUST BE REGARDED AS MARKETING COMMUNICATION AND SHOULD NOT BE INTERPRETED AS INVESTMENT RESEARCH OR INVESTMENT ADVICE.
The content of this communication has been prepared solely for information purposes and should be considered as such. This communication does not constitute research in accordance with the legal requirements designed to promote investment research independence. While the information in this communication, or on which this communication is based, has been obtained from sources that Capital.com believes to be reliable and accurate, it has not undergone independent verification. No representation or warranty, whether expressed or implied, is made as to the accuracy or completeness of any information obtained from third parties.
The information provided as at the date of this communication is subject to change without prior notice. It does not take into consideration the investors’ individual circumstances or objectives and should not be construed as specific advice on the suitability of any investment decision. Investors should consider this report as merely one factor in making any investment decisions. To the extent permitted by law, neither Capital.com nor any of its employees or affiliates accept any liability whatsoever for any direct or consequential loss arising, directly or indirectly, from any use of this communication or its contents. Any person acting on the information does so entirely at their own risk. Any information that may be provided in this communication relating to past performance is not a reliable indicator of future results or performance.
Capital Com Online Investments Ltd is a limited liability company with company number 209236B. Capital Com Online Investments Ltd is a Company registered in the Commonwealth of The Bahamas and authorised by the Securities Commission of The Bahamas with license number SIA-F245. The Company’s registered office is at #3 Bayside Executive Park, Blake Road and West Bay Street, P. O. Box CB 13012, Nassau, The Bahamas.