Trading the Dow: Earnings steal the show
The value of the key US equity index lagged last week against those with heavier tech weightings, but its technical overview remains bullish and still a story of net long bias for CoT speculators.
It might have been a story of gains and record highs for both the S&P 500 (w/w +0.7% to 6,296) and the tech-heavy Nasdaq 100 (w/w +1.3% to 23,065), but the Dow (w/w -0.01% to 44,342) ended flat failing to take advantage of what was a decent charge on the tech front. Earnings season is under way. So far, of those companies within the S&P 500 who have reported their figures for the second quarter of this year, for over 80% of them it’s been a story of beating estimates which is above the average we’re used to seeing. That’s considered a plus in terms of risk appetite and keeping market participants both happy and interested in equities, but they’re no doubt keeping an eye on the August 1 “hard deadline” that Commerce Secretary Lutnick referred to as it nears, and where Friday was a story of a slight pullback with the FT saying US President Trump wants a minimum 15-20% tariffs on EU imports.
Economic data has generally impressed out of the US lately, with last week’s CPI (Consumer Price Index) lighter than forecast for its core, lighter throughout for PPI (Producer Price Index), and consumer inflation expectations falling back according to the preliminary figures out of UoM (University of Michigan). Where data needed to be stronger such as retail sales and housing data managed to deliver, in all a good package for those noting macroeconomic factors. The problem – and it’s been the case for quite some time – is the reliance on such data with what’s to come, especially surrounding uncertainty on how tariffs will impact future readings. We heard from the Federal Reserve’s (Fed) Goolsbee that they’ll “need some resolution” on tariffs “that we can count on before we can fully understand what the impact of this is”, and market pricing (CME’s FedWatch) is about 60/40 on a rate cut in September with similar likelihoods for a second cut in December.
Week ahead: more earnings, preliminary PMIs and durables data
As for the week ahead, it’s a quiet start with little to get excited about out of the US when looking at the economic calendar. The Richmond Fed’s manufacturing index is tomorrow with a couple FOMC (Federal Open Market Committee) members speaking including Chairman Powell, the weekly mortgage applications on Wednesday followed by existing home sales, the weekly claims and preliminary PMIs (Purchasing Managers’ Index) on Thursday surrounded by a couple Fed activity indices, and durables data on Friday.
Aside from any updates on the trade front ahead of next Friday’s deadline means the attention will remain on earnings and includes two of the magnificent seven with both Alphabet (Google) and Tesla on Wednesday. Neither are components of the Dow 30 even if they’ll sway their respective communication and discretionary sectors, but companies including Honeywell, IBM, and Coca-Cola are, and they’ll be releasing their figures this week as well.
Dow’s technical overview, strategies and levels
Looking at the daily time frame and price is still above its main long-term moving averages, with a DMI (Directional Movement Index) that’s positive given the healthy margin of the +DI over the -DI, and a trending ADX (Average Directional Movement Index). But looking at the remaining key indicators and they’re somewhat neutral with price near the middle of very narrow Bollinger Bands as oscillations cause indicators to huddle, and with an RSI (Relative Strength Index) over 50 but far off overbought territory. There’s also the matter of the short-term wide bear channel.
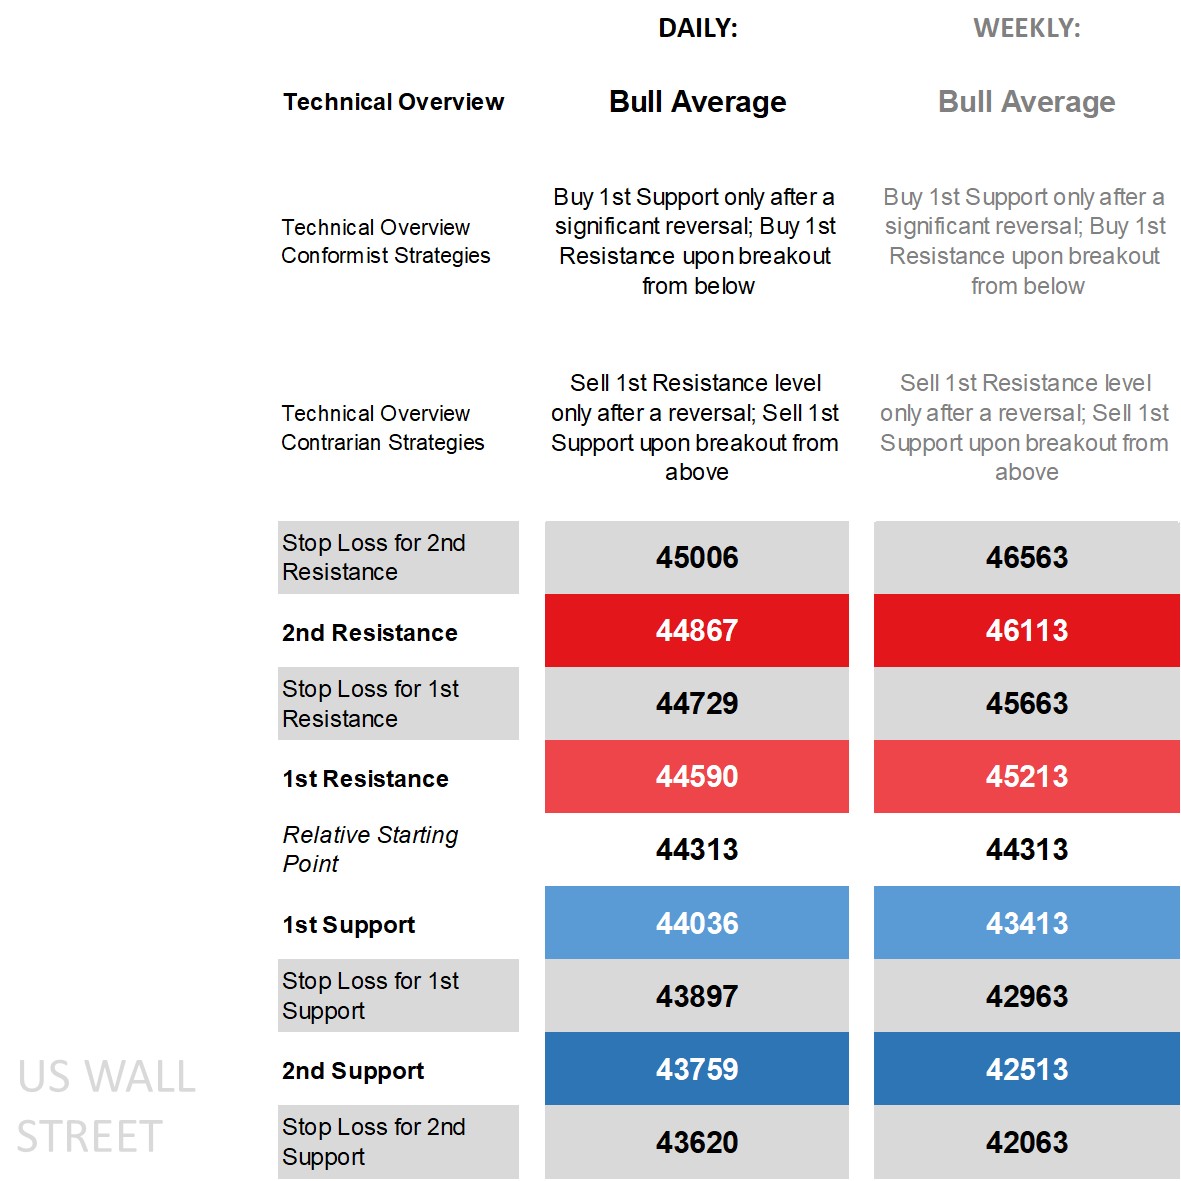
The moves as of late makes it feel more consolidatory than anything when summing up its technical overview, but you don’t need to look that far back to see that the run late in June has helped keep technical indicators signifying a more ‘bull average’, and so too on the weekly time frame as price nears a mid-term resistance level which coincides with its record high. Buy strategies are in the conformist camp be it going for a breakout off the 1st Resistance or after a significant reversal off the 1st Support noting key levels to the downside. Those who see the overview struggling at these levels can look to contrarian strategies where it’s a sell-after-reversal off the 1st Resistance (whether daily for intraday traders or weekly for interday ones) or going for a sell-breakout off the 1st Support.
Capital.com’s client sentiment for Dow
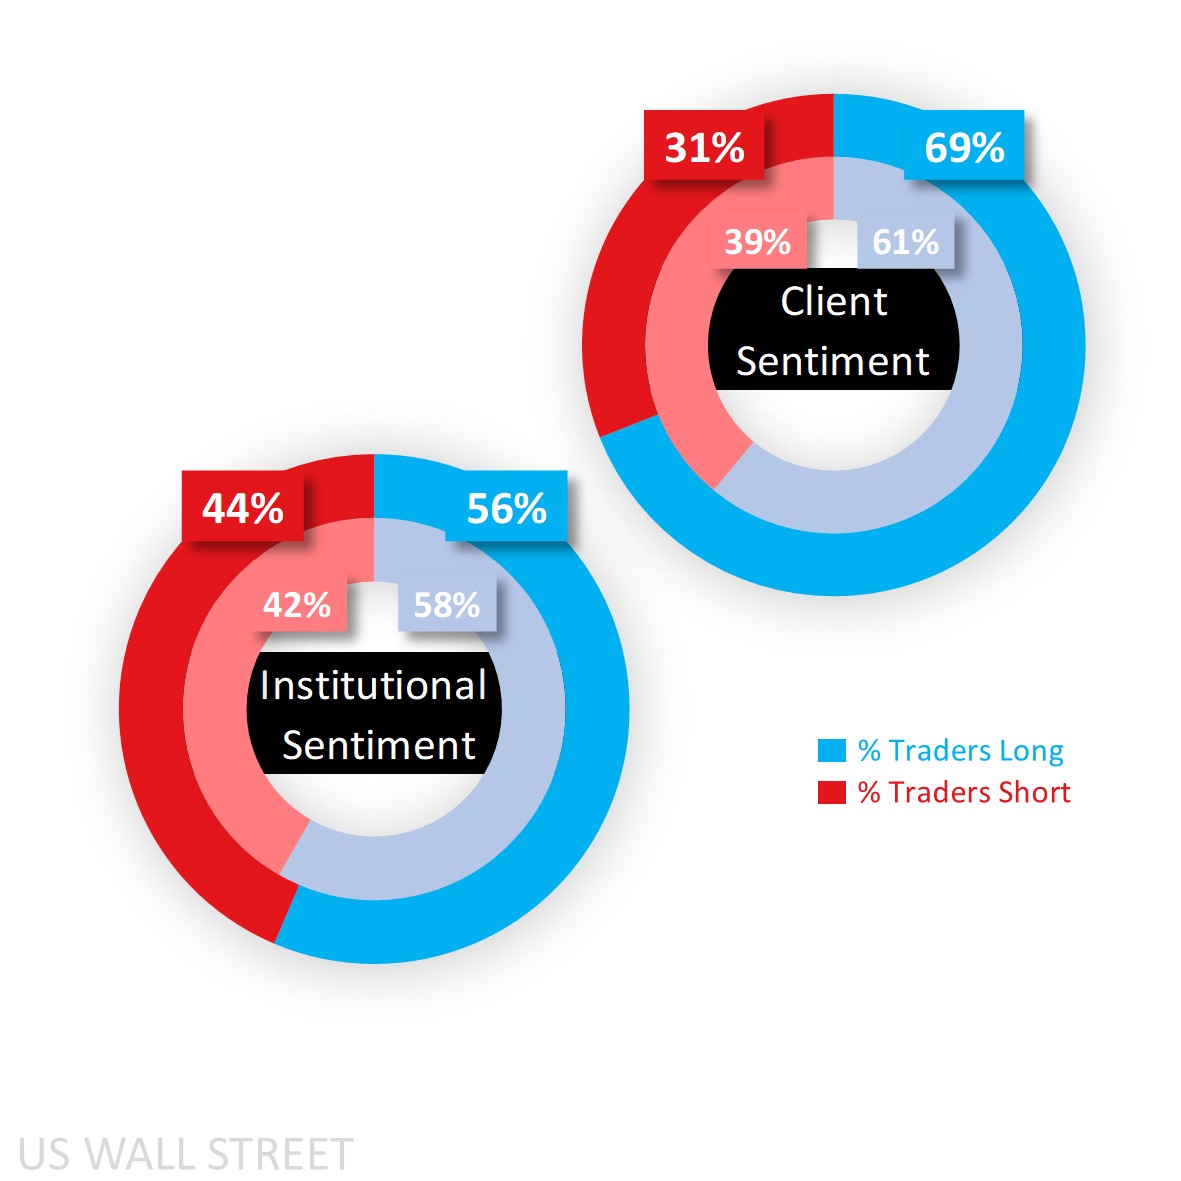
As for sentiment, clients on our end remain majority buy and have upped that bias to a heavier 69% as range-trading picks up and longs look for an excuse to get back in after notably unwinding their buy sentiment last month.
CoT speculators are also majority buy with a net long 56% bias, but it has dropped and not risen following the latest moves from 58% due to an increase in longs (by 399 lots) that was outdone by a larger rise in shorts (by 1,170).
Client sentiment mapped on the daily chart
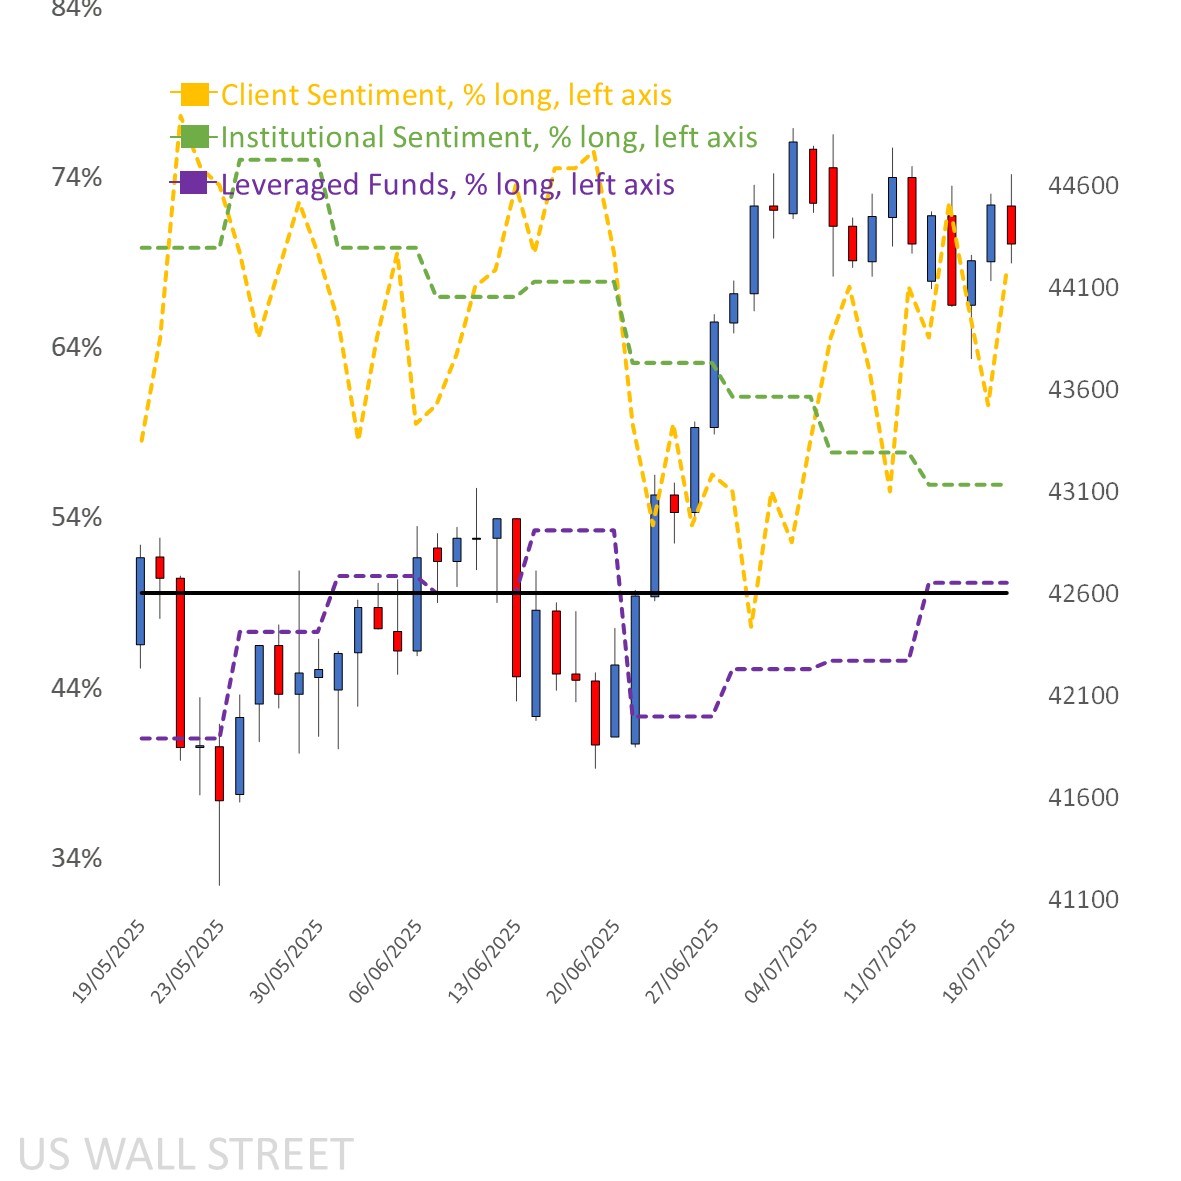
Source: Capital.com
Period: May 2025 – July 2025
Past performance is not an indicator of future results.
Dow’s chart on Capital.com platform with key technical indicators
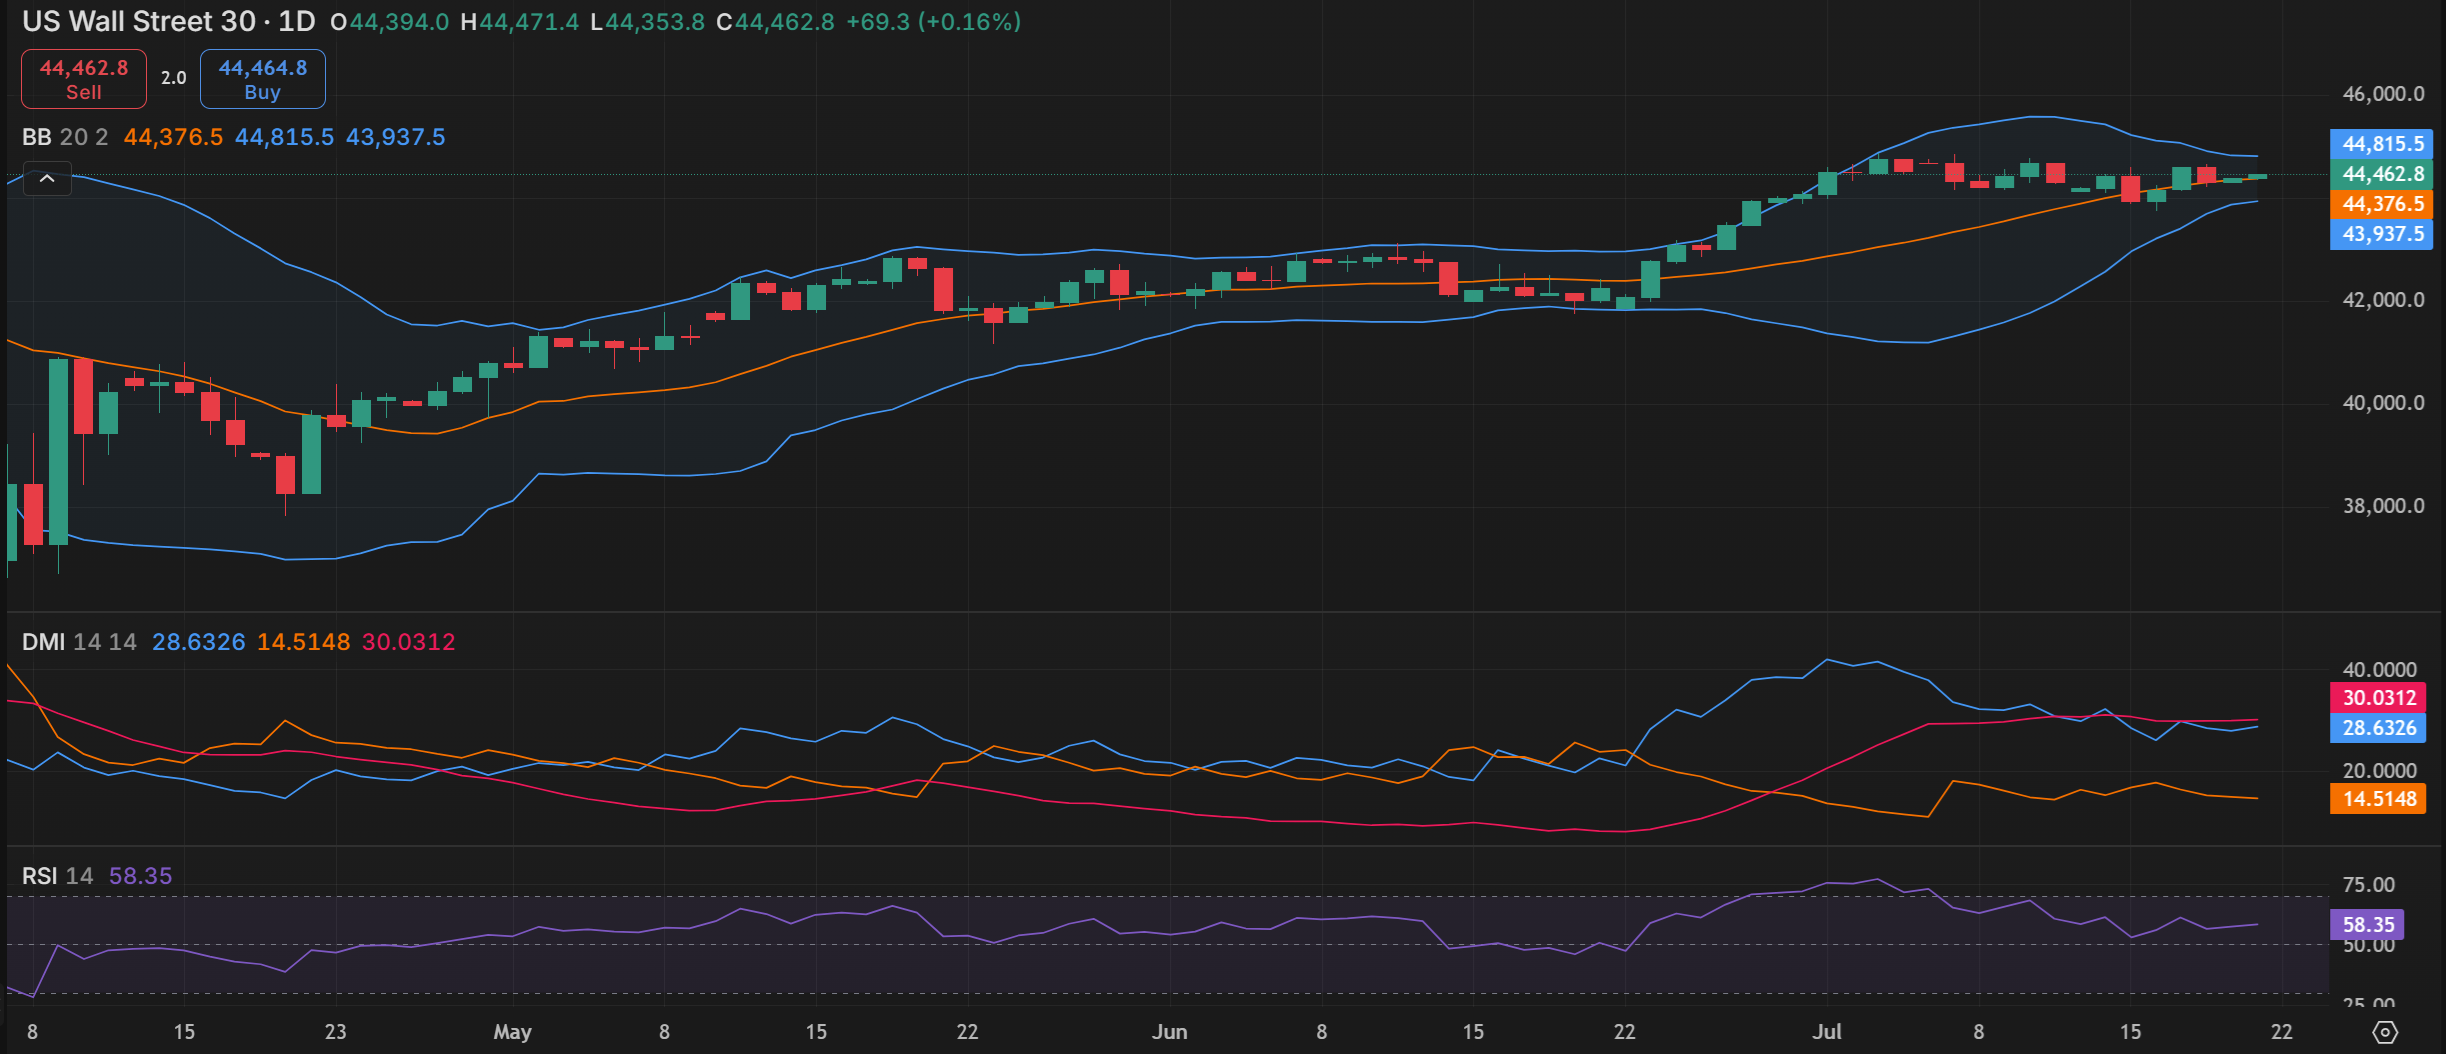
Source: Capital.com
Period: April 2025 – July 2025
Past performance is not an indicator of future results.
RISK DISCLAIMER
CFDs are complex instruments and come with a high risk of losing money rapidly due to leverage. 82.12% of retail investor accounts lose money. You should consider whether you understand how CFDs work and whether you can afford to take the high risk of losing your money.
Past performance is no guarantee of future results. Professional clients can lose more than they deposit. All trading involves risk.
RESEARCH DISCLAIMER
THE PRESENT MATERIAL MUST BE REGARDED AS MARKETING COMMUNICATION AND SHOULD NOT BE INTERPRETED AS INVESTMENT RESEARCH OR INVESTMENT ADVICE.
The content of this communication has been prepared solely for information purposes and should be considered as such. This communication does not constitute research in accordance with the legal requirements designed to promote investment research independence. While the information in this communication, or on which this communication is based, has been obtained from sources that Capital.com believes to be reliable and accurate, it has not undergone independent verification. No representation or warranty, whether expressed or implied, is made as to the accuracy or completeness of any information obtained from third parties.
The information provided as at the date of this communication is subject to change without prior notice. It does not take into consideration the investors’ individual circumstances or objectives and should not be construed as specific advice on the suitability of any investment decision. Investors should consider this report as merely one factor in making any investment decisions. To the extent permitted by law, neither Capital.com nor any of its employees or affiliates accept any liability whatsoever for any direct or consequential loss arising, directly or indirectly, from any use of this communication or its contents. Any person acting on the information does so entirely at their own risk. Any information that may be provided in this communication relating to past performance is not a reliable indicator of future results or performance.
Capital Com Online Investments Ltd is a limited liability company with company number 209236B. Capital Com Online Investments Ltd is a Company registered in the Commonwealth of The Bahamas and authorised by the Securities Commission of The Bahamas with license number SIA-F245. The Company’s registered office is at #3 Bayside Executive Park, Blake Road and West Bay Street, P. O. Box CB 13012, Nassau, The Bahamas.