Trading the DAX 40 following the US-EU trade deal
Weekend gap gets filled as initial euphoric move faces a bit of turbulence, in all keeping its technical overview unchanged in both daily and weekly time frames.
The weekend trade deal between the US and the EU has no doubt removed a chunk of uncertainty from the financial markets, as market participants look beyond the handshake and delve into the details of what the agreement encompasses. It came before the August 1 deadline, and instead of the planned 30% tariffs on EU imports into the US will be a lower 15% instead. It’s not the 10% (or no tariffs) some in the bloc had hoped for, and 50% tariffs will remain on steel and aluminum. There’s also the matter of $750bn on US energy purchases over the next few years and an additional $600bn in investment, as traders await updates on how those costs will be borne and the extent to which it could impact the euro (retreating as of writing making quick work of the weekend gap higher), spending, and growth in the EU. Market reaction so far is a bit telling, with European equities initially faring better when compared to their US counterparts before giving up a larger percentage of those gains and underperforming.
Week ahead
And while the attention will be on the US-EU trade agreement, you can expect the attention in the financial markets to shift quite considerably over the course of the week. US-China talks in Stockholm are scheduled for Monday ahead of the August 12 deadline to see if they can get a trade truce extension. Then comes the slew of items on the economic calendar with central bank policy decisions out of the Federal Reserve (Fed) and Bank of Canada on Wednesday both expected to hold on rates, and the Bank of Japan on Thursday expected to do the same. Economic data is plentiful, out of the US advance GDP (Gross Domestic Product) on Wednesday, PCE (Personal Consumption Expenditures) Price Index on Thursday, and the market-moving Non-Farm Payrolls on Friday.
For the Eurozone, we’ve got preliminary GDP tomorrow expected to show 0.1% contraction for Germany but flat for the bloc, preliminary CPI (Consumer Price Index) for Germany on Thursday followed by labor data, and both manufacturing PMI and EZ preliminary pricing data on Friday.
Earnings will take a big chunk of the attention in the US given four of the ‘magnificent seven’ will be releasing their figures (Microsoft, Apple, Amazon, and Meta), but there are also components of the DAX 40 who will be showcasing their quarterly numbers including Siemens Healthineers, Merecedes-Benz, BMW, Porsche, and Adidas.
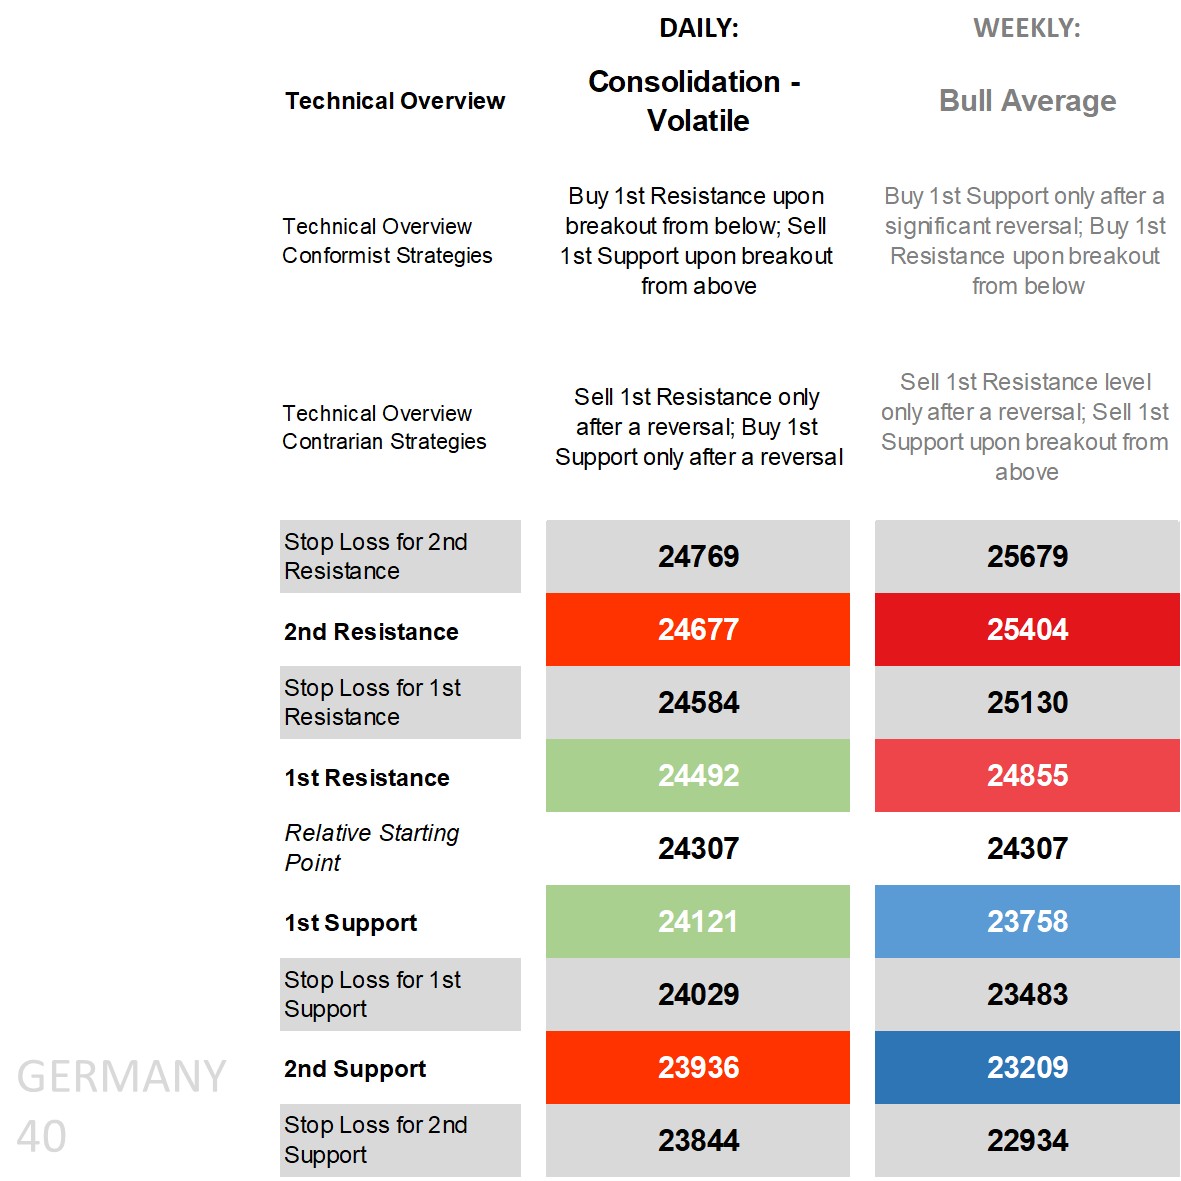
DAX 40’s technical overview, strategies and levels
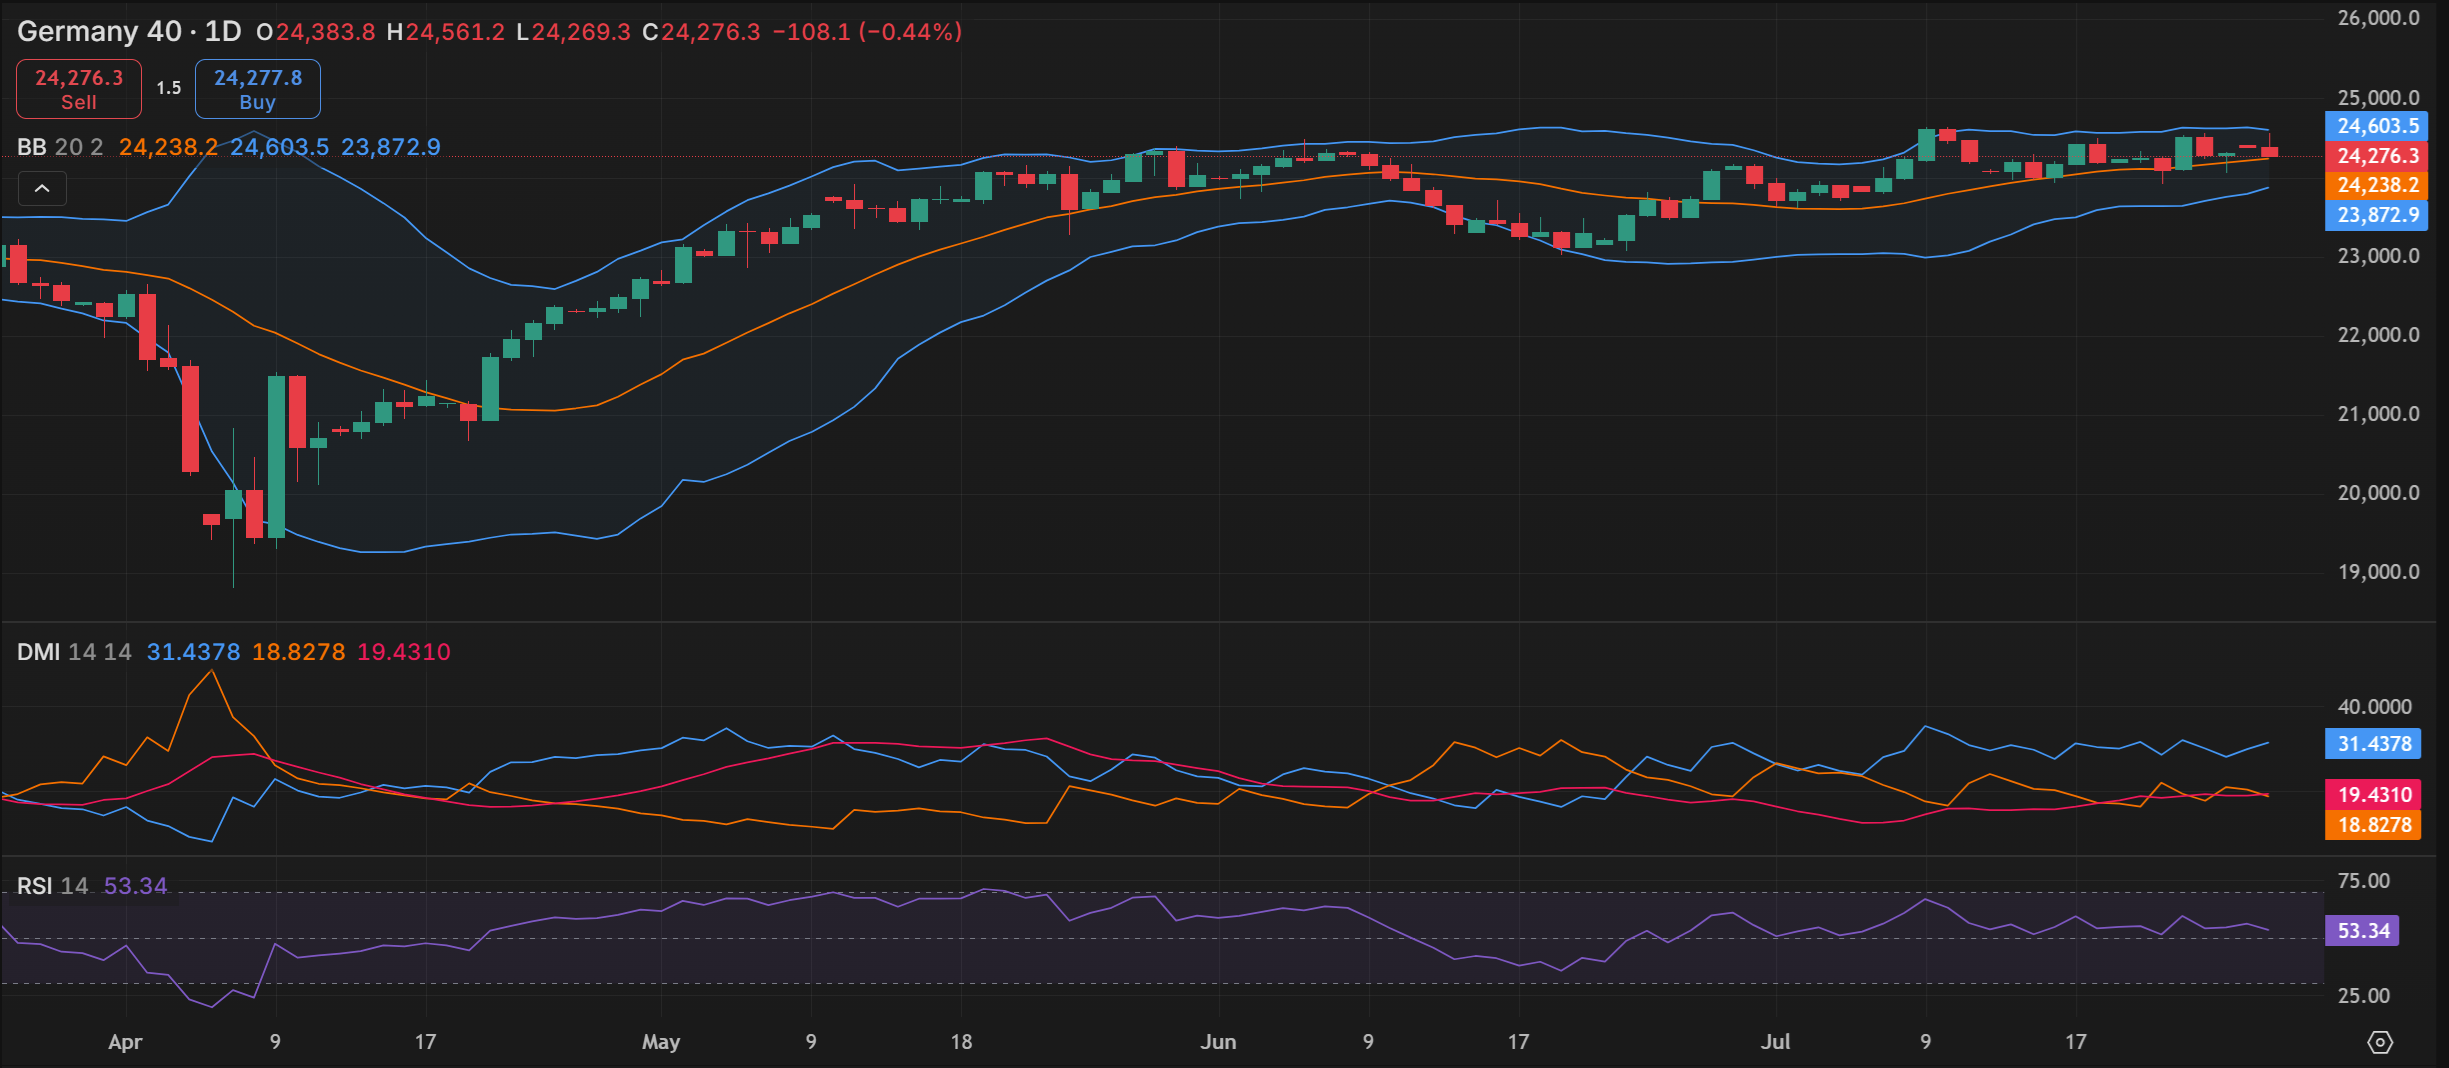
Even after the gap higher and it has yet to cause a real shift in the technical overview on the daily time frame. Price might have made it above all its main moving averages and briefly neared the top of what have been narrowing Bollinger Bands, but most of the remaining technical indicators are neutral with an RSI (Relative Strength Index) not too far off the 50 middle, an ADX (Average Directional Movement Index) not in trending territory just yet, and on the DMI (Directional Movement Index) front an advantage for the +DI over the -DI but carrying less weight in the current phase. It’s understandable to go for a ‘bull average’ or ‘stalling bull trend’ technical overview, but a slightly wider channel and mixed results combined with items on the fundamental front has kept it more ‘consolidation – volatile’ where breakout strategies are for conformists and reversals are for contrarians.
That means approaching the 1st Resistance going for a breakout strategy though at the top of the band given consideration for contrarian sell-after-reversal strategies only initiating after price retreats off the highs. And for the 1st Support going for a sell-breakout for those anticipating a move to the lower end of the channel (if not beneath it), with reversals buying only after price moves beneath it and manages to recover back to the key level.
As for the weekly time which incorporates more historic bullish bias, the overview is ‘bull average’ and means buy strategies (whether after a significant reversal off the weekly 1st Support level or via buy-breakout for the 1st Resistance) are considered conformist, while sell strategies (after a reversal off the weekly 1st Resistance level or via sell-breakout off the 1st Support) are for contrarians.
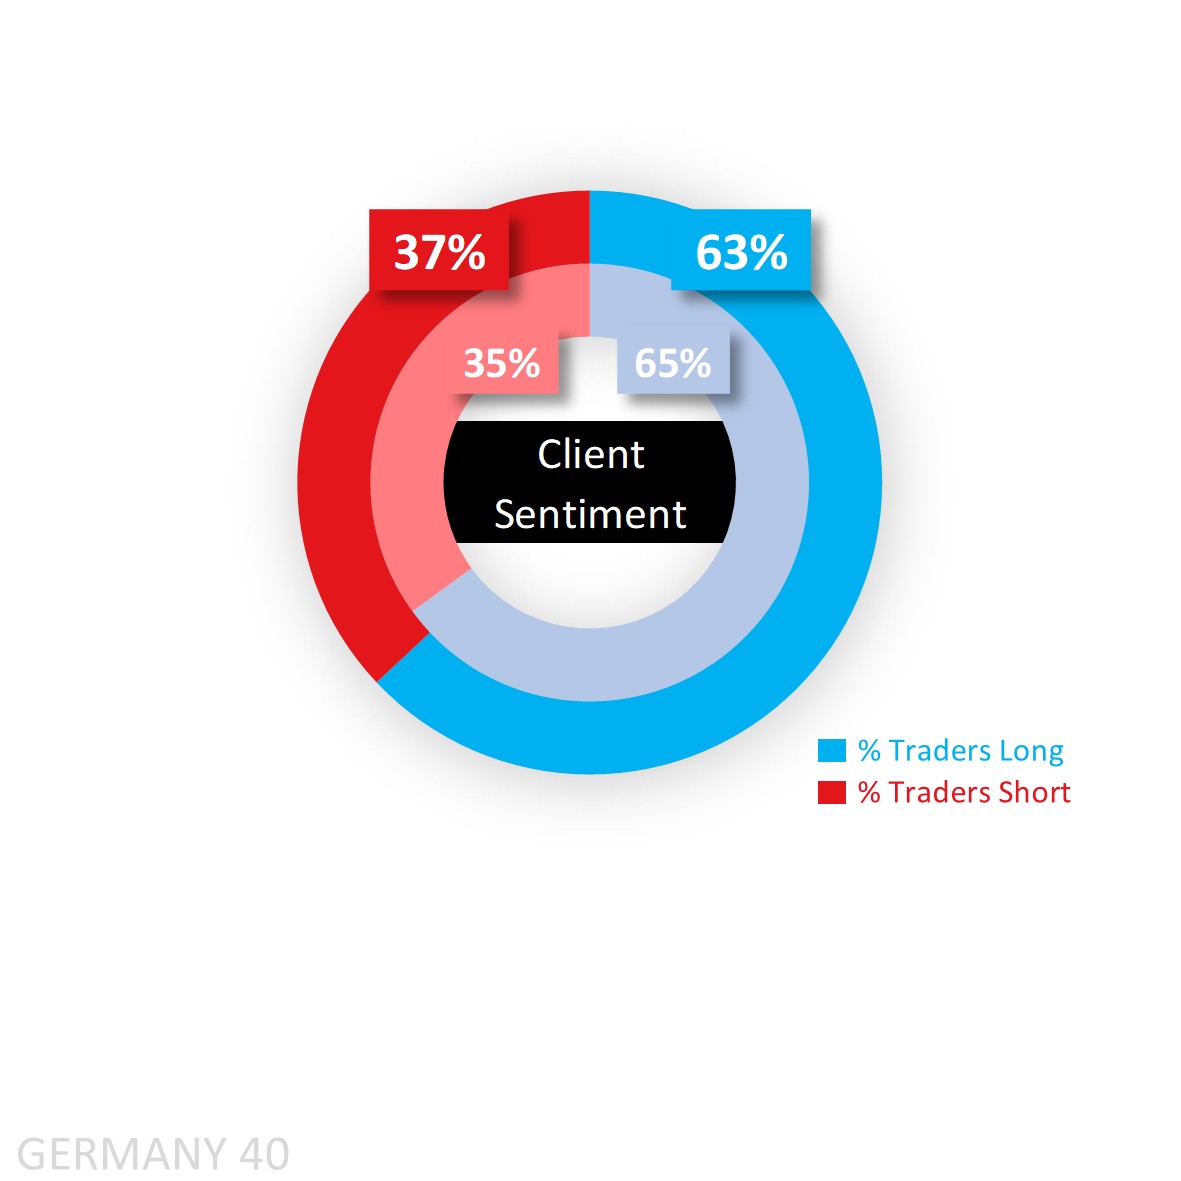
Capital.com’s client sentiment for DAX 40
In sentiment, clients on our end are still majority to the buy side but have fallen out of heavy long territory from 65% last Friday to 63% at the start of this week with much of that buy sentiment built off Thursday and Friday’s pullbacks. We don’t get figures from the CoT report (Commitment of Traders) for the DAX 40, but when it comes to key US equity indices they are net sell S&P 500 (64%) and Russell 2000 (70%) while net long Nasdaq (64%) and Dow (52%).
Client sentiment mapped on the daily chart
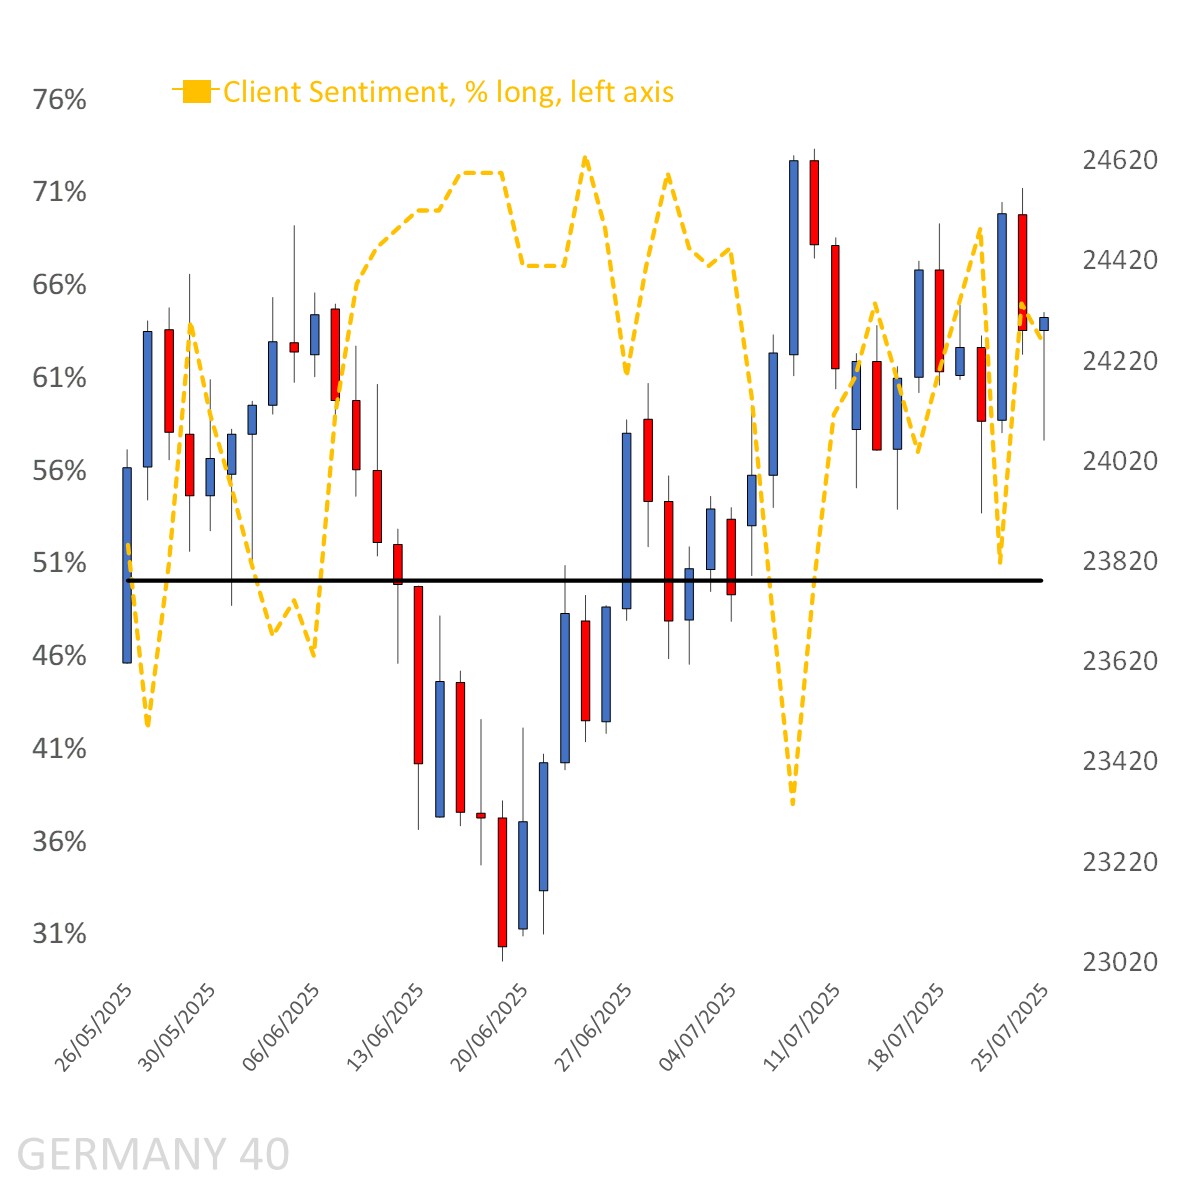
Source: Capital.com
Period: May 2025 – July 2025
Past performance is not an indicator of future results.
DAX 40’s chart on Capital.com platform with key technical indicators
 Source: Capital.com
Period: April 2025 – July 2025
Past performance is not an indicator of future results.
RISK DISCLAIMER
CFDs are complex instruments and come with a high risk of losing money rapidly due to leverage. 82.12% of retail investor accounts lose money. You should consider whether you understand how CFDs work and whether you can afford to take the high risk of losing your money.
Past performance is no guarantee of future results. Professional clients can lose more than they deposit. All trading involves risk.
RESEARCH DISCLAIMER
THE PRESENT MATERIAL MUST BE REGARDED AS MARKETING COMMUNICATION AND SHOULD NOT BE INTERPRETED AS INVESTMENT RESEARCH OR INVESTMENT ADVICE.
The content of this communication has been prepared solely for information purposes and should be considered as such. This communication does not constitute research in accordance with the legal requirements designed to promote investment research independence. While the information in this communication, or on which this communication is based, has been obtained from sources that Capital.com believes to be reliable and accurate, it has not undergone independent verification. No representation or warranty, whether expressed or implied, is made as to the accuracy or completeness of any information obtained from third parties.
The information provided as at the date of this communication is subject to change without prior notice. It does not take into consideration the investors’ individual circumstances or objectives and should not be construed as specific advice on the suitability of any investment decision. Investors should consider this report as merely one factor in making any investment decisions. To the extent permitted by law, neither Capital.com nor any of its employees or affiliates accept any liability whatsoever for any direct or consequential loss arising, directly or indirectly, from any use of this communication or its contents. Any person acting on the information does so entirely at their own risk. Any information that may be provided in this communication relating to past performance is not a reliable indicator of future results or performance.
Capital Com Online Investments Ltd is a limited liability company with company number 209236B. Capital Com Online Investments Ltd is a Company registered in the Commonwealth of The Bahamas and authorised by the Securities Commission of The Bahamas with license number SIA-F245. The Company’s registered office is at #3 Bayside Executive Park, Blake Road and West Bay Street, P. O. Box CB 13012, Nassau, The Bahamas.