Market Mondays: How Policy and Valuations Are Shaping the Year-End Trade
US equities struggle to capitalise on the dovish FOMC meeting as the AI valuation concerns resurface.
The Fed’s latest 25-basis-point rate cut landed broadly in line with expectations, but the market reaction has been anything but simple. The nuance lay in the vote split and the messaging: two FOMC members preferred to keep rates on hold, one pushed for a larger 50-basis-point cut, and the rest backed the consensus move. With fewer “no cut” dissenters than expected, markets initially read the outcome as mildly more dovish, sending yields and the dollar lower while equities and gold moved higher.
That first reaction was quickly complicated by Jerome Powell’s repeated comment that rates are now “very near neutral,” which many took as a signal that the cutting cycle may be nearing its end, perhaps with only one more move in early 2026. This sits uneasily with market pricing, which still implies more than one cut next year and a year-end policy rate near 3%. The Fed looks increasingly focused on softening labour conditions rather than inflation, but remains reluctant to commit to anything beyond gradual, data-dependent easing.
US dollar index (DXY) daily chart
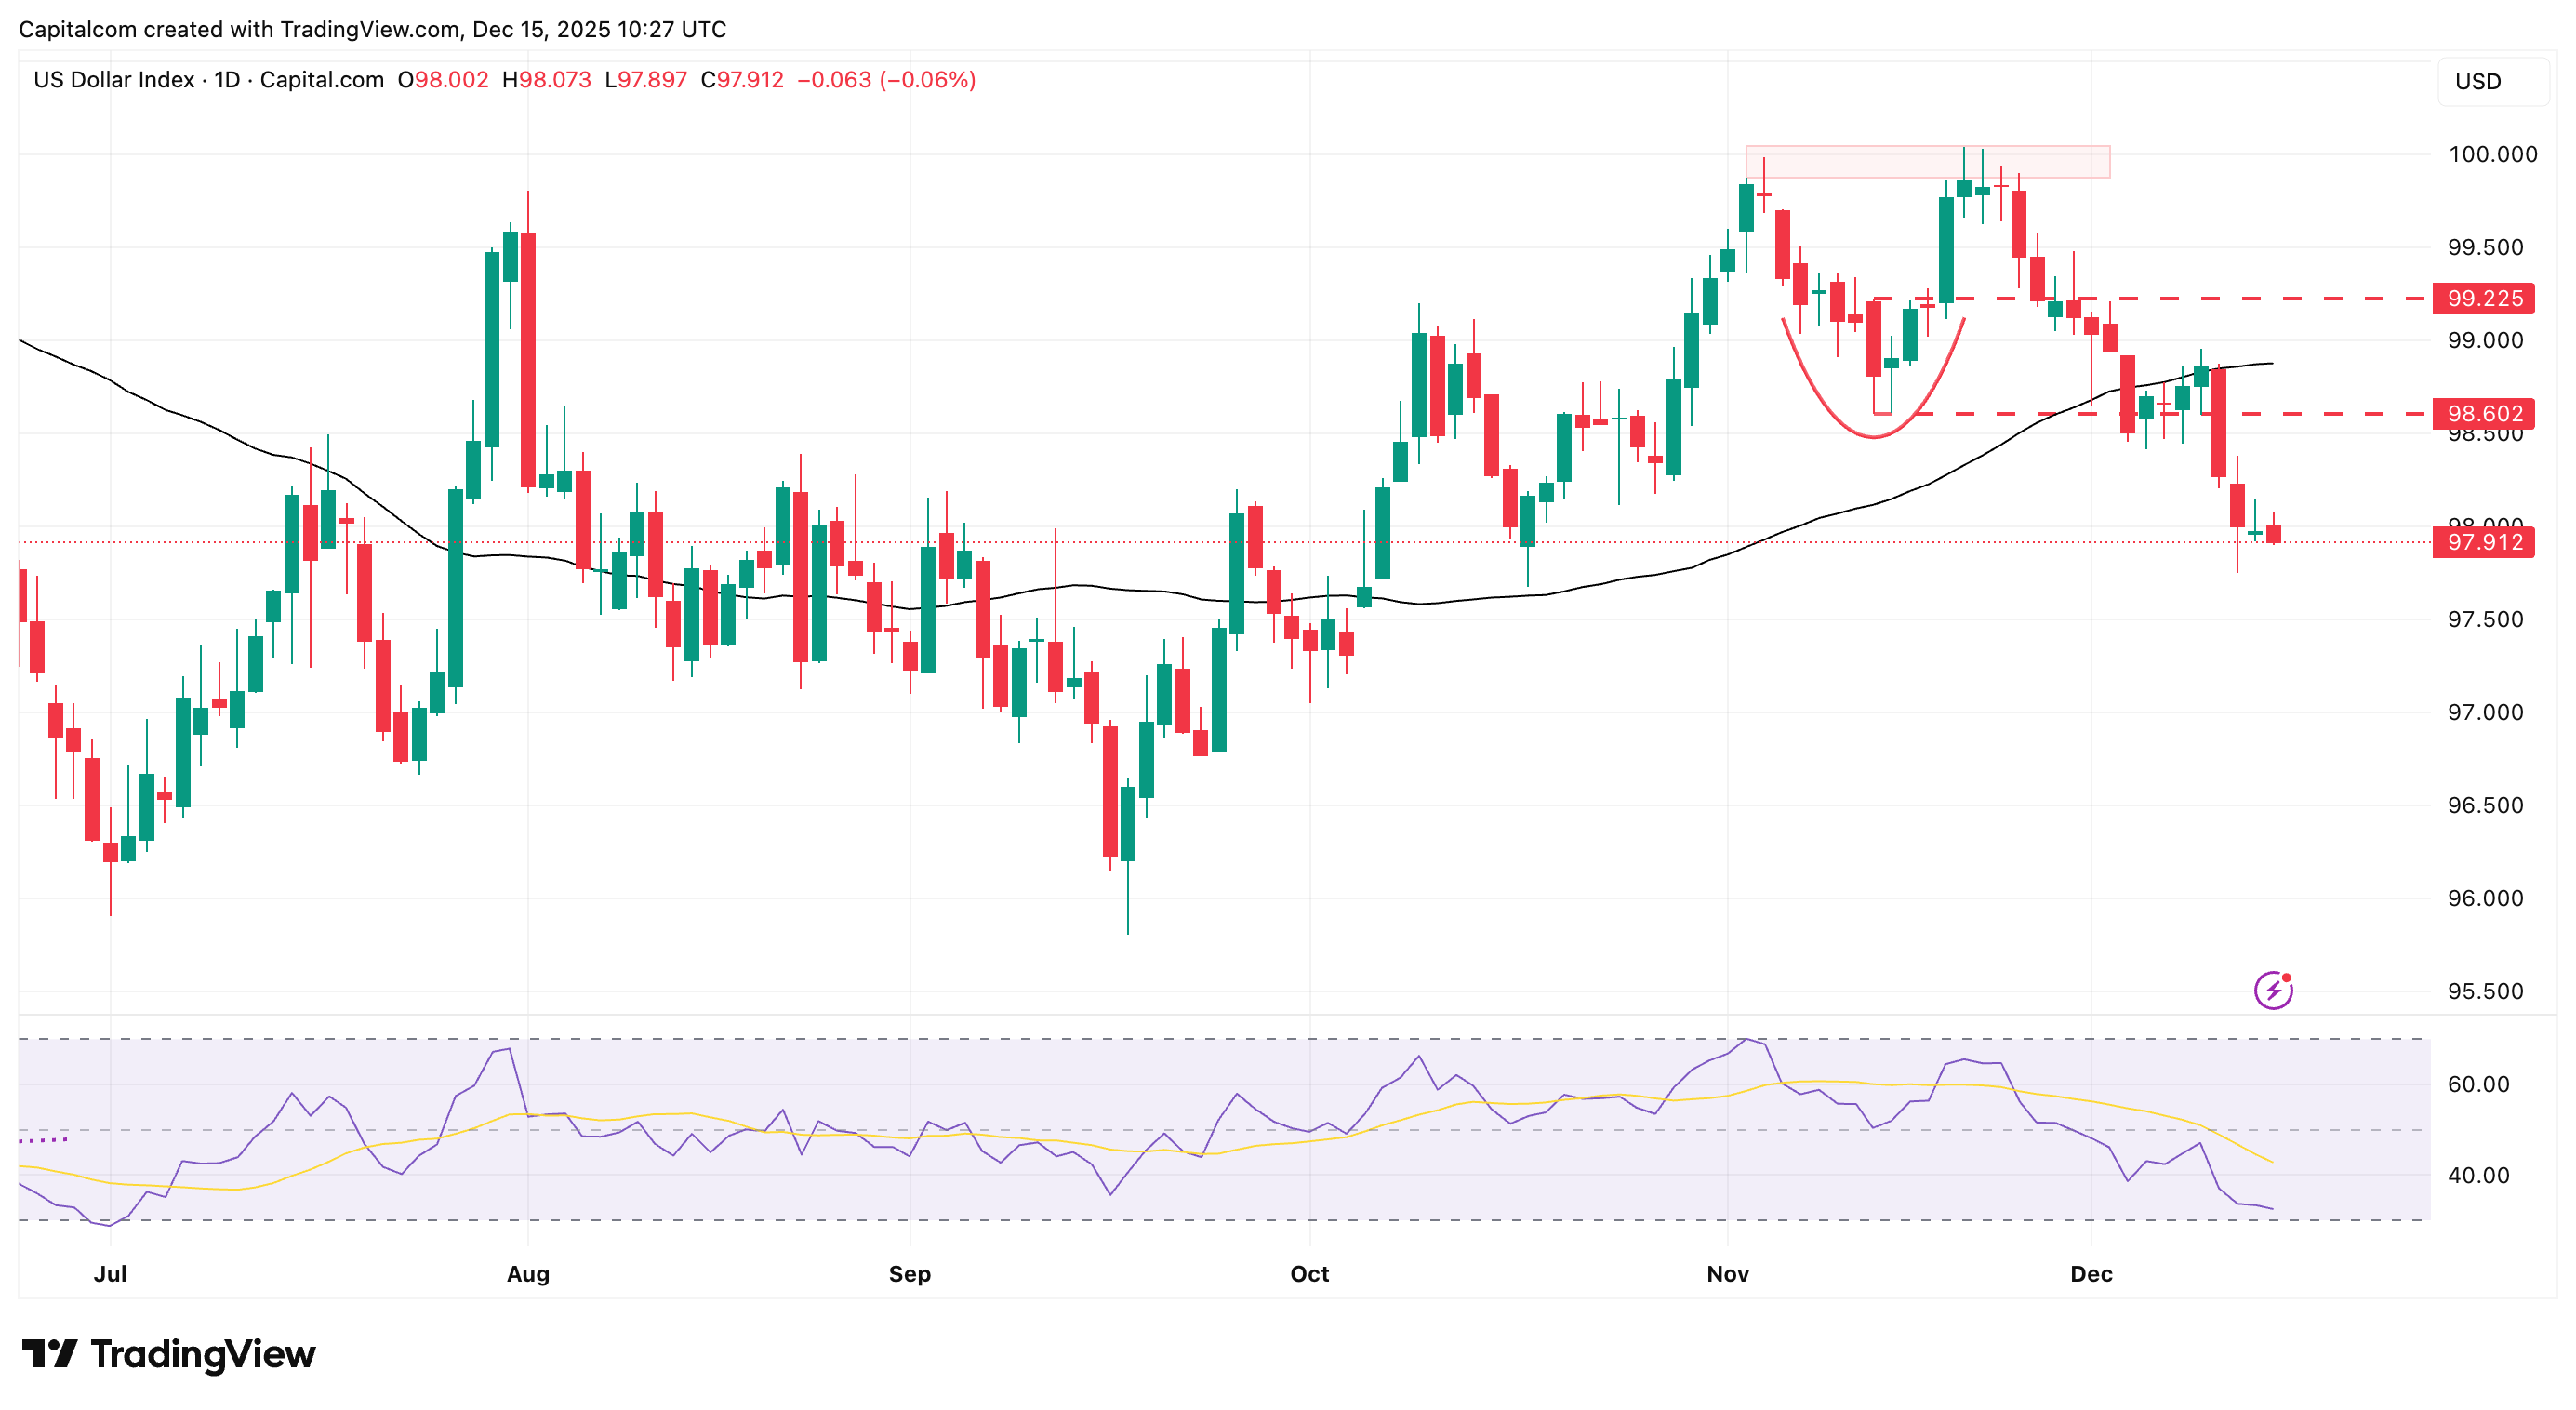
Past performance is not a reliable indicator of future results.
The Fed’s projections reinforce this delicate balance. For next year, the Summary of Economic Projections points to stronger growth, broadly steady unemployment and lower inflation, effectively leaning on an AI-driven productivity boost to allow the economy to “run hot” without reigniting price pressures. Equity markets are reflecting this tension: the S&P 500 is range-bound, the NASDAQ has failed to break to new highs, while the Dow and small caps have benefited from rotation into cyclical and value sectors. Investors remain cautious about stretched AI and mega-cap tech valuations and are broadening exposure ahead of 2026, with the key question now whether upcoming earnings – and real-world AI adoption – can validate current pricing. If productivity gains arrive later or weaker than hoped, both policy expectations and equity valuations are likely to face a reckoning.
Nasdaq 100 daily chart
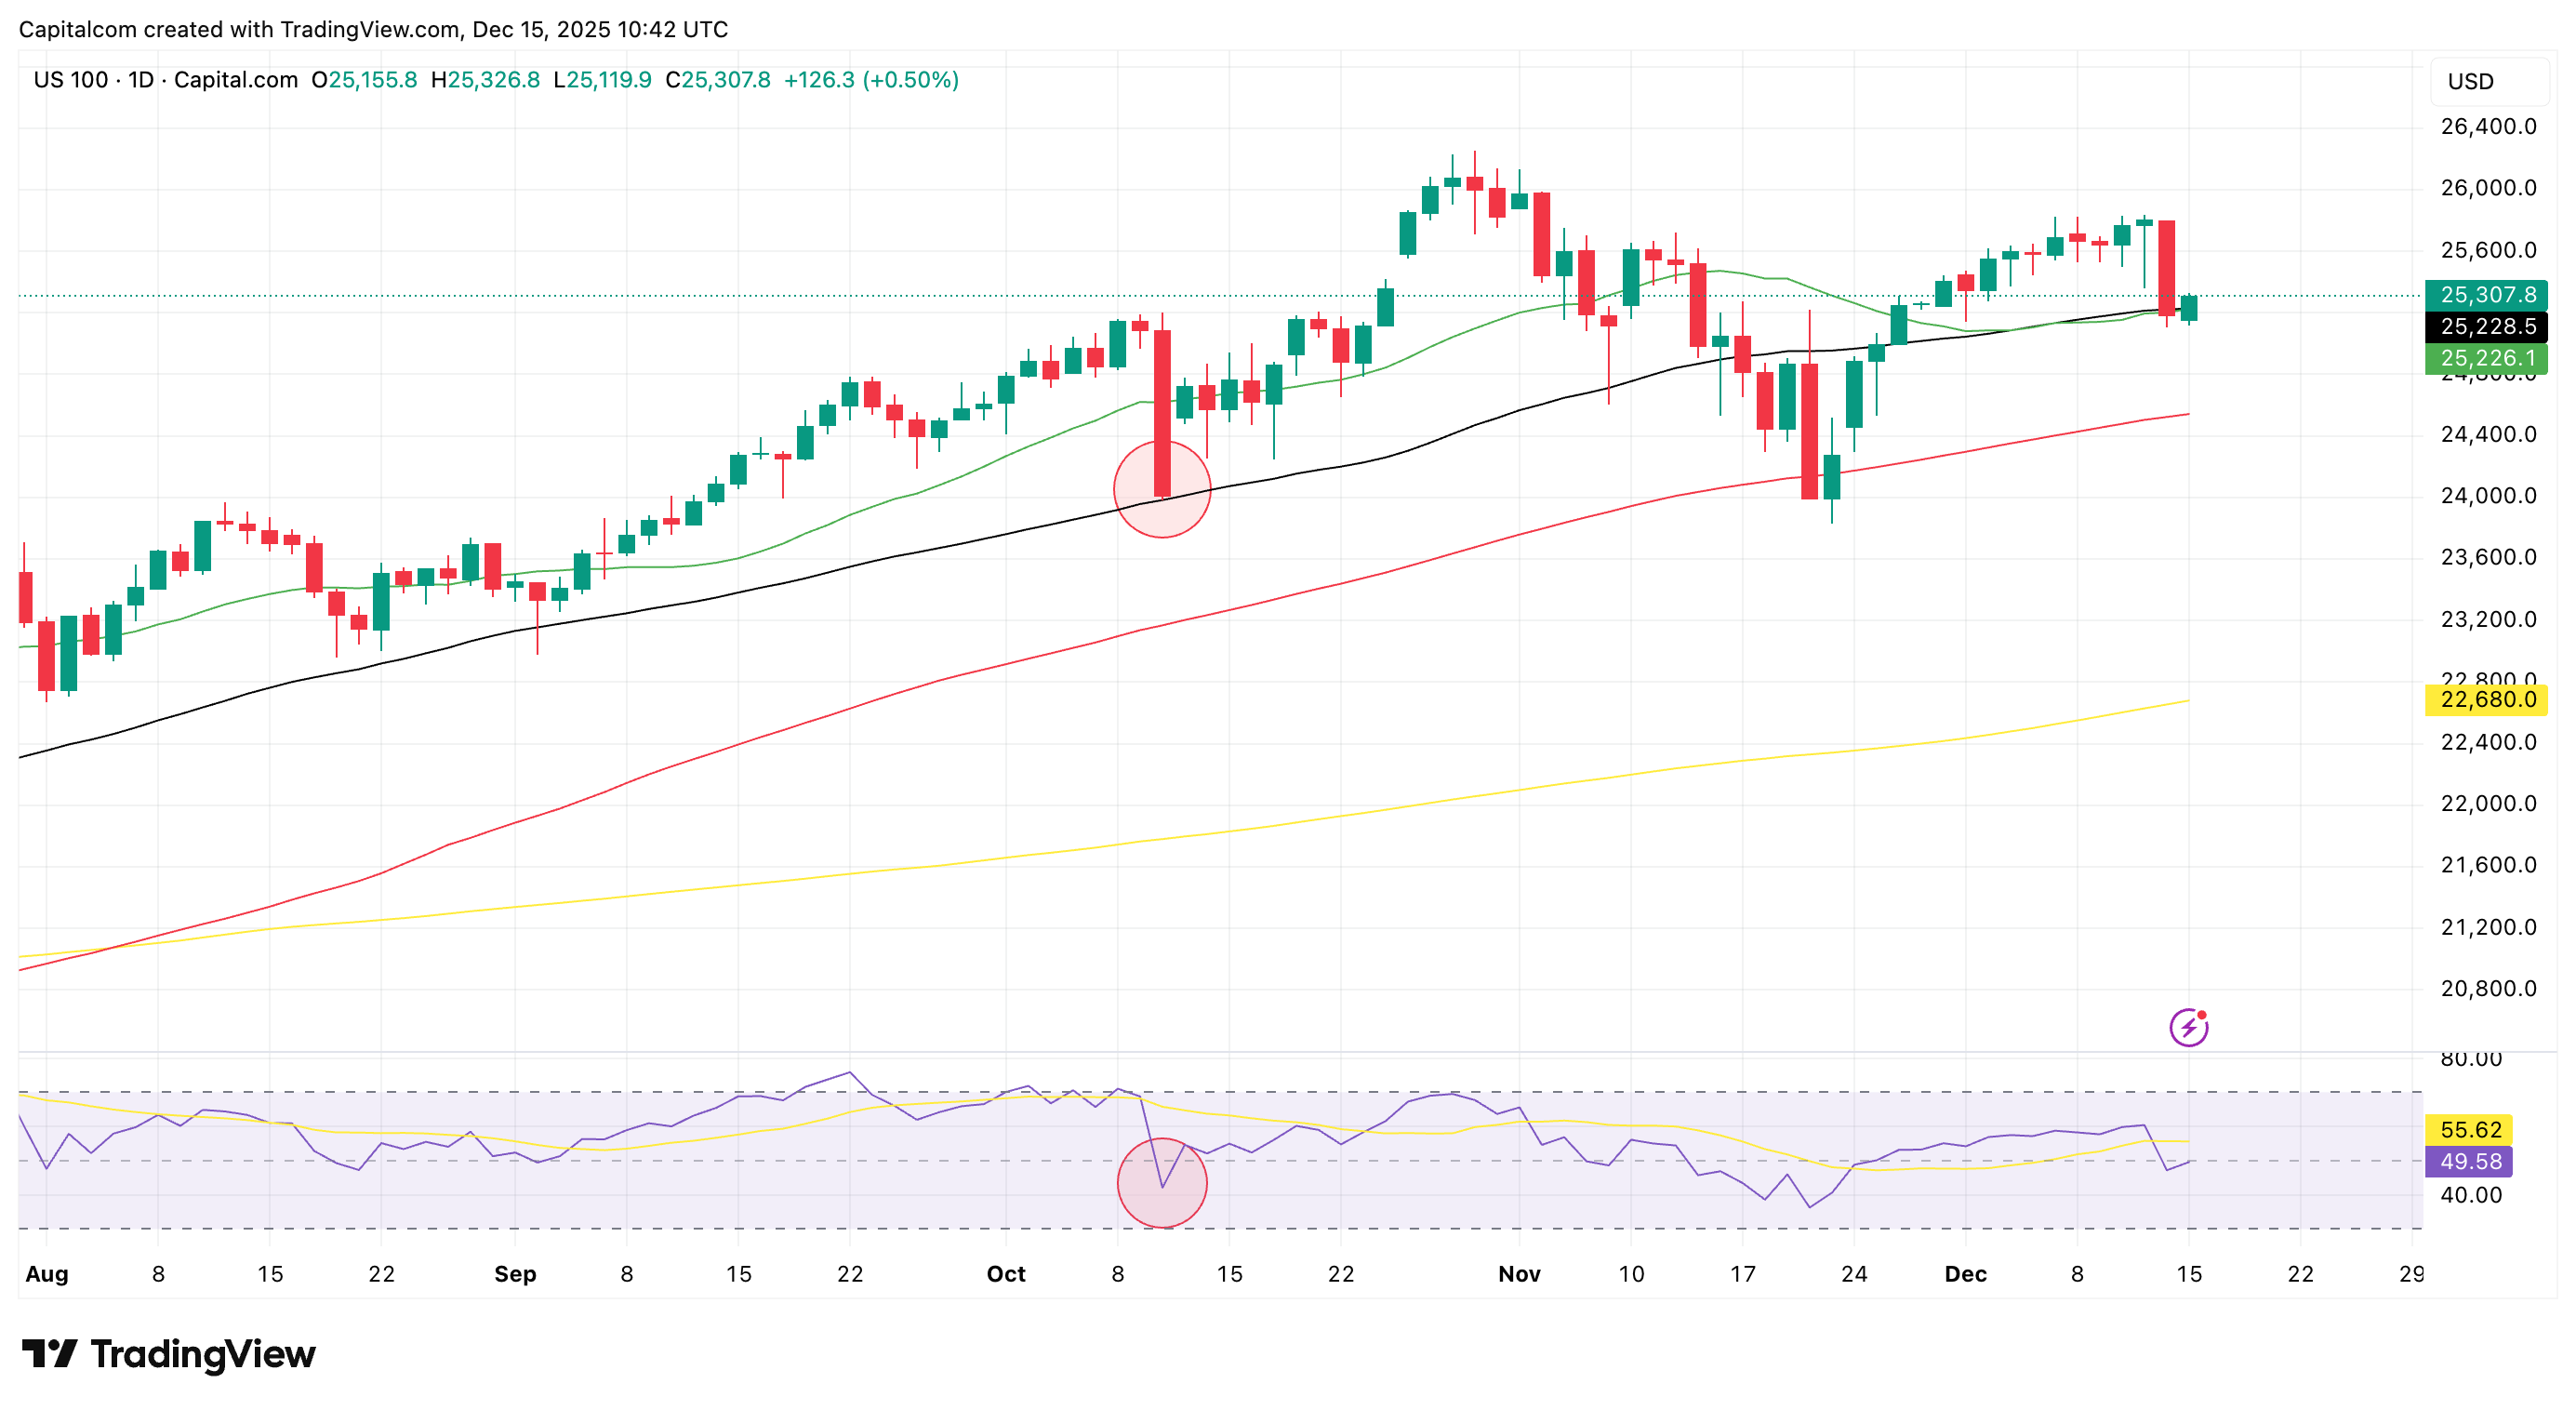
Past performance is not a reliable indicator of future results.
A Data-Heavy Week: Testing the Fed’s Labour Focus
Before the next round of central bank meetings, markets face a heavy data calendar, particularly for the US and UK.
On the US side, this is the first month back to normal data publication after the government data shutdown. The schedule includes PMIs, US CPI and jobs data for November, and PCE inflation for October, which remains slightly delayed.
The labour market numbers will be watched especially closely, given the Fed’s clear shift in emphasis toward the employment side of its mandate. A softer labour market and tame inflation could encourage markets to bring forward expectations for the next rate cut, currently seen after holds in January and March with April as the next “live” meeting, support hopes for a “Santa rally” in equities, add further pressure on the US dollar, and reinforce the bullish narrative for gold, which is already trading near record highs.
On the inflation side, the dynamic between CPI and PCE will also matter. The latest data showed PCE at 2.8% and CPI at 3% on the last available readings. A move in CPI below 3% combined with stable PCE would likely be taken as confirmation that the disinflation process is back on track – another tailwind for risk assets.
BoE, ECB and BoJ: A preview of 2026’s divergent policy world
Into the end of the week, attention shifts back to central banks, with meetings from the Bank of England (BoE), European Central Bank (ECB) and Bank of Japan (BoJ).
The Bank of England faces a delicate balancing act as it decides whether the UK’s disinflation trend is strong enough to justify a rate cut. Markets still see an 85% chance of easing, but the backdrop remains difficult: inflation is falling yet remains above target, the labour market is softening, and growth data have turned negative. The ideal outcome for policymakers would be softer inflation that reinforces confidence in the disinflation trend, a rate cut that supports the weakening economy, and a reduction in lingering stagflation concerns. Such a mix would likely support the FTSE, while the pound would be pulled between the downward pressure of lower yields and the potential boost from a more stable economic outlook.
The European Central Bank, meanwhile, is widely expected to keep rates on hold. Having already guided borrowing costs down to 2% while keeping inflation near target, the ECB has little incentive to shift policy now. With no major moves anticipated, the focus will be on Christine Lagarde’s communication around the longer-term path for rates. In practice, European markets are trading more on global risk appetite and expectations around the Federal Reserve than on any immediate ECB action.
In stark contrast, the Bank of Japan is preparing for another rate hike after years of ultra-loose policy. Inflation remains persistently near 3%, fiscal spending is set to rise, and policymakers face little political resistance—conditions that make further tightening likely. While no one expects an aggressive hiking cycle, another 75 basis points over time is plausible and would have meaningful market implications. The yen appears to be turning higher as USD/JPY loses momentum, and a stronger yen could pressure the Nikkei, especially if concerns about global equity valuations resurface. Together, the BoE easing, ECB pausing and BoJ tightening signal a shift toward significant policy divergence in 2026—setting the stage for greater volatility across global rates and FX markets.
Energy: Venezuela, Ukraine and a layer of risk premium
In commodities, recent events have added to the geopolitical risk premium without fundamentally changing the supply picture.
The US seizure of a Venezuelan oil tanker has spooked buyers and led to reports of sharply lower Venezuelan exports. While this is directionally bullish for oil – and meaningful at the margin – Venezuela is not a major producer in the same league as Saudi Arabia or the US. Its barrels help soften tightness, but the impact remains relatively contained. Price action over recent days has reflected that, with US crude and Brent still under pressure overall.
On the natural gas side, renewed focus on Ukraine–Russia tensions highlight familiar risks:
- Potential disruption to exports and shipping routes, particularly in the Black Sea,
- Higher perceived supply risks,
- A possible increase in geopolitical risk premia across the energy complex.
However, the conflict is not new, and much of the risk is already partially priced in. The net effect is an additional layer of volatility rather than a clear trend change – something to monitor rather than a standalone driver.
Gold and Silver: a textbook bull and a speculative sprint
Finally, precious metals continue to attract attention. Gold is trading in what looks like a textbook bull market. The macro drivers include expected Fed rate cuts, loose fiscal policy in many countries, concerns about policy being “too easy,” and lingering fears of stubborn inflation. Central bank buying and worries about Fed independence add further support. Technically, gold has shown a pattern of consolidate–breakout–consolidate–breakout and is now less than 1% from record highs. A sustained move above those highs would likely be taken as another bullish signal.
Gold, in this sense, is a barometer of market anxiety about policy error and inflation being under-addressed. Silver shares some of those safe-haven characteristics but has an additional industrial story, with structural support from expected tightness in supply, given heavy use in semiconductors, solar, and electric vehicles. A long-term constructive fundamental backdrop, but a near-term chart that looks very speculative, with exponential gains, little meaningful pullback, and signs of over-positioning.
The gold–silver ratio has dropped to multi-year lows, reaching levels not seen since the pandemic-era surge in silver relative to gold. That suggests that silver may be trading at extremes versus gold, leaving it vulnerable to a correction even if the long-term bullish case remains intact.
Silver (XAG/USD) vs Gold/Silver ratio weekly chart
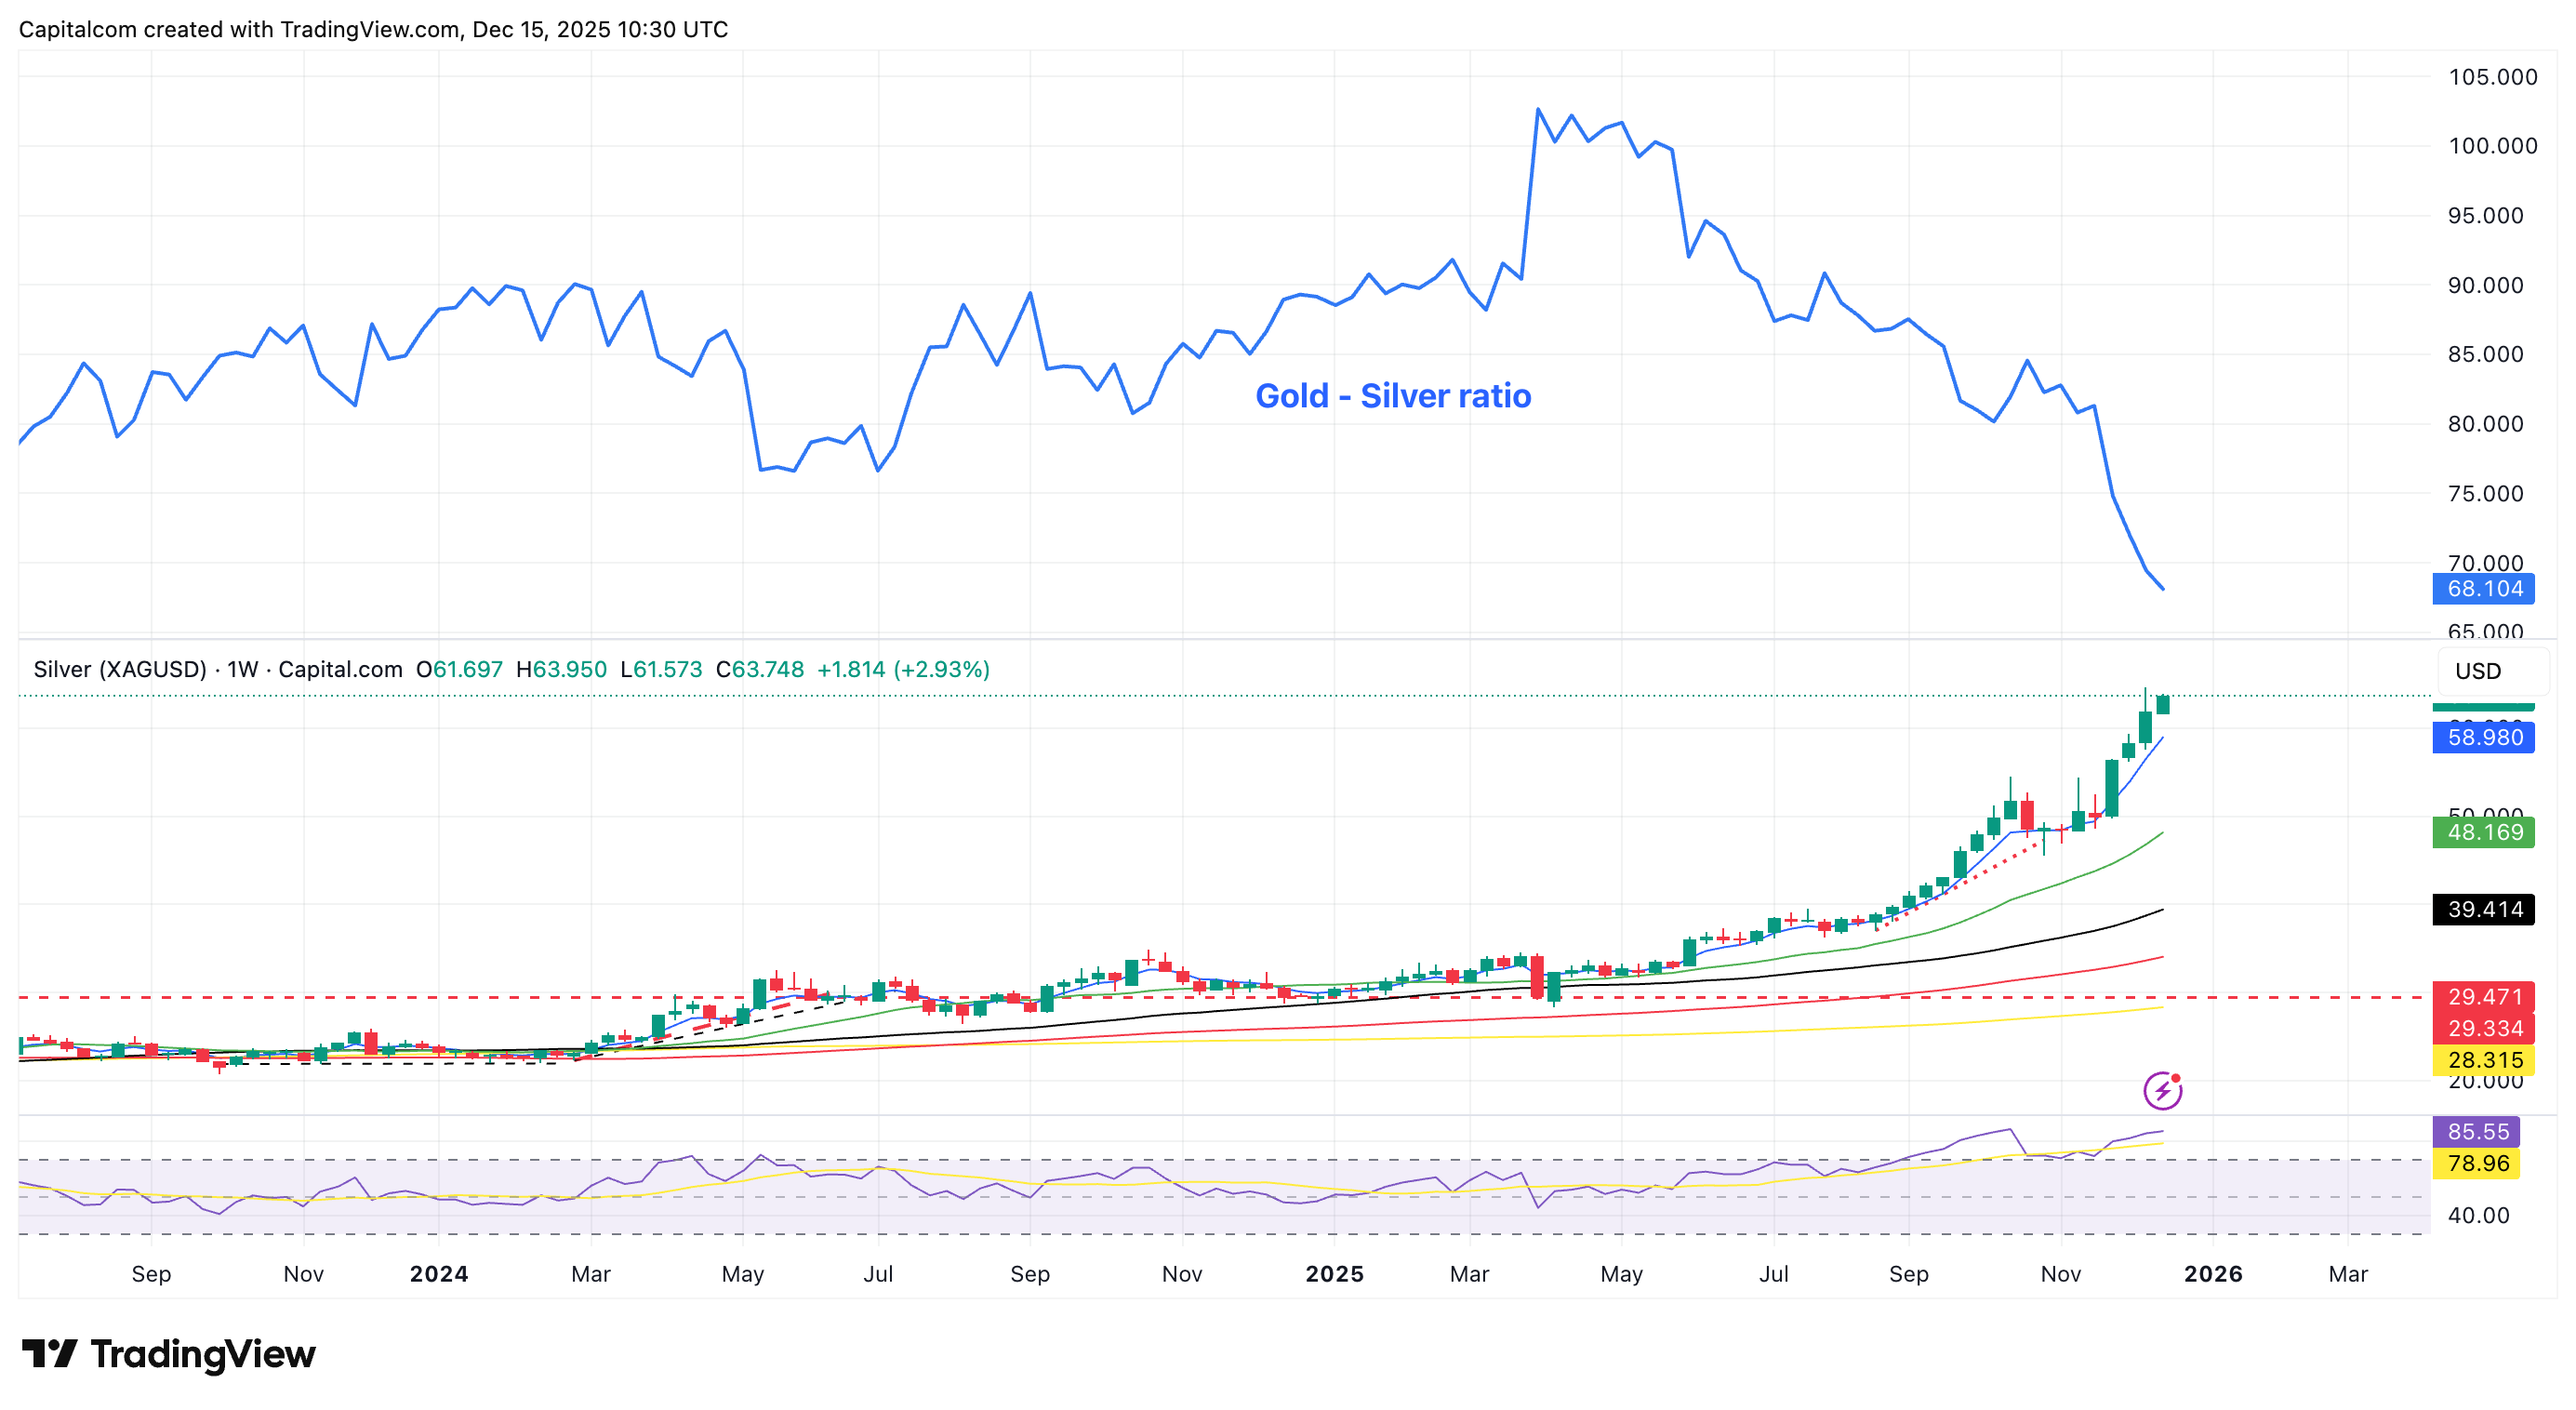
Past performance is not a reliable indicator of future results.