US 500 forecast: US–Israel conflict, oil above $81
The US 500 tracks 500 large US-listed companies and reflects broader equity market conditions, including geopolitical tensions in the Middle East, oil prices above $81, and ongoing Federal Reserve policy uncertainty. Past performance is not a reliable indicator of future results.
The S&P 500 index – referred to as the US 500 (US500) on CFD trading platforms such as Capital.com – is trading at $6,838 in early European trading on 4 March 2026, within an intraday range of $6,724.2–$6,873.8. Past performance is not a reliable indicator of future results.
Sentiment remains under pressure as the ongoing US–Israel military conflict with Iran disrupts shipping in the Strait of Hormuz – through which roughly one-fifth of global oil passes – with Brent crude settling above $81 per barrel on Tuesday, up more than 30% year to date (Reuters, 1 March 2026). On 3 March, New York Fed President John Williams said tariffs are keeping inflation above the Federal Reserve’s 2% target, adding to policy uncertainty (CNBC, 3 March 2026). Morningstar also reported that US futures pointed to a broadly neutral open on Wednesday following Tuesday’s volatile session (Morningstar, 4 March 2026).
US 500 forecast 2026–2030: Third-party targets
As of 4 March 2026, third-party US 500 predictions reflect a broad range of views. Analysts and model providers cite geopolitical developments, Federal Reserve policy, artificial intelligence (AI)-related earnings expectations, and macroeconomic conditions as key variables. The following targets summarise model-based and analyst projections from approved sources, published between February and March 2026.
Long Forecast (monthly model projection)
Long Forecast projects the US 500 to close March 2026 near 6,779, within a monthly range of 6,304–7,447, and to reach approximately 7,840 by December 2026. The model also indicates a potential annual high of 8,389. Its projections imply a stabilisation in the second half of the year following recent volatility (LongForecast, 28 February 2026).
CoinPriceForecast (year-end model target)
CoinPriceForecast places its year-end 2026 target at 6,969, with a mid-year level of 6,963. From current levels, this would represent growth of around 2%. The model reflects a comparatively cautious outlook amid ongoing geopolitical and inflation-related pressures (CoinPriceForecast, 4 March 2026).
Wallet Investor (12-month algorithmic forecast)
Wallet Investor projects the US 500 futures price at approximately 7,661 by December 2026, within a projected 2026 range of roughly 6,820–7,661. This implies a potential annual gain of around 12% from early-March levels. The model outlines gradual monthly advances, with stronger momentum projected into the second half of the year (Wallet Investor, 3 March 2026).
MarketBeat (Wall Street 2026 outlook)
MarketBeat reported that Wall Street analysts entered 2026 with a broadly constructive stance on the US 500, following a near-18% total return in 2025. Commentary focused on technology sector earnings, AI capital expenditure, and potential regulatory shifts. The report also noted that targets vary significantly between firms and remain sensitive to the pace of Federal Reserve easing and corporate earnings outcomes (MarketBeat, 6 January 2026).
Predictions and third-party forecasts are inherently uncertain, as they cannot fully account for unexpected market developments. Past performance is not a reliable indicator of future results.
US500 index price: Technical overview
The US500 index trades at $6,838 as of 11:32am UTC on 4 March 2026, within an intraday range of $6,724.2–$6,873.8.
The price trades below the 20-, 50-, 100- and 200-day simple moving averages (SMAs), currently near 6,885, 6,903, 6,834 and 6,570 respectively. This configuration places most short- and medium-term averages above the current price, while the 100-day SMA at 6,834 is being tested from below. The 200-day SMA at 6,570 sits further beneath and may act as a longer-term reference level.
Momentum indicators reflect mixed conditions. The 14-day relative strength index (RSI) reads 43.0, placing it in lower-neutral territory following the recent pullback, without signalling oversold conditions. The average directional index (ADX) at 15.8 indicates a weak trend environment, suggesting consolidation rather than a sustained directional move.
On the upside, the classic pivot point at 6,883 represents the first level to monitor. A daily close above this level would bring R1 at 6,990 into focus, followed by R2 near 7,101 if upward momentum persists.
On the downside, initial support lies at S1 near 6,772. A move below this level would expose S2 at 6,665. The 200-day SMA at 6,570 remains a broader structural reference; a sustained break below it could signal a shift in the medium-term technical structure, though confirmation would depend on follow-through price action (TradingView, 4 March 2026).
This technical analysis is provided for informational purposes only and does not constitute financial advice or a recommendation to buy or sell any instrument.
US 500 index history (2024–2026)
The US 500 index opened March 2024 near 5,082 and trended higher through much of the year, closing 2024 at 5,883 – a gain of around 15.8%. Market participants attributed this performance to corporate earnings resilience, continued AI-sector investment, and expectations of Federal Reserve rate cuts.
In 2025, the index began the year on a firmer footing but turned volatile in early April, when US tariff announcements triggered a sharp sell-off. The index fell from around 5,063 on 4 April to an intraday low near 4,808 on 7 April before rebounding to 5,480 by 9 April as trade tensions temporarily eased. It then climbed steadily through the remainder of the year, closing 2025 at 6,848 on 31 December – up approximately 16.4% year on year.
As of 4 March 2026, the US 500 closed at 6,838, around 0.3% lower year to date but approximately 17.4% higher year on year.
Past performance is not a reliable indicator of future results. Share prices are indicative and may differ from live market prices.
US 500 (US500): Capital.com analyst view
The US 500’s price path over the past two years highlights both resilience and sensitivity to macroeconomic shifts. After the April 2025 tariff-driven sell-off pushed the index toward 4,808, prices recovered and the index closed 2025 higher by around 16%, reaching levels above 6,990 in early 2026.
That recovery shows how markets can reprice policy shocks over time. However, valuations in technology and AI-linked sectors remain elevated by historical standards, which may increase sensitivity to earnings revisions or interest rate expectations. At the same time, the ongoing US–Israel conflict with Iran introduces additional uncertainty. Higher oil prices can feed into inflation, potentially influencing the Federal Reserve’s policy decisions and, in turn, equity valuations.
The outlook remains dependent on incoming data. Easing geopolitical tensions or a faster moderation in inflation could support risk appetite. Conversely, persistent inflation or weaker-than-expected earnings may weigh on sentiment. Traders should also consider the index’s proximity to recent range highs, where resistance has previously emerged.
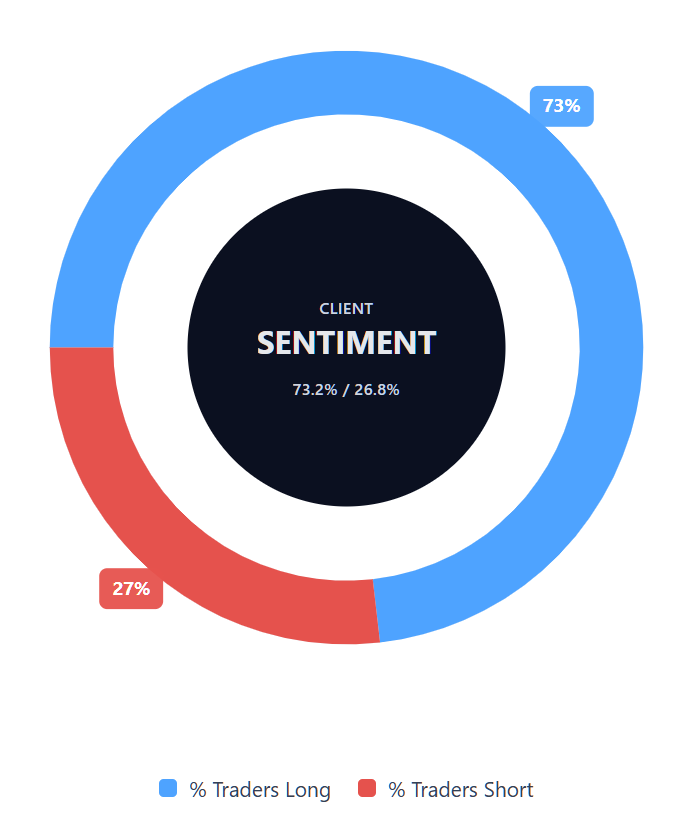
Capital.com’s client sentiment for US 500 CFDs
As of 4 March 2026, Capital.com client positioning in US 500 CFDs shows buyers at 73.2% and sellers at 26.8%, leaving buyers ahead by 46.4 percentage points. This reflects a one-sided long bias among current open positions on the platform. Positioning data can change quickly and does not in itself indicate future price direction.
Summary – US 500 2026
- As of 11:32am UTC on 4 March 2026, US 500 trades at $6,838, around 0.3% lower year to date and approximately 17.4% higher year on year.
- The index recovered from an April 2025 tariff-driven decline that briefly took it to 4,808, before reaching levels above 6,990 in early 2026.
- Most key moving averages sit above the current price, while RSI at 43.0 signals lower-neutral momentum and ADX at 15.8 points to a weak trend environment.
- The classic pivot point at 6,883 acts as an initial resistance reference. Support levels to monitor include 6,772 and 6,665, with the 200-day SMA at 6,570 as a broader technical marker.
- Key near-term variables include developments in the US–Israel conflict with Iran, oil prices above $81 per barrel, and Federal Reserve policy signals linked to inflation.
Past performance is not a reliable indicator of future results.
FAQ
What is the 5 year US 500 forecast?
Five-year forecasts for the US 500 vary widely and should be treated with caution. Most publicly available projections focus on one- to two-year horizons, as longer-term estimates become increasingly uncertain. Over a five-year period, outcomes will depend on corporate earnings growth, interest rate cycles, inflation trends and geopolitical developments. Structural themes such as artificial intelligence investment may also influence performance, but no forecast can reliably account for unforeseen economic or policy shifts.
Is US 500 a good CFD to trade?
Whether the US 500 is suitable as a CFD depends on your objectives, risk tolerance and trading strategy. The index offers high liquidity and broad exposure to large US companies, which can appeal to both short-term and longer-term traders. However, CFDs are leveraged products, meaning gains and losses are magnified. Volatility linked to macroeconomic data, Federal Reserve decisions or geopolitical events can increase risk, so risk-management tools are essential.
Could US 500 go up or down?
The US 500 can move in either direction, sometimes rapidly. Its price responds to a range of drivers, including earnings results, inflation data, central bank policy, energy prices and geopolitical developments. Technical factors such as support and resistance levels may also influence short-term moves. While longer-term trends often reflect economic growth and corporate profitability, periods of consolidation or drawdown are common and can occur without warning.
Should I invest in US 500?
Only you can decide whether investing or trading the US 500 aligns with your financial goals and risk profile. The index provides diversified exposure to the US equity market, but it remains sensitive to economic cycles and policy changes. If you are considering trading US 500 CFDs, remember that leverage increases both potential returns and potential losses. You may wish to assess your experience, objectives and risk-management approach before taking any position.
Can I trade US 500 CFDs on Capital.com?
Yes, you can trade US 500 CFDs on Capital.com. Trading index CFDs lets you speculate on price movements without owning the underlying asset and to take long or short positions. However, contracts for difference (CFDs) are traded on margin, and leverage amplifies both profits and losses. You should ensure you understand how CFD trading works, assess your risk tolerance, and recognise that losses can occur quickly.