Hong Kong 50 (Hang Seng) forecast
Hong Kong 50 tracks major Hong Kong-listed shares, with recent price action influenced by Fed and HKMA rate holds, oil prices and US–Iran tensions. Explore third-party HK50 targets and technical analysis. Past performance is not a reliable indicator of future results.
The Hang Seng index – referred to as the Hong Kong 50 (HK50) on CFD trading platforms such as Capital.com – Hong Kong 50 (HK50) is trading at $26,615 HKD as of 2:33pm UTC on 7 May 2026, according to Capital.com's quote feed, with an intraday range of $25,923.40–$26,665.80 HKD. Past performance is not a reliable indicator of future results.
The rebound follows a period of mixed sentiment shaped by several intersecting forces. The US Federal Reserve held its benchmark federal funds rate unchanged at 3.5%–3.75% on 30 April, prompting the Hong Kong Monetary Authority (HKMA) to maintain its base rate at 4% (HKMA, 30 April 2026), while Fed officials flagged rising inflation concerns tied to elevated oil prices amid continued US–Iran tensions in the Middle East (CNBC, 29 April 2026). The index had also been weighed earlier in the week by broader geopolitical uncertainty stemming from the US–Iran military conflict, before easing Middle East tensions offered some support in the following session, with the Hang Seng gaining approximately 0.7% to close at $26,085 HKD on 5 May (Trading Economics, 6 May 2026). The HK50's advance on 7 May extended that recovery, with gains seen across multiple sectors on Capital.com's feed.
Third-party Hong Kong 50 forecast: Rate holds and oil risks
As of 7 May 2026, third-party Hong Kong 50 predictions vary by modelling approach, with near-term monthly estimates and macro models reflecting ongoing sensitivity to US–China trade conditions, Federal Reserve policy, and regional earnings momentum.
Long Forecast (monthly model, May–December 2026)
Long Forecast places the HK50 at a May 2026 month-end close of approximately $26,454 HKD, within an intramonth range of $23,329–$28,306 HKD, and projects a gradual climb toward a December 2026 month-end close of approximately $27,542 HKD. The model points to moderate positive momentum through mid-year before a seasonal dip in August–September, with closing estimates of approximately $26,278 HKD and $25,553 HKD respectively, followed by a fourth-quarter recovery. The forecast assumes continued stabilisation after March's sharp sell-off (Long Forecast, 3 May 2026).
iTiger (monthly investment strategy, May 2026)
iTiger notes that the Hang Seng Index posted a maximum gain of 7% in April 2026, with the index trading within a $24,901.77–$26,529.49 HKD range for the month, amid an extended period of calm following a pause in US policy escalation. For May, iTiger's strategy centres on AI and technology as the dominant theme, citing the release of DeepSeek V4 as a milestone, while flagging Trump's mid-May visit to China and ongoing US–Iran tensions via the Strait of Hormuz blockade as the primary macro risk variables (iTiger, 3 May 2026).
Trading Economics (macro model, end-of-quarter projection)
Trading Economics' global macro model places the HK50 at approximately $24,919.60 HKD by the end of Q2 2026, with a 12-month projection of approximately $21,298.90 HKD. The model reflects potential downward pressure from elevated inflation risks, the US Federal Reserve's decision to hold rates at 3.5%–3.75% on 30 April 2026, and uncertainty surrounding oil supply disruption linked to the Strait of Hormuz situation (Trading Economics, 7 May 2026).
SmartKarma (index composition review, May 2026)
In its May 2026 HSI index review, SmartKarma analyst Ke Yan, CFA, FRM notes the expected addition of BeOne and Zijin Gold to the Hang Seng Index with no deletions, observing that healthcare and emerging-market internet companies remain the most underrepresented sector categories within the current composition. Index composition changes of this type can affect near-term flows into constituent stocks as passive and index-tracking funds adjust weightings, with the review published ahead of the standard May index rebalance (SmartKarma, 22 April 2026).
Forecasts.org (statistical extrapolation, monthly average)
Forecasts.org carries a statistical model placing the average HK50 level for May 2026 at approximately $25,952 HKD, rising to a June 2026 monthly average of approximately $26,380 HKD and a July 2026 monthly average of approximately $26,189 HKD. The projections are derived from historical price extrapolation rather than fundamental or macro analysis, with the model updated on a rolling basis (Forecasts.org, 7 May 2026).
Predictions and third-party forecasts are inherently uncertain, as they cannot fully account for unexpected market developments. Past performance is not a reliable indicator of future results.
HK50 index price: Technical overview
The HK50 index trades at $26,615 HKD as of 2:33pm UTC on 7 May 2026, holding above all major simple moving averages, with the 20/50/100/200-day SMAs clustered at approximately $26,046 / $25,798 / $26,109 / $25,958 HKD. The 20-over-50 alignment remains intact, keeping the near-term trend positive from a technical perspective. The Hull moving average (9) runs at approximately $26,279 HKD, placing the current price above all near-term dynamic references according to TradingView data.
Momentum is in upper-neutral territory: the 14-day relative strength index reads 59.29, consistent with a firm but not stretched bias. The average directional index (14) sits at 9.70, below the 15 threshold, indicating a weak trend environment where directional conviction is limited.
On the topside, the classic R1 pivot at approximately $26,570 HKD is the nearest reference above current levels; a daily close through that level would put R2 near $27,364 HKD in view. On pullbacks, the classic pivot point at approximately $25,736 HKD provides initial support, with the 100-day SMA shelf near $26,109 HKD acting as the more immediate cushion. A move below that level could direct attention toward S1 at approximately $24,942 HKD (TradingView, 7 May 2026).
This technical analysis is for informational purposes only and does not constitute financial advice or a recommendation to buy or sell any instrument.
Hong Kong 50 index history (2024–2026)
The Hong Kong 50 index opened May 2024 around $18,557 HKD and spent much of mid-2024 in an $18,000–$18,700 HKD range before a sharp stimulus-driven surge in late September and early October 2024 pushed the index to a peak close of $23,473 HKD on 7 October. The move marked a near 30% rally in under two weeks and coincided with China's announcement of a sweeping economic stimulus package.
That initial reaction faded quickly. The index retraced to around $19,500 HKD by mid-November 2024 amid disappointment over the scale of fiscal follow-through, before stabilising and closing 2024 at approximately $20,050 HKD. A renewed recovery carried into early 2026, with HK50 reaching a local high near $28,102 HKD on 29 January 2026, supported by AI-driven technology optimism and improving China–US trade sentiment.
The index then pulled back sharply through late January and into April 2026, touching a low close of $18,895 HKD on 8 April 2026 amid heightened US tariff escalation fears before recovering. The subsequent rebound has been steady, with HK50 closing at $26,618 HKD on 7 May 2026, approximately 32.8% higher year on year from $22,604 HKD on 7 May 2025, and approximately 4.5% higher year to date from its 1 January 2026 open of $25,603 HKD.
Past performance is not a reliable indicator of future results. Prices are indicative and may differ from live market prices.
Hong Kong 50 (HK50): Capital.com analyst view
The HK50's performance over the past year reflects a market navigating a complex mix of tailwinds and headwinds. A recovery from April 2026's tariff-shock lows, the gradual revival of China's AI and technology sector, and selective stimulus from Beijing have collectively supported sentiment. Hong Kong IPO fundraising rose sharply in early 2026 compared with the prior year, pointing to renewed activity in the market. That said, valuations relative to recent lows could leave the index more exposed to fresh macro shocks, particularly any deterioration in US–China trade relations or a renewed geopolitical risk-off move of the kind triggered by the US–Iran conflict in late February 2026.
The policy backdrop adds further nuance. The US Federal Reserve's decision to hold rates at 3.5%–3.75% in April 2026, with the HKMA following suit, may support Hong Kong's rate-linked financial stocks, but the Fed's inflation caution also suggests that meaningful rate relief could be slow to materialise. China's domestic stimulus measures have provided a floor for sentiment, though past episodes have shown that disappointment over follow-through can quickly reverse gains.
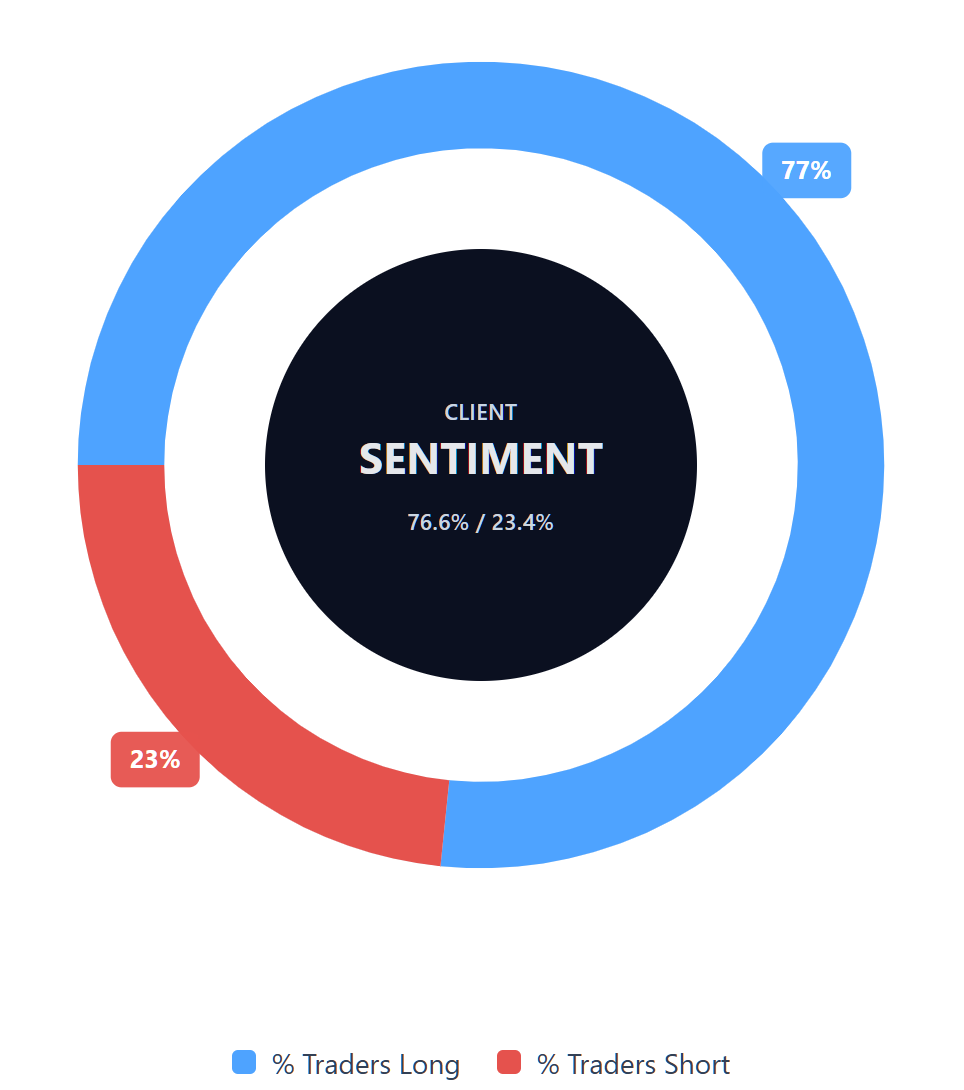
Capital.com’s client sentiment for Hong Kong 50 CFDs
As of 7 May 2026, Capital.com client positioning in Hong Kong 50 CFDs reads 76.6% buyers vs 23.4% sellers, putting buyers ahead by 53.2 percentage points and placing sentiment in long-heavy territory. This snapshot reflects open positions on Capital.com at the time of capture and can change rapidly as market conditions evolve.
Summary – Hong Kong 50 2026
- HK50 trades at $26,615 HKD as of 2:33pm UTC on 7 May 2026, up approximately 32.8% year on year and 4.5% year to date.
- Key drivers include US–China trade relations, Federal Reserve and HKMA rate policy, China's domestic stimulus measures, and Hong Kong's improving IPO market activity.
- The Fed held rates at 3.5%–3.75% in April 2026 and the HKMA followed suit, while both central banks flagged ongoing inflationary concerns.
Past performance is not a reliable indicator of future results.
FAQ
What is the five-year Hong Kong 50 forecast?
Is Hong Kong 50 a good CFD to trade?
Whether Hong Kong 50 is suitable to trade as a CFD depends on your experience, risk tolerance, strategy, and understanding of leveraged products. The index can appeal to traders looking for exposure to Hong Kong and China-linked equities, with drivers including technology sentiment, policy decisions, IPO activity, and geopolitical developments. However, CFDs are leveraged, so both profits and losses can be magnified. Traders should consider risk-management tools and avoid relying on forecasts alone.
Could Hong Kong 50 go up or down?
Should I invest in Hong Kong 50?
Can I trade Hong Kong 50 CFDs on Capital.com?
Yes, you can trade Hong Kong 50 CFDs on Capital.com. Trading index CFDs lets you speculate on price movements without owning the underlying asset and to take long or short positions. However, contracts for difference (CFDs) are traded on margin, and leverage amplifies both profits and losses. You should ensure you understand how CFD trading works, assess your risk tolerance, and recognise that losses can occur quickly.