
US Wall Street 30 forecast: Third-party targets
The US Wall Street 30 (US30) reflects price movements across a basket of major US blue-chip companies and is closely watched by traders and investors as a gauge of US equity sentiment.
The US Wall Street 30 (US30) is trading around 49,329 in intraday trade, between a session low of 48,795.3 and a high of 49,418.2, as of 3:03pm UTC on 9 January 2026. The index is holding close to the 49,266.1 area, where the Dow Jones Industrial Average recently closed after a 0.55% gain, keeping it near record territory reached earlier in the week. Past performance is not a reliable indicator of future results.
Trading is taking place against a backdrop of slightly higher US Treasury yields, with the 10-year hovering near 4.17% and the US dollar index edging higher, as markets digest recent labour-market data and look ahead to additional jobs figures later in the week (Reuters, 6 January 2026).
US30 forecast 2026–2030: Third-party targets
As of 9 January 2026, third-party US30 predictions remain broadly constructive into 2026, with targets framed mainly via S&P 500 and broader US equity projections, rather than index-specific Dow levels. Recent house views and strategy notes emphasise earnings growth, policy-rate expectations and the impact of artificial intelligence (AI) investment as key inputs into forecasts for US equity indices over the next one to two years.
Goldman Sachs (house equity view)
Goldman Sachs expects the US equity bull market to continue into year-end 2026, projecting the S&P 500 at around 7,600, which would imply mid-teens percentage upside from current levels. The bank cites expectations for solid US economic and revenue growth, continued profit strength among large US companies, and productivity gains linked to AI adoption as key supports for its outlook (Investing.com, 7 January 2026).
UBS (CIO house view)
UBS, in a CIO Daily, maintains a view that US equities have scope to ‘rally further’, with the S&P 500 projected near 7,300 by June 2026 and around 7,700 by year-end 2026, building on strong gains seen through 2025. The UBS CIO team notes that expected earnings-per-share growth of around 10% in 2026, alongside moderating inflation and supportive fundamentals, underpins its constructive stance (UBS, 12 December 2025).
DWS (CIO equity outlook)
DWS, in its CIO View document released in late 2025, indicates a 2026 S&P 500 target of around 7,500 points, which it frames as an advance of approximately 9% over then-prevailing index levels. The asset manager links this outlook to an anticipated positive contribution from AI-related investment, while acknowledging that the scenario depends on assumptions that may be challenged by future developments (DWS, 12 December 2025).
Reuters (market strategist roundup)
A Reuters equity-market feature dated 2 January 2026 reports that Wall Street analysts, using LSEG IBES data, expect S&P 500 earnings to rise by around 15.5% in 2026, following an estimated 13% increase in 2025. Strategists cited in the piece, as referenced by Investing.com, point to modest US economic growth and moderating inflation, and note that valuations leave earnings growth as a key potential driver of returns, rather than multiple expansion alone (Investing.com, 2 January 2026).
TheStreet / FactSet (consensus earnings lens)
A January 2026 analysis on TheStreet, drawing on FactSet data, highlights consensus expectations for S&P 500 earnings growth of roughly 15.0% in calendar 2026, above the trailing 10-year average, alongside revenue growth estimates of about 7.2%. The article notes that analysts see earnings support coming from higher corporate revenues and improved profit margins, with capital expenditure and AI-related spending identified as important contributors (TheStreet, 5 January 2026).
Predictions and third-party forecasts are inherently uncertain, as they cannot fully account for unexpected market developments. Past performance is not a reliable indicator of future results.
US30 price: Technical overview
The US30 index is trading near 49,329 as of 3:03pm UTC on 9 January 2026, holding comfortably above its key moving-average cluster. The 20-, 50-, 100- and 200-day simple moving averages sit around 48,563 / 47,782 / 46,925 / 44,719, with a 20-over-50 alignment intact. The 14-day RSI near 63.7 remains in an upper-neutral range, consistent with firm but not stretched momentum, while an ADX reading near 21 suggests the prevailing uptrend is present but not yet strongly established.
On the topside, the nearest Classic pivot resistance (R1) sits around 48,879, with R2 near 49,694 coming into view only after a sustained daily close above the first resistance area. On the downside, the Classic pivot near 48,071 marks initial support. Below that, the 100-day SMA near 46,925 forms the next notable moving-average support, with S1 near 47,256 only becoming relevant if the pivot level gives way on a closing basis (TradingView, 9 January 2026).
This technical analysis is provided for informational purposes only and does not constitute financial advice or a recommendation.
US30 index history (2024–2026)
The US30 index has trended higher over the past two years, rising from the mid-37,000s in January 2024 to around 49,309 by 9 January 2026, as large US blue-chip stocks pushed the index to successive record-area closes through late 2025 and into the new year. The index spent much of 2024 consolidating between roughly 38,000 and 40,000 before breaking higher in the second half, then extended those gains through 2025, with repeated pullbacks toward the low-40,000s finding support ahead of a gradual grind into the high-40,000s by year-end.
By early January 2026, US30 was trading just above 49,300, leaving it more than 30% higher than its January 2024 level and around 16% above its end-2024 close, reflecting a strong two-year advance in US large-cap equity prices.

Past performance is not a reliable indicator of future results. Share prices are indicative and may differ from live market prices.
US Wall Street 30: Capital.com analyst view
The US Wall Street 30 has climbed steadily over the past two years, rising from the high-37,000s in early 2024 to around 49,329 as of 9 January 2026 on Capital.com’s platform, broadly mirroring the advance seen across major US equity benchmarks. This move has been supported by resilient large-cap earnings, expectations for a more accommodative Federal Reserve stance, and ongoing interest in sectors such as industrials, healthcare and defence. At the same time, the path higher has included periods of volatility and sharp pullbacks, as growth, inflation and policy expectations have shifted.
Looking ahead, key drivers for US30 are likely to include the pace at which US inflation moves toward the Federal Reserve’s target, the strength of the domestic labour market, and the durability of corporate profit growth. These factors may support index levels if conditions remain favourable, but could also pressure prices if they deteriorate or prompt a renewed tightening in financial conditions. Policy signals from the Federal Reserve and the Trump administration, alongside shifts in sentiment around artificial intelligence, fiscal policy and global geopolitics, may continue to drive two-way moves in US blue-chip equities.
Capital.com’s client sentiment for US30 CFDs
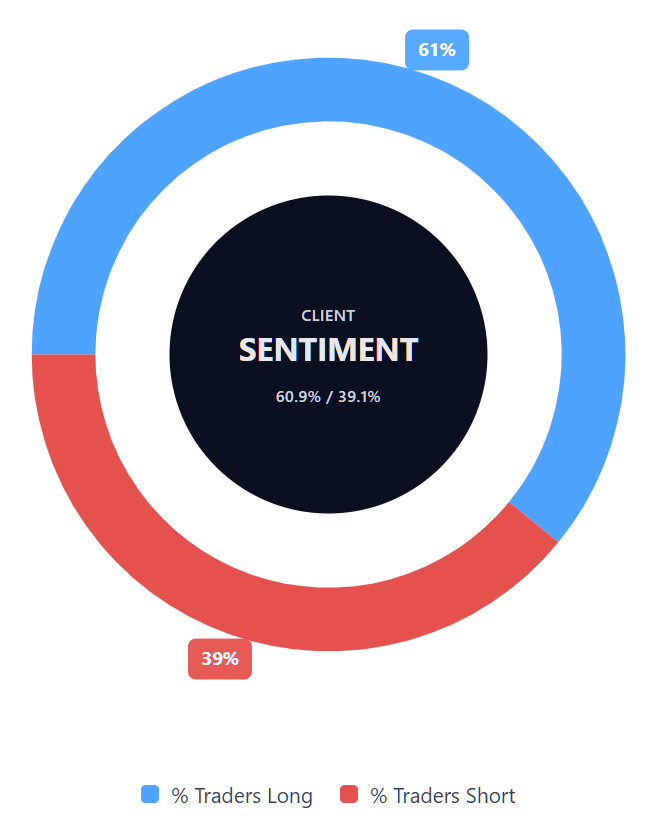
As of 9 January 2026, Capital.com client positioning in US Wall Street 30 CFDs shows 60.9% buyers versus 39.1% sellers, leaving the market in majority-buy territory, but short of extreme positioning. Buyers outnumber sellers by around 21.8 percentage points. This snapshot reflects open positions on Capital.com and may change.
Summary – US Wall Street 30
- US Wall Street 30 (US30) climbed from the low-40,000s in January 2025 to the high-48,000s by late December, marking a strong year of gains for US blue-chip stocks.
- The index experienced several sharp pullbacks, including dips toward the high-30,000s in April, before rebounding and moving into record-area territory toward the end of 2025.
- Technical signals over the period were generally constructive, with price holding above rising 50-, 100- and 200-day moving averages for much of the year.
Past performance is not a reliable indicator of future results.
FAQ
What is the five-year US30 index forecast?
There is no single five-year US30 index forecast, as longer-term outlooks depend on assumptions about economic growth, corporate earnings, inflation, interest rates and policy decisions. Analyst projections tend to focus on broader US equity benchmarks, often highlighting earnings trends and productivity factors rather than specific Dow Jones levels. Over multi-year horizons, outcomes can vary significantly, and forecasts are subject to change as economic and market conditions evolve.
Is US30 good to buy?
Whether US30 is 'good to buy' depends on individual objectives, risk tolerance and time horizon. The index has historically reflected the performance of large US companies, but it can experience periods of volatility and drawdowns. Past gains do not guarantee future returns, and prices can move in response to economic data, policy decisions and market sentiment. Any trading or investment decision should be based on personal circumstances rather than general market commentary.
Could US30 go up or down?
Should I invest in US30?
Can I trade US30 CFDs on Capital.com?
Trading US30 CFDs on Capital.com lets you speculate on movements without owning the underlying asset and to take long or short positions. However, contracts for difference (CFDs) are traded on margin, and leverage amplifies both profits and losses. You should ensure you understand how CFD trading works, assess your risk tolerance, and recognise that losses can occur quickly.