Trading the Dow 30 as Tariff Uncertainty Returns
Red in the futures market sees contained retreat continuing to test its shorter-term technicals, while in sentiment there’s been a shift to net short among CoT speculators.
U.S. equity index futures are under pressure after President Trump said he will raise the “global tariff” rate to 15% from 10% via Section 122 of the Trade Act of 1974 that can last for at least 150 days. This comes after the Supreme Court struck down (in a 6-3 vote) Trump’s power to impose tariffs via IEEPA. In all the action and reaction means tariffs are here to stay, and so too uncertainty, with both seen as relatively negative factors. The losses this morning has undone a chunk of last week’s gains for the S&P 500 (w/w +1.1% to 6,909), Nasdaq 100 (w/w +1.4% to 25,012), Dow 30 (w/w +0.5% to 49,625), and Russell 2000 (w/w +1.7% to 2,663).
Among Big Tech it was Amazon (+2.6%) that was a notable beneficiary on Friday following the Supreme Court ruling given it sources heavily from China in what was a positive session for most retailers and tariff-sensitive names including Home Depot (+1%), Shopify (+1.9%), Wayfair (+2.3%), and Floor & Decor (+4.3%), though Walmart (-1.5%) slipped after an HSBC downgrade to hold from buy. Expect some of those gains to be undone today following the tariff announcement.
Treasury yields ended Friday higher digesting stickier pricing data but also softer growth (see below), and market pricing (CME’s FedWatch) isn’t far off fully pricing in a hold out of the Federal Reserve (Fed) in March, shifting to roughly a coin toss on hold vs 25bp (basis point) cut in June from a previous majority in favor of a rate reduction, and only sees two rate cuts this year.
There was a plethora of data to digest last Friday, advance Q4 GDP (Gross Domestic Product) a clear miss at just 1.4% q/q (vs 3% forecast) and blamed on the government shutdown. PCE (Personal Consumption Expenditures) Price Index for December was hotter than anticipated throughout with headline y/y (year-on-year) rising from 2.8% to 2.9%, core y/y reaching 3% from 2.8%, and m/m (month-on-month) growth of 0.4% for both vs 0.3% expectations. Preliminary manufacturing PMI (Purchasing Managers’ Index) in February was expansionary but below forecast at 51.2 from 52.4 prior, and so too services at 52.3 from 52.7. Lastly, UoM’s (University of Michigan) revised figures saw consumer sentiment fall to 56.6 while expectations held at 56.6, though a positive factor was consumer inflation expectations dropping for both the one-year (to 3.4%) and five-year (to 3.3%) readings.
Week ahead
It’s relatively low-impacting items today including factory orders, while tomorrow we’ll get CB’s consumer confidence after recent readings showed consumers anything but confident, the weekly unemployment claims on Thursday, and producer prices on Friday. There will be plenty of FOMC (Federal Open Market Committee) members speaking likely commenting about the latest data releases and tariff updates. In earnings among the Dow 30’s components, Home Depot releases their quarterly figures on Tuesday and Salesforce on Thursday, but the biggest one of them all is on Wednesday as ‘AI engine’ Nvidia finally delivers its prints and guidance.
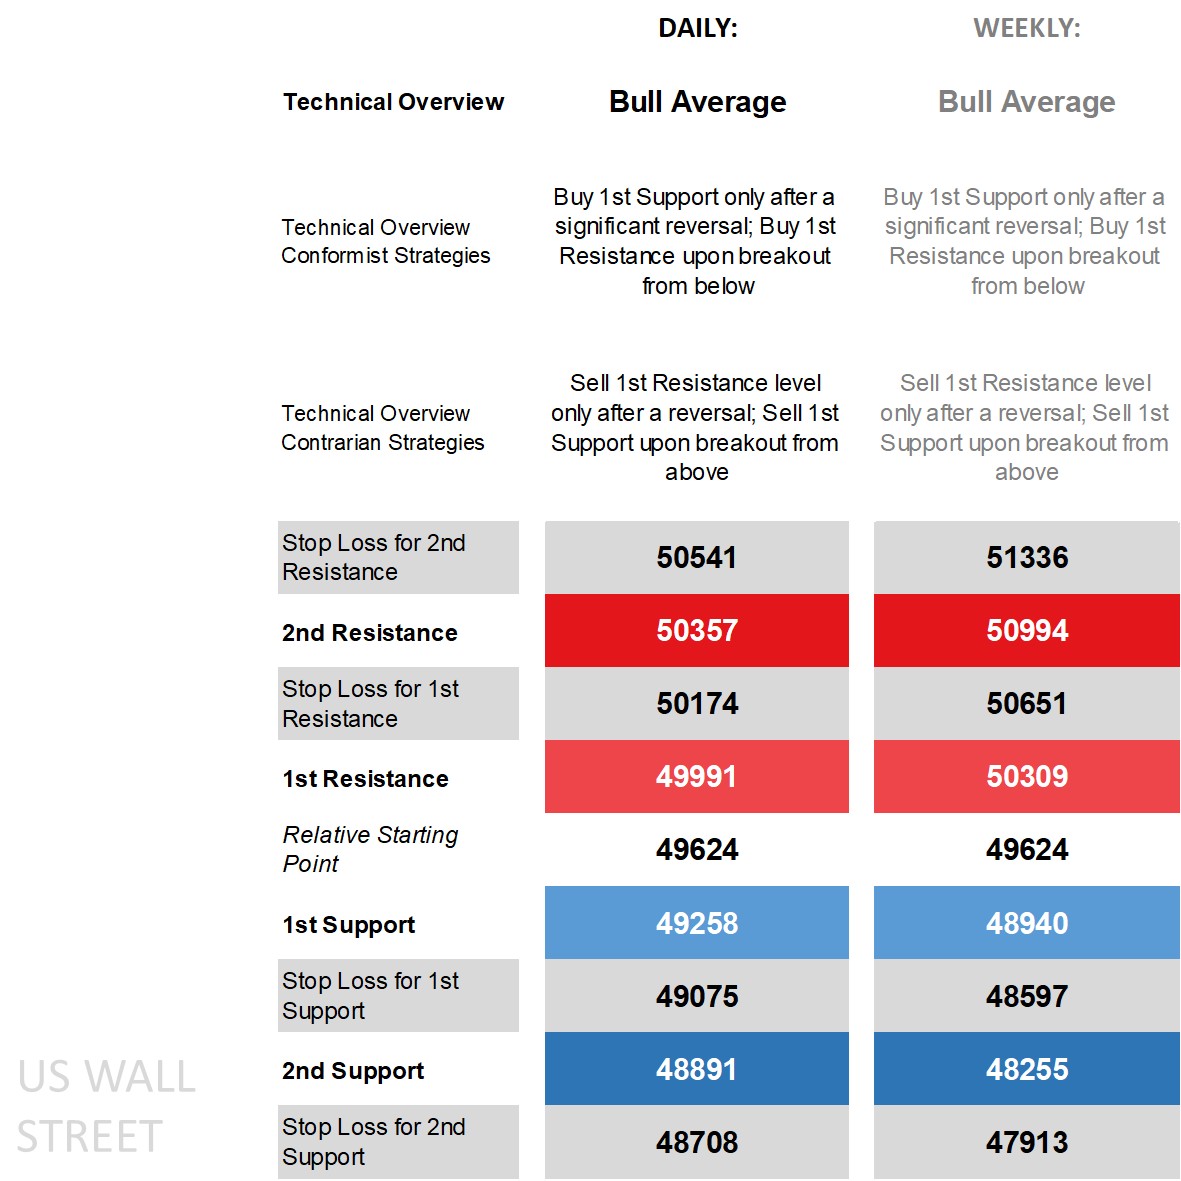
Dow 30’s technical overview, strategies and levels
Looking at the daily time frame and price remains above its main long-term moving averages (MA) though that’s not the case for its shorter-term MA’s, in the middle of its Bollinger Bands, on the DMI (Directional Movement Index) front the -DI over the +DI though by one calculation not enough to label it as negative just yet, an RSI (Relative Strength Index) in the middle, and an ADX (Average Directional Movement Index) not in trending territory. The ‘bullish’ overview borrows heavily from the weekly time frame where its movement has been within a bull channel with price above its main weekly moving averages, the weekly +DI still above the -DI, a weekly RSI that earlier this month reached overbought territory, and a weekly ADX that’s rising even if yet to reach trending territory.
A ‘bull average’ for both time frames then, but where shorter-term technicals are tested and weaker on the daily time frame especially with the latest uncertain factors hurting risk appetite. Conformists who see the technicals strengthening again have buy strategies to work with but ideally only after a significant reversal if initiating off the 1st Support level waiting for price to go beneath it sizably before opening only if it recovers, and via buy-breakout off the 1st Resistance. Those who think we’re in for a pullback or at least oscillations at these levels are armed with reversal strategies as seen in the contrarian row below, and if see a pullback be it initial or eventual have sell-breakout strategies off the 1st Support and sell-after-reversal off the 1st Resistance, respectively.
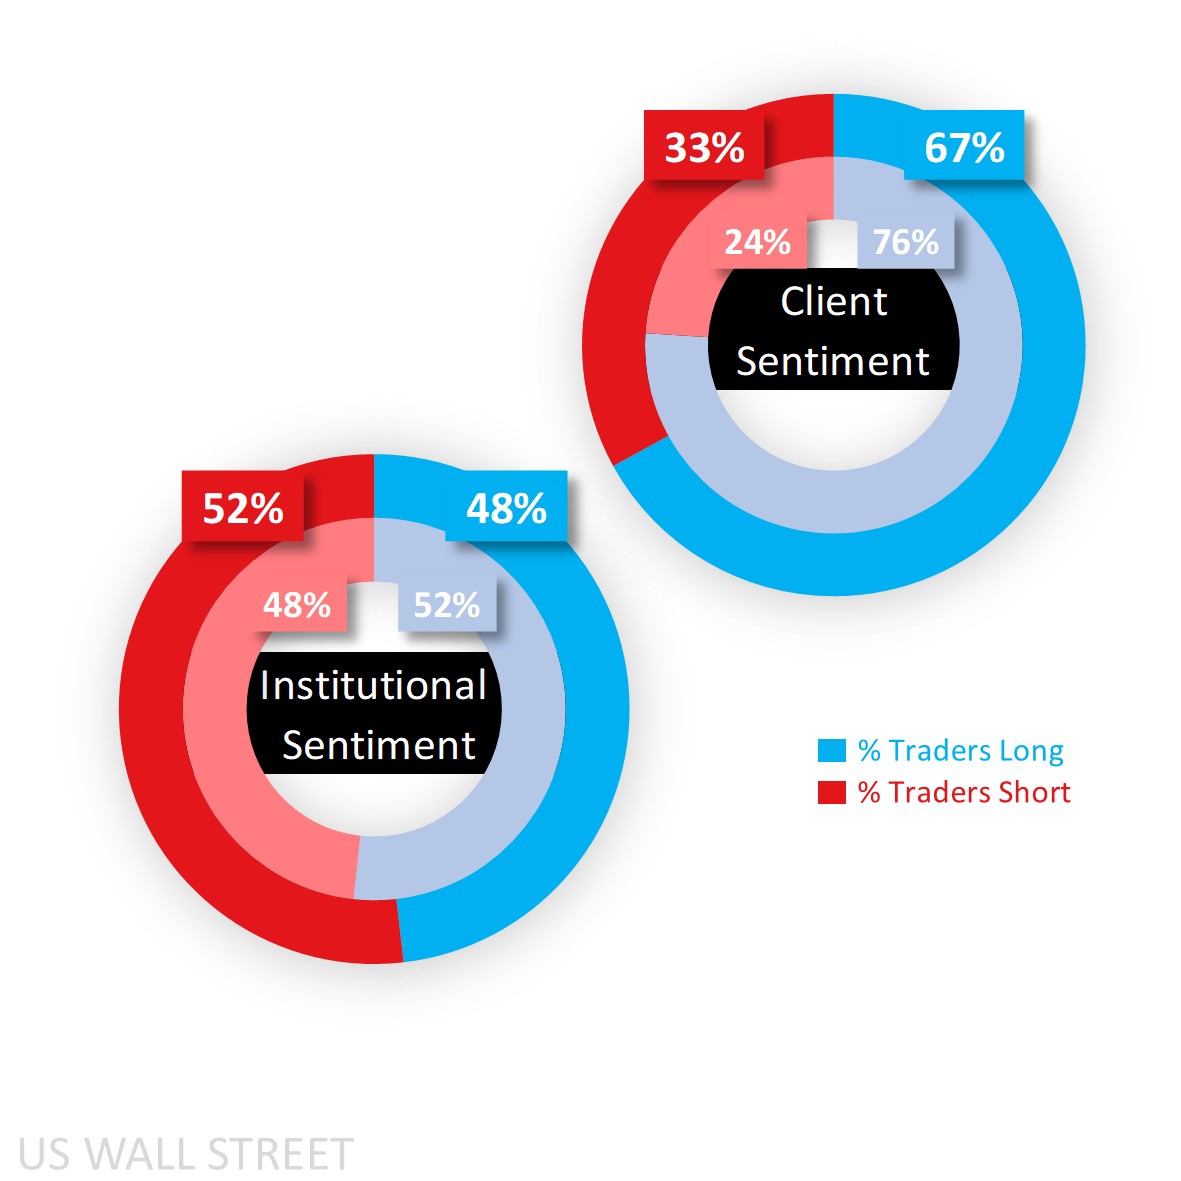
Capital.com’s client sentiment for Dow 30
Client sentiment was near extreme buy territory at the start of last week before the rangebound price action saw some longs unwind and shorts initiate, reducing the heavy buy sentiment to 67% at the start of this week before the early pullback took it back up to 74% as fresh and range-trading shorts closed out. They remain majority buy in the S&P 500 (75%), Nasdaq 100 (71%) and Russell 2000 (74%).
When it comes to CoT speculators, we’ve gotten a shift in sentiment from a previous net long 52% to a net short 52% on a reduction in longs (by 1,381 lots) and a simultaneous increase in shorts (1,587). Looking at the other key U.S. equity indices and they also shifted in the Russell (from a net long 52% to a net short 52%), raised their net sell bias in the S&P (from 59% to a heavy 65%), while increased their net long sentiment in the Nasdaq (from 54% to 57%).
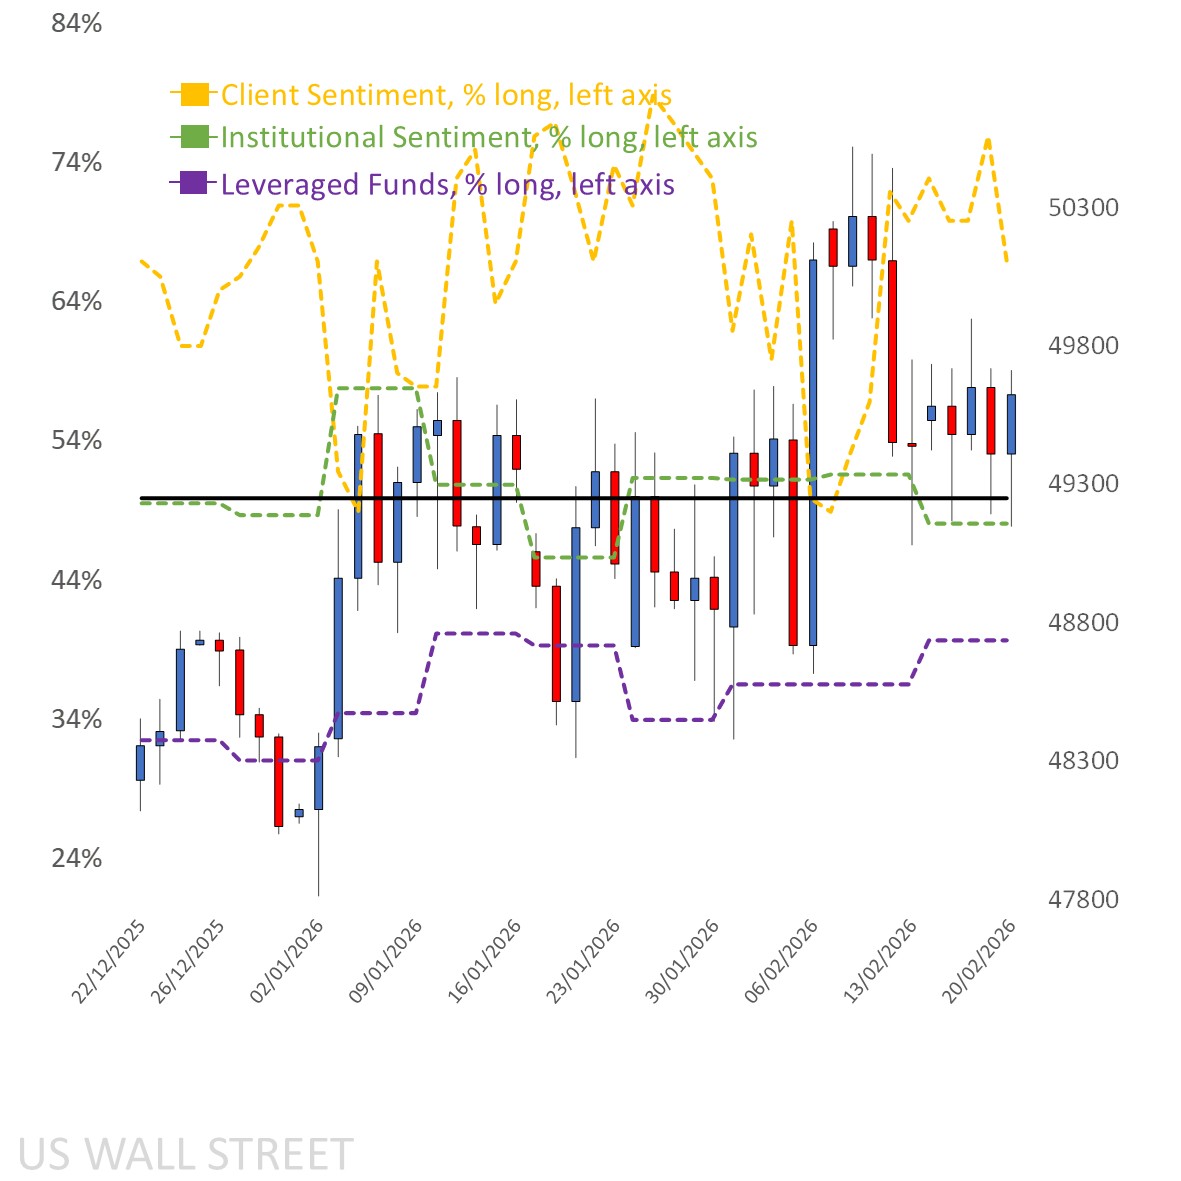
Client sentiment mapped on the daily chart
 Source: Capital.com
Period: December 2025 – February 2026
Past performance is not an indicator of future results.
Dow 30’s chart on Capital.com’s platform with key technical indicators
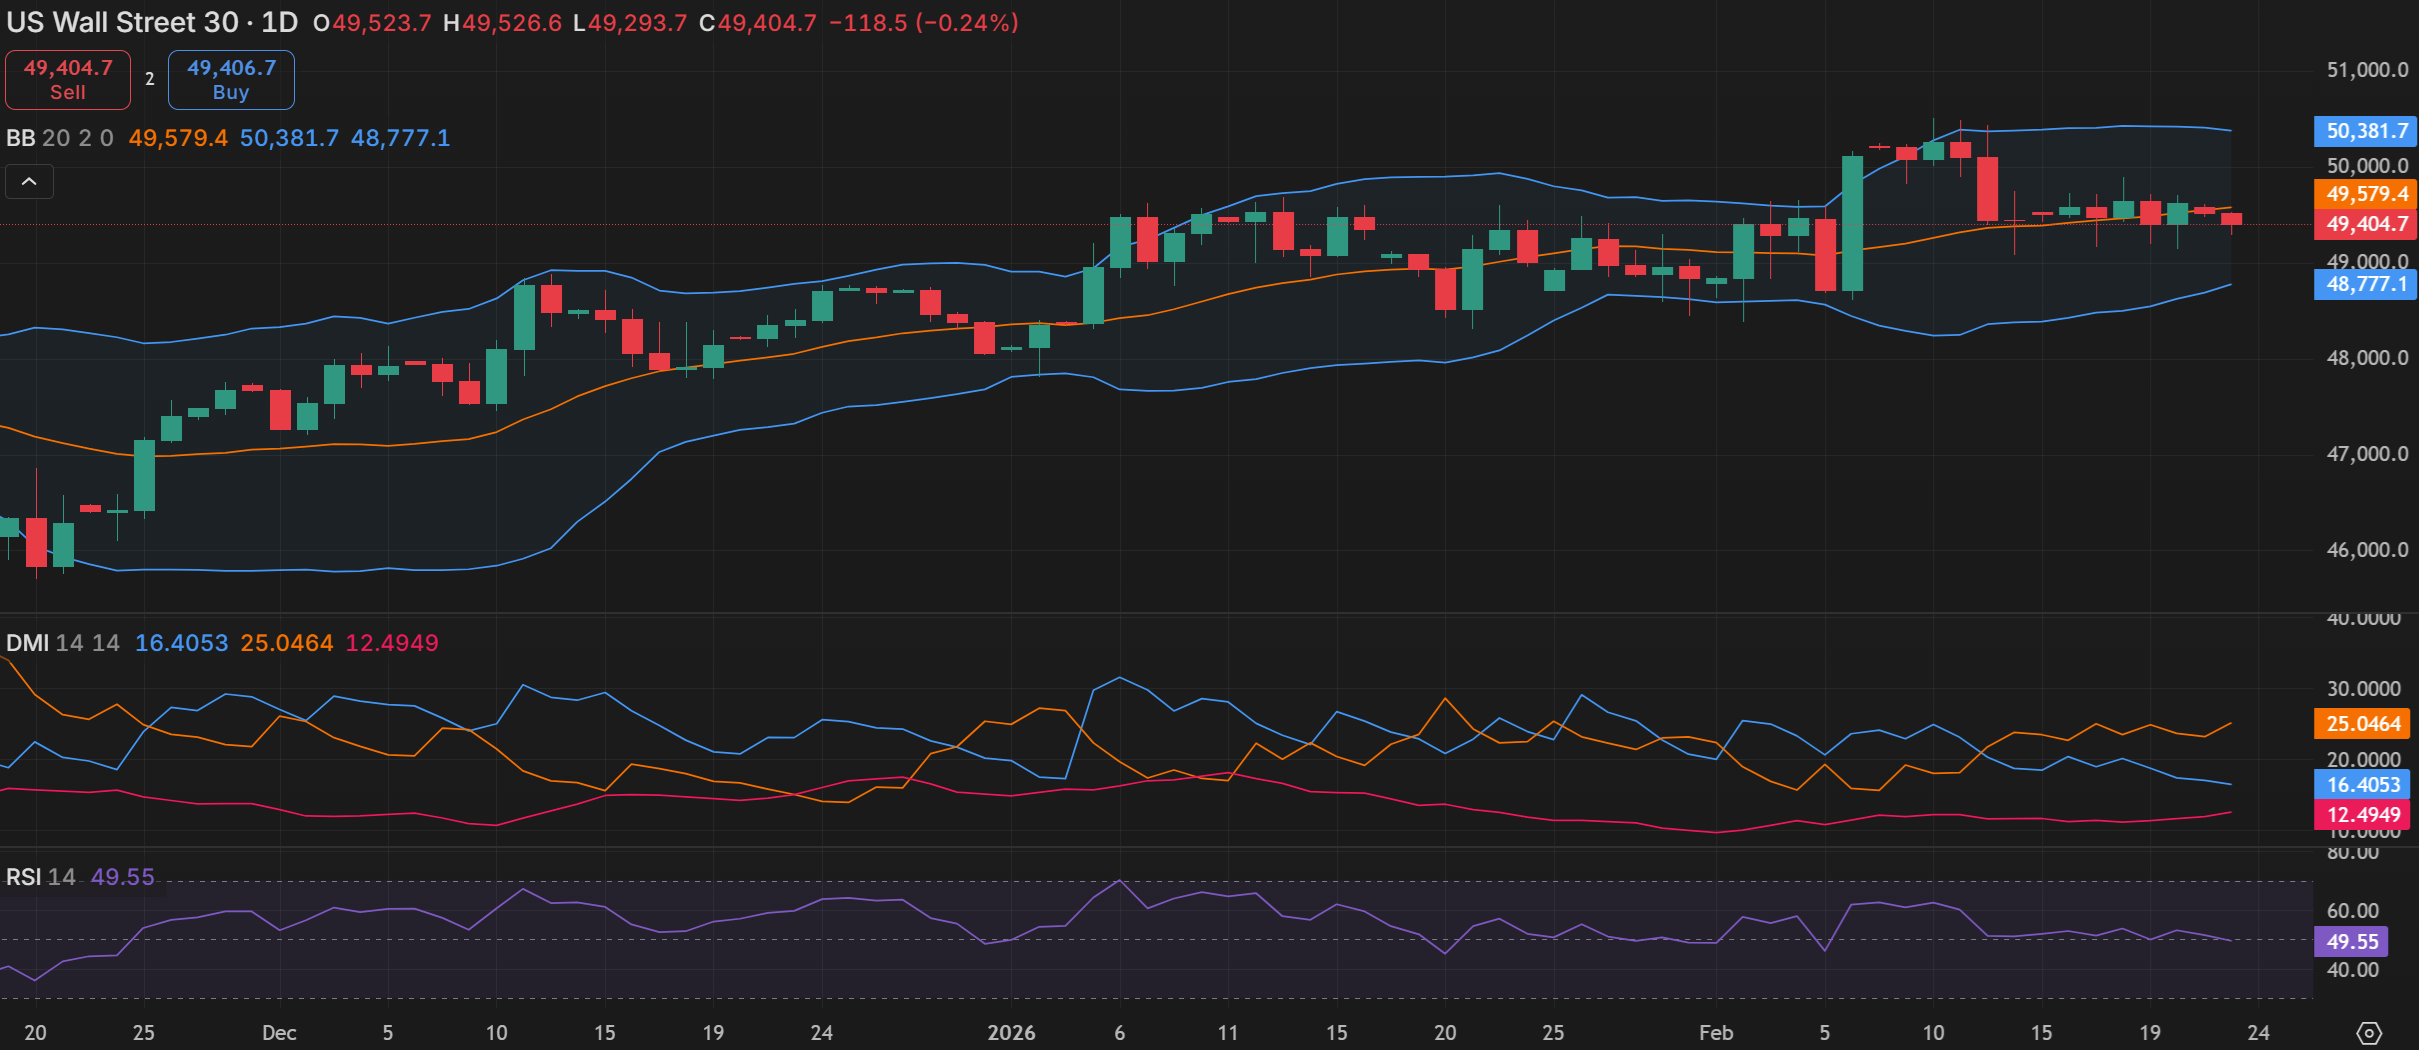
Source: Capital.com
Period: November 2025 – February 2026
Past performance is not an indicator of future results.