Trading the Nasdaq 100 Ahead of Earnings from Big Tech
Technicals are flashing green in the key time frames, and in sentiment CoT speculators remain net long while retail traders are majority short.
U.S. equity index futures are steady following last week’s record close where the tech-heavy Nasdaq 100 (w/w +2.4% to 27,303) lead while the Dow 30 (w/w -0.4% to 49,230) lagged. Within the semiconductor sphere, shares of Nvidia (+4.3%) jumped to a record close enjoying a market cap that’s back above $5tn, with chipmakers broadly lifted by a strong earnings catalyst from Intel (+23.6%), which was upgraded by Roth to buy doubling its price target. There were also stellar gains for TSM (+5.2%) as the Taiwanese regulator plans to loosen limits on funds’ allocation to single stocks, AMD (+13.9%) upgraded by DA Davidson to buy combined with a massive hike in its price target, Arm (+14.8%), and Qualcomm (+11.1%).
Legacy software stocks were also mostly stronger this time around with SAP (+7.4%) advancing on cloud-driven earnings beat while ServiceNow (+6.4%) stabilized following a sharp prior-session selloff tied to geopolitical disruptions.
Over in the bond market, Treasury yields edged slightly higher for the week, and market pricing (CME’s FedWatch) shows a fully priced-in hold for the upcoming FOMC (Federal Open Market Committee) decision with expectations for policy to remain unchanged throughout the year and only minority likelihoods of a rate cut.
Speaking of the Federal Reserve (Fed), the Department of Justic (DOJ) dropped its criminal investigation of Chairman Powell to clear the main hurdle for Kevin Warsh to lead the central bank as Senator Tillis says he plans to support the nominee, even as the DOJ says it could reconsider opening the investigation against Powell after Warsh’s confirmation.
Energy prices are still an item financial market participants are noting even if the tech-heavy index as been unfazed by it as of late, with relatively contained moves for oil prices (WTI) hovering around $96 after peace talks failed to progress over the weekend with President Trump saying if they want to talk they can “call” but an Axios report saying Iran offered the U.S. a deal to reopen the Strait of Hormuz and end the war.
In terms of economic data, UoM’s (University of Michigan) consumer sentiment for April was revised higher to 49.8 but still suffered a record low, with inflation expectations remaining high for the one-year print at 4.7% (from a preliminary 4.8% reading) and the five-year at 3.5% (from 3.4%).
Week ahead
There’s relatively little on offer when it comes to the economic calendar today, but it’ll pick up from tomorrow onwards with CB’s (Conference Board) consumer confidence and housing price data, the Federal Reserve expected to hold on rates this Wednesday, advance GDP (Gross Domestic Product) and PCE (Personal Consumption Expenditures) price index on Thursday, and ISM’s (Institute for Supply Management) manufacturing PMI (Purchasing Managers’ Index) on Friday.
But the real test on the tech front is from the quarterly earnings releases that we’ll get from Microsoft, Amazon, Alphabet, and Meta on Wednesday, and Apple on Thursday. Big Tech is generally what has been holding up this market with sizable inflows from investors, and that means they’ll need to beat on their respective metrics, offer generous guidance, and commit or even increase capex to ensure healthy figures for chipmakers down the line.
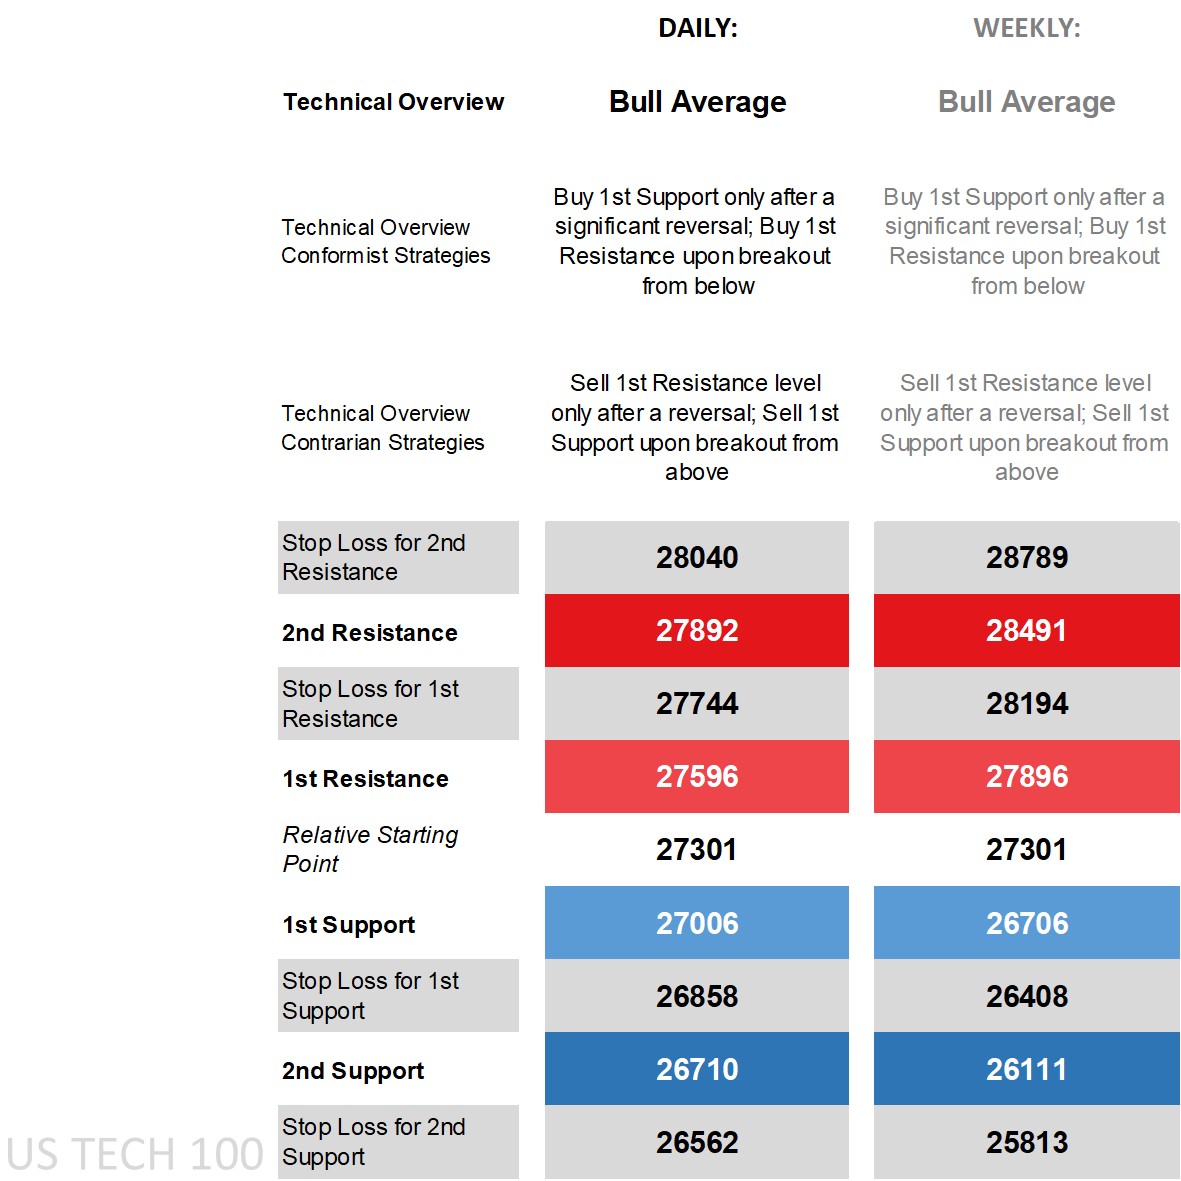
Nasdaq 100’s technical overview, strategies and levels
Looking at the daily time frame and price is above all its main moving averages (MA) and near the upper end of the widening Bollinger Band after price walked the upper band earlier this month, on the DMI (Directional Movement Index) front the +DI well over the -DI ensuring it’s labelled as positive, an RSI (Relative Strength Index) still stuck in overbought territory for roughly two weeks now, and an ADX (Average Directional Movement Index) soaring well into trending territory.
That has meant a ‘bull average’ technical overview after shifting from ‘consolidation – volatile’ on the daily time frame, with the latter’s conformist strategies focused on breakout strategies (and favored buy-breakout trades on the move higher), while the former utilizes buy strategies be it via breakout off the 1st Resistance or via significant reversal off the 1st Support only initiating if price goes beneath it sizably and recovers back to the key level. Contrarian strategies were reversals but have now shifted to sell via reversal off the 1st Resistance and sell via breakout off the 1st Support, and is reserved for those who don’t see the current technical overview holding.
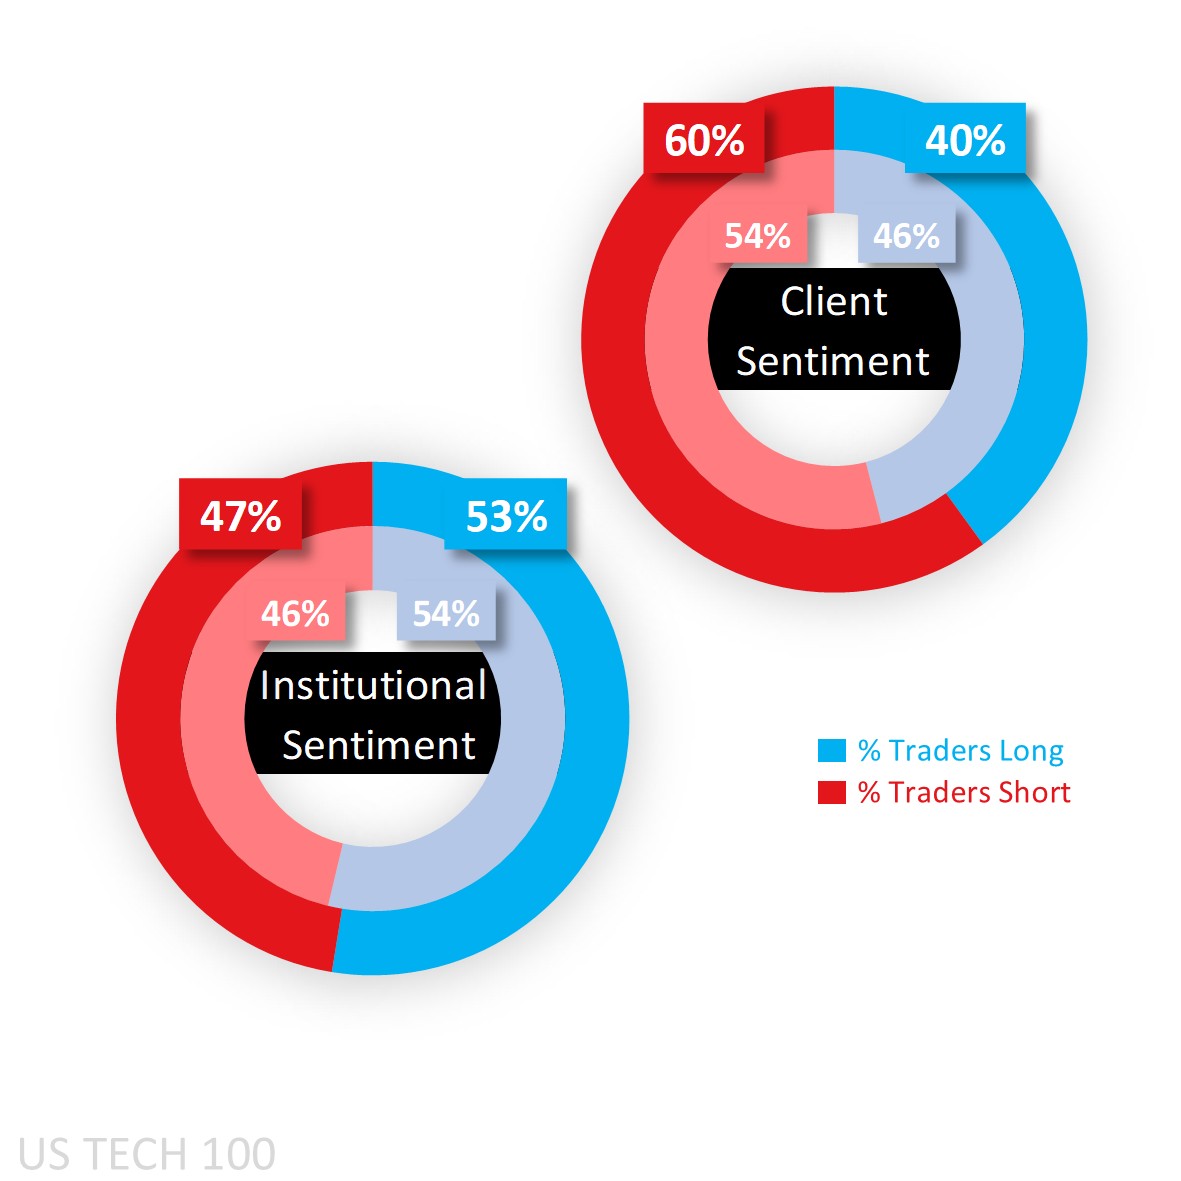
Capital.com’s client sentiment for Nasdaq 100
Client sentiment for Capital.com’s traders are pushing further into majority sell territory, from a slight sell 54% last Friday to a more moderate 60% as of this morning, with the pullback in the futures market off the intraday highs seeing some fresh shorts quick to unwind and get out fearing potentially getting stuck in another move higher.
Larger speculators according to the latest CoT (Commitment of Traders) report remain net long albeit trimmed to just 53% on a drop in long positioning (by 1,100 lots) and a simultaneous increase in shorts (by 1,932). They remain net short in the S&P 500 (60%), Dow 30 (54% from 64% prior) and Russell 2000 (54% from 53%).
Client sentiment mapped on the daily chart
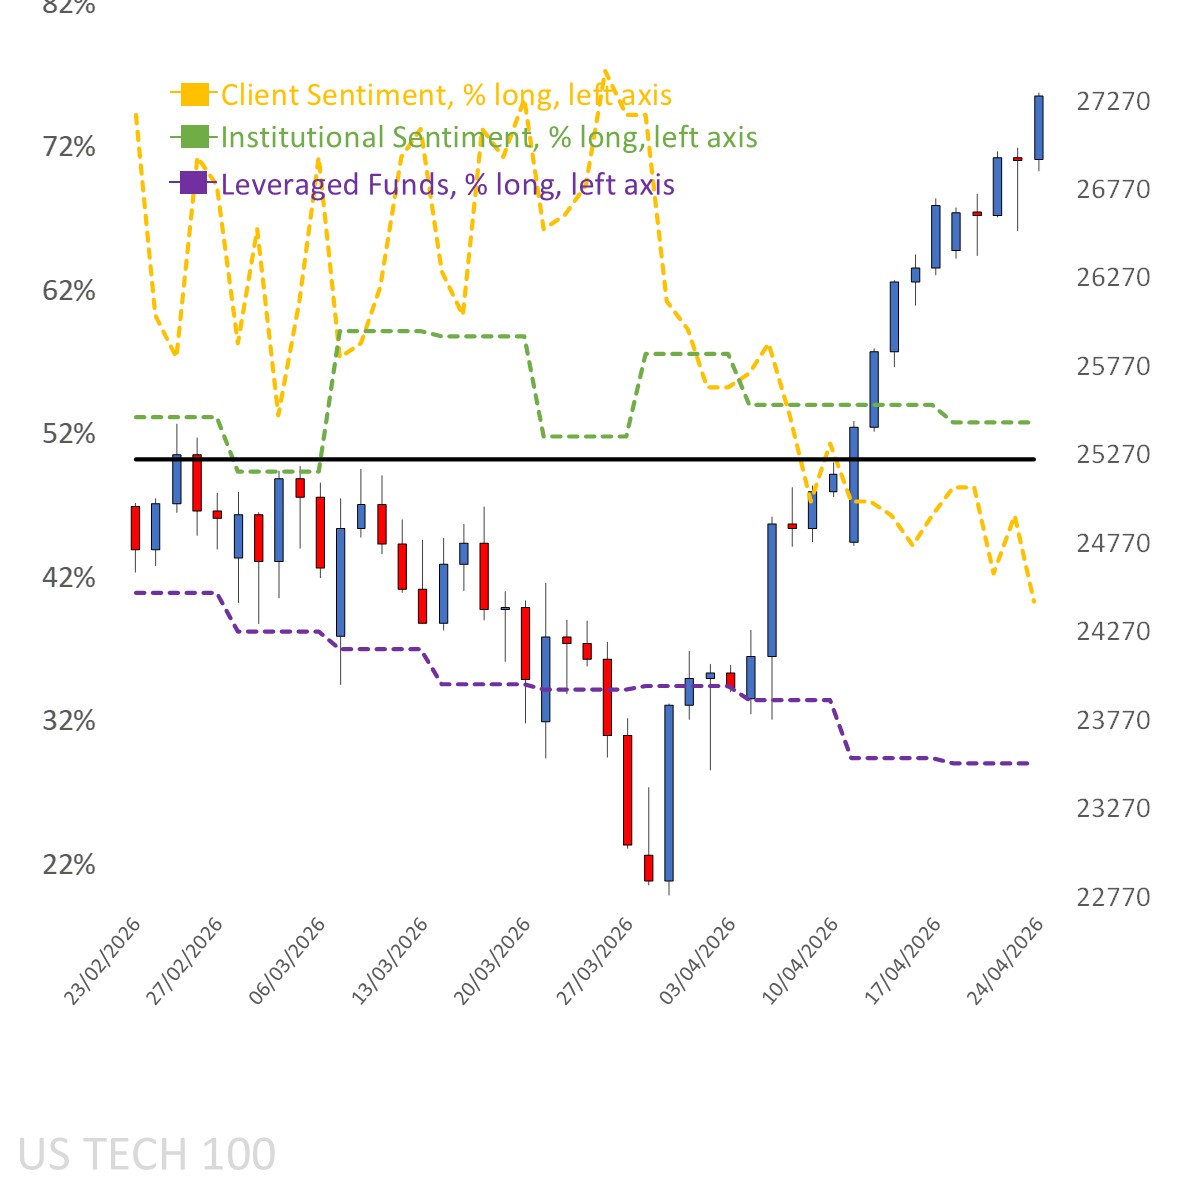 Source: Capital.com
Period: February 2026 – April 2026
Past performance is not an indicator of future results.
Nasdaq 100’s chart on Capital.com’s platform with key technical indicators
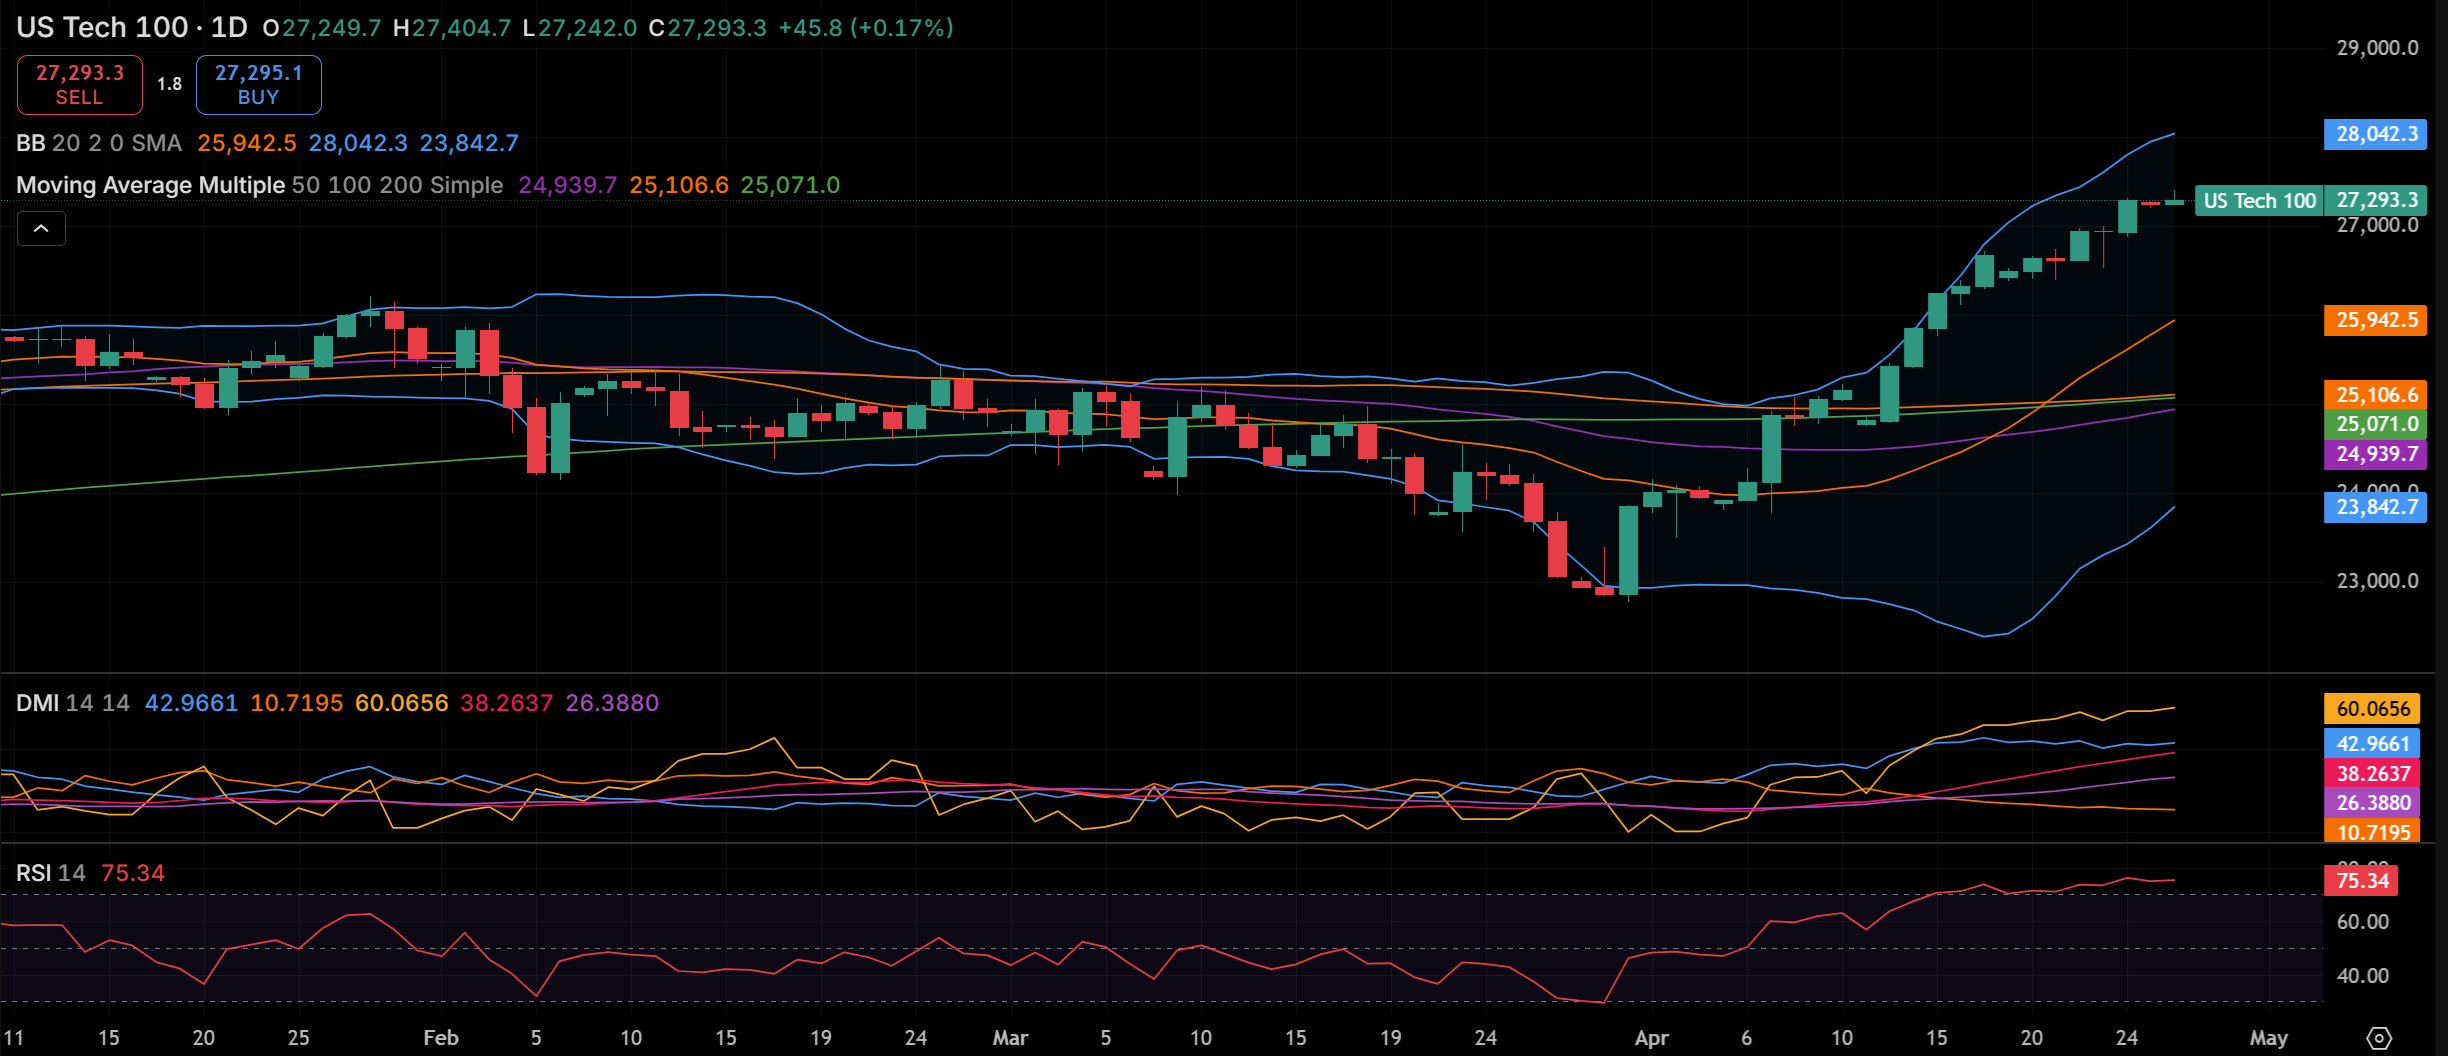
Source: Capital.com
Period: January 2026 – April 2026
Past performance is not an indicator of future results.