US Wall Street 30 forecast: Middle East tensions, rising VIX
US Wall Street 30 (Dow Jones Industrial Average), which tracks 30 leading US companies, trades amid heightened risk aversion as Middle East tensions lift oil and gold prices and push volatility measures such as the VIX higher. Past performance is not a reliable indicator of future results.
The Dow Jones Industrial Average Index – referred to as the US Wall Street 30 (US30) on CFD trading platforms such as Capital.com – is trading around $48,762 as of 3:56pm UTC on 2 March 2026, moving within an intraday range of $48,203–$49,323.6 on the Capital.com platform. Past performance is not a reliable indicator of future results.
The move comes amid broader risk-off sentiment, as Wall Street’s main indices trade lower on concerns that an escalating Middle East conflict could disrupt global trade and sustain inflation pressures. Volatility gauges such as the VIX have risen, while oil prices have increased alongside gains in traditional safe havens such as gold (Reuters, 2 March 2026).
US Wall Street 30 forecast 2026–2030: Third-party targets
As of 2 March 2026, third-party US Wall Street 30 predictions how a wide range of outcomes through 2026 and beyond. Most third-party forecasters indicate moderate upside from late-February levels, although they differ in their assumptions about timing, magnitude and volatility. The following six external forecasts, all published in February or early March 2026, illustrate how cycle-, pattern- and sentiment-based approaches translate into specific numerical targets and ranges.
Long Forecast (cycle path)
Long Forecast projects the Dow Jones at 48,977 points at the start of March 2026, ending the month near 48,952, before gradually rising to about 60,255 by December 2026 and extending towards roughly 75,060 by January 2028. It bases these month-by-month levels on long-term price cycles and seasonal patterns, within an environment of tightening but still supportive financial conditions and intermittent volatility shocks (Long Forecast, 2 March 2026).
CoinPriceForecast (stepwise targets)
CoinPriceForecast estimates that the Dow Jones could reach about 50,000 by mid-2026 and approximately 52,444 by year-end 2026, before climbing towards 56,896 by the end of 2027 and 61,004 by the end of 2029. The service states that these stepwise targets derive from extrapolated historical performance and statistical modelling. It conditions the projected path on continued earnings growth and stable monetary policy, alongside elevated but contained geopolitical risks (CoinPriceForecast, 2 March 2026).
Wallet Investor (futures curve profile)
Wallet Investor projects Dow Jones 30 futures prices mostly in the high-$38,000s to just under $40,000 across 2026–2027. For example, its latest table shows a forecast opening level of about $38,525.77 and a closing level near $38,759.04 for April 2026. It attributes this relatively tight futures profile to a technical-indicator framework and pattern-recognition models, reflecting expectations of continued but more measured momentum as markets digest interest rate and growth signals (Wallet Investor, 2 March 2026).
Predictions and third-party forecasts are inherently uncertain, as they cannot fully account for unexpected market developments. Past performance is not a reliable indicator of future results.
US30 index price: Technical overview
The US30 index is trading near $48,762 as of 3:56pm UTC on 2 March 2026, sitting just below the classic pivot at 49,388 and beneath a tight moving-average band on the daily chart. The short-term SMA cluster is positioned across the 20-, 50-, 100- and 200-day moving averages at roughly 49,475, 49,107, 48,121 and 46,217 respectively, leaving price between the 50- and 100-day reference levels.
Momentum appears limited, with the 14-day RSI around 43 and the ADX near 11, suggesting a weak or range-bound environment rather than a sustained directional trend. On the topside, the first level to monitor is the classic R1 pivot near 50,103. A sustained daily close above this area could bring the 51,227 R2 region back into focus as a broader resistance zone.
On pullbacks, initial support lies around the 49,388 pivot, while the 100-day SMA near 48,121 may act as the next technical reference. A daily close below that moving-average area would increase the likelihood of a move towards the 48,263 S1 zone (TradingView, 2 March 2026).
This technical analysis is provided for informational purposes only and does not constitute financial advice or a recommendation to buy or sell any instrument.
US Wall Street 30 index history (2024–2026)
The US Wall Street 30 index has climbed from the low-$38,000s in early March 2024 to around 48,763 on 2 March 2026, marking a notable two-year upswing punctuated by several pauses and pullbacks. The index spent much of mid-2024 consolidating around 39,000–41,000, then moved through 40,000 and held above that level into late 2024, as dips towards the high-$37,000s and low-$40,000s were repeatedly absorbed.
Momentum accelerated in 2025, with US30 breaking into the low-$40,000s by spring and then trending higher through the year, closing near 47,542 on 2 December 2025 before edging into the high-$48,000s at the turn of 2026. By late February 2026, the index traded around the mid-$49,000s. Although it has since eased back towards the high-$48,000s in early March, it remains well above its levels from one and two years earlier.
Past performance is not a reliable indicator of future results. Share prices are indicative and may differ from live market prices.
US Wall Street 30 (US30): Capital.com analyst view
The US Wall Street 30 has delivered a sustained advance over the past two years, rising from the high-$30,000s in early 2024 to trade around the high-$48,000s as of 2 March 2026. The path, however, has included several sharp swings rather than a continuous upward move. Resilient US corporate earnings and the Dow’s tilt towards larger, cash-generative companies have supported performance, particularly when expectations build for easier Federal Reserve policy and a so-called soft-landing scenario for the US economy.
At the same time, the index’s higher starting level may increase sensitivity to negative surprises. Slower growth, margin compression or shifts in valuation assumptions could weigh on prices if investors reassess how much positive news is already reflected in valuations.
More recently, the backdrop has become more volatile. Concerns about conflict in the Middle East, firmer oil prices and persistent inflation have weighed on risk appetite, with US indices softening and volatility measures edging higher as market participants reassess the balance between geopolitical risk and central-bank support. A de-escalation in tensions, stabilising energy prices or clearer communication from the Federal Reserve on its rate path could support sentiment. However, renewed volatility remains possible as markets continue to react to macroeconomic and policy developments.
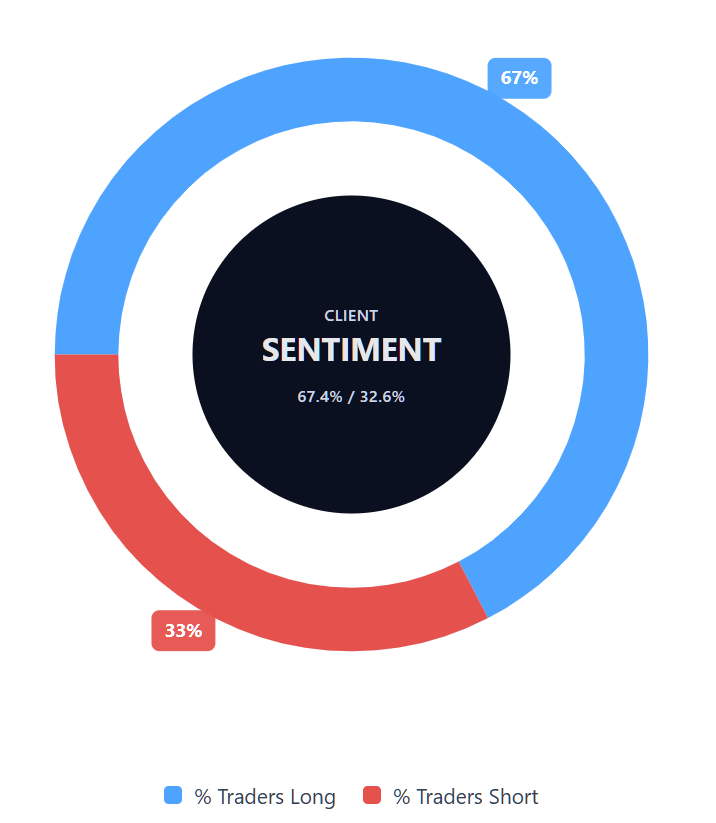
Capital.com’s client sentiment for US Wall Street 30 CFDs
As of 2 March 2026, Capital.com client positioning in US Wall Street 30 CFDs shows 67.4% buyers versus 32.6% sellers. This represents a majority net-long bias of approximately 34.8 percentage points. The data reflects open positions on the Capital.com platform and can change over time as traders adjust their exposure. Client sentiment is not a reliable indicator of future price movements.
Summary – US Wall Street 30 2026
- As of 3:56pm UTC on 2 March 2026, US Wall Street 30 (US30) trades near $48,762, above its early-2024 levels following a choppy two-year advance.
- Daily technical indicators show the price below its 10–50-day moving average cluster, while the relative strength index (RSI) appears neutral and the average directional index (ADX) signals limited trend strength. This combination may indicate consolidation rather than a clearly defined trend.
- Key drivers include corporate earnings performance, expectations for Federal Reserve policy, valuation dynamics and shifts in risk appetite as investors weigh growth prospects against financial conditions.
- Recent news flow highlights pressure on US indices linked to Middle East conflict risks, higher oil prices and inflation concerns, alongside the potential for sentiment to shift should geopolitical or macroeconomic conditions stabilise.
Past performance is not a reliable indicator of future results.
FAQ
What is the 5 year US Wall Street 30 forecast?
Five-year forecasts for US Wall Street 30 vary widely and depend on the methodology used. Some third-party models project gradual gains based on historical trends and earnings growth assumptions, while others highlight more moderate or volatile paths. Long-term projections typically factor in corporate earnings, interest rate policy, economic growth and geopolitical risks. As with all forecasts, they are subject to uncertainty, and actual outcomes may differ materially from published estimates.
Is US Wall Street 30 a good CFD to trade?
Whether US Wall Street 30 is suitable for CFD trading depends on your objectives, risk tolerance and trading strategy. The index often reflects developments in major US companies and can respond to macroeconomic data, earnings reports and geopolitical events. This can create opportunities, but also increases the risk of volatility. CFDs are leveraged products, which means both gains and losses can be amplified. It’s important to understand the risks before trading.
Could US Wall Street 30 go up or down?
US Wall Street 30 can move in either direction depending on a range of factors. Corporate earnings, Federal Reserve policy, inflation data, economic growth expectations and global events can all influence price action. Periods of optimism may support higher levels, while weaker data or rising uncertainty may weigh on the index. Market sentiment can shift quickly, particularly during news-driven sessions, so price movements are rarely linear or predictable.
Should I invest in US Wall Street 30?
Deciding whether to invest or trade US Wall Street 30 depends on your financial situation, goals and risk appetite. The index provides exposure to large, established US companies, but its value can fluctuate in response to economic and market developments. If you are considering trading CFDs, remember that leverage increases risk as well as potential return. You may wish to carry out your own research and consider seeking independent financial advice.
Can I trade US Wall Street 30 CFDs on Capital.com?
Yes, you can trade US Wall Street 30 CFDs on Capital.com. Trading index CFDs lets you speculate on price movements without owning the underlying asset and to take long or short positions. However, contracts for difference (CFDs) are traded on margin, and leverage amplifies both profits and losses. You should ensure you understand how CFD trading works, assess your risk tolerance, and recognise that losses can occur quickly.