Nasdaq 100: Trading US CPI
Futures up on Nvidia’s China sales resumption of AI chips, but the next test is US pricing data.
The focus has certainly shifted, from the weekend tariff announcement on Canada and Mexico causing the market to gap lower, only for the gap to get filled as hopes remain high duties on imports into the US will be negotiated lower ahead of the August 1 date, else potentially pushed out further to allow room for talks to progress. Either way, it was a calm finish for the tech-heavy Nasdaq 100 up 0.3%, but then came news regarding Nvidia’s resumption of H20 AI chips sales to China thanks to the green light from the US government, already taking price close to today’s daily 1st Resistance level (see below).
While no doubt a positive catalyst that’ll help semiconductor stocks see a positive open be it ‘AI engine’ Nvidia or its key peers in the industry, there’s another key item on offer later today on the economic data front. CPI (Consumer Price Index) for the month of June will be in focus, and not just because inflation is above the Federal Reserve’s (Fed) 2% target, but because both the central bank and market participants want to better understand the impact of tariffs on consumer prices, even if the full impact of tariffs have yet to be felt given uncertainty regarding what the final figures will be on key US trading partners.
Expectations are that we’ll see re-acceleration taking the y/y (year-on-year) headline figure from 2.4% to 2.7%, and when excluding food and energy a climb back up to 3% from 2.8%. The m/m (month-on-month) figures will no doubt be noted, and they’re expected to be a little too high for comfort with both headline and core seen rising 0.3%. Other items include Empire’s manufacturing index for July, and a few FOMC (Federal Open Market Committee) members speaking at a time when market pricing (CME’s FedWatch) isn’t far off fully pricing in the Fed holding on rates this month with majority (but insignificant) odds for September in favor of a 25bp (basis point) cut, though all that could tilt depending on today’s numbers. There’s also earnings from a few financial heavyweights, though likelier to impact indices where they are both present and have a significant weighting.
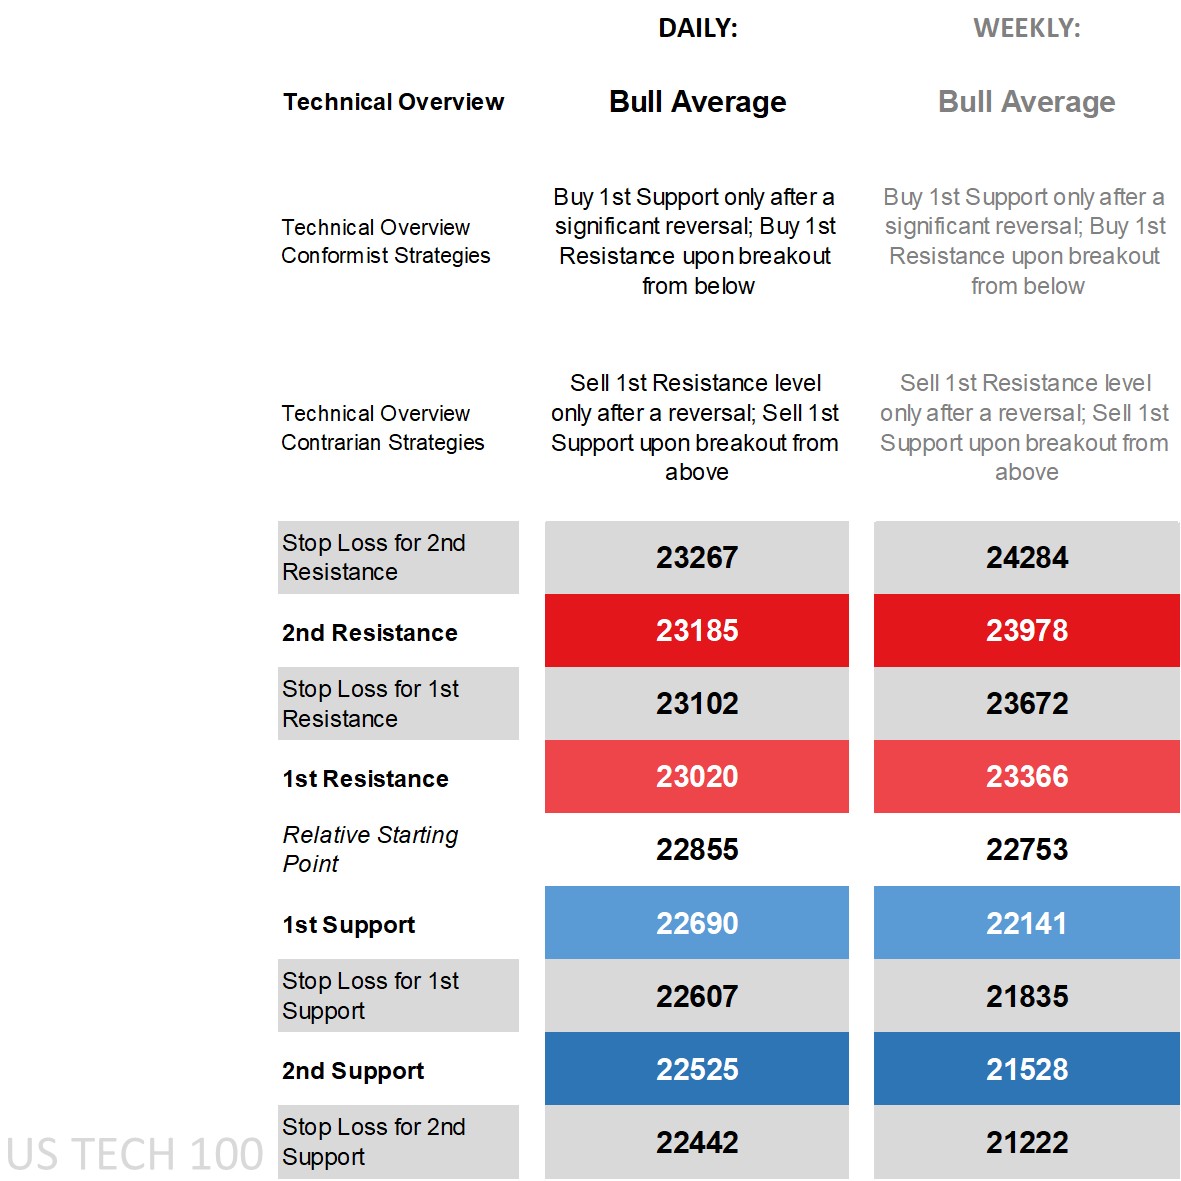
Nasdaq 100’s technical overview, strategies and levels
Starting with the daily time frame, and price is above all its main moving averages, not far off the upper end of the Bollinger Band, with an RSI just shy of overbought territory, somewhat of a margin on the DMI (Directional Movement Index) front for the +DI over the -DI, and an ADX (Average Directional Movement Index) in trending territory. That easily translates into a bullish technical overview, in this case ‘bull average’ that’s matching the weekly time frame which incorporates more historic bias and requires more to shift key technicals and in turn, its technical overview.
On the strategic front, a bullish overview puts buy strategies in the conformist camp and sell strategies for contrarians, but keep in mind that price nearing today’s 1st Resistance level is due to fundamental factors, and on a day where another fundamental event is on offer that should pricing data come in hotter usually hitting risk appetite with the opposite true potentially giving the upside gains an added boost that could go well beyond key levels and more so if price hovers near it before the data releases.
That means fading strategies ought to be shelved given the higher propensity of getting stopped out in the face of an uptick in volatility, with buys off the 1st Support only via significant reversal and those daring a sell strategy (who are part of the contrarian camp) off the 1st Resistance doing so only after a reversal. It’s naturally not as common a sight to see price reaching the 2nd levels and more so on the weekly time frame, but if it gets there some of the same logic can apply for conformists and contrarians depending on their respective risk appetite.
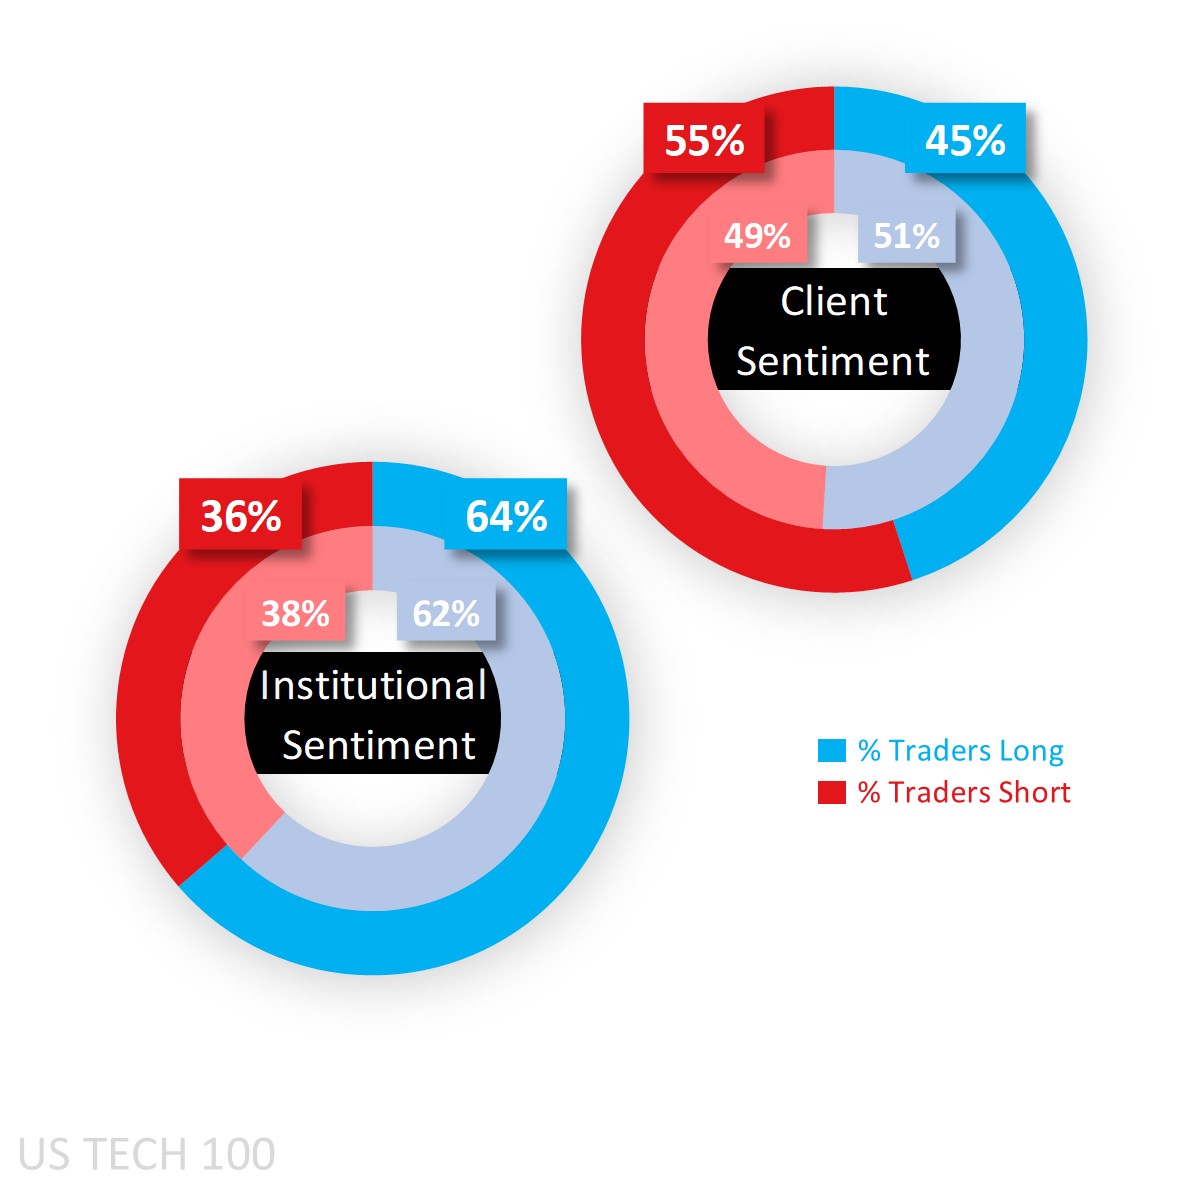
Capital.com’s client sentiment for Nasdaq 100
As for sentiment, we’ve got a shift among Capital.com’s clients from what was a slight buy 51% at the start of the week to a majority short 55% this morning following the price increase, and looking at the yellow-dotted line below where sentiment is mapped on the chart (corresponding to the left axis as % long) shows it’s been a story of multiple shifts in sentiment for a few weeks now as they try to range-trade some of these moves.
CoT (Commitment of Traders) speculators are net long and have taken that bias a couple notches higher to 64% as of last week according to the latest report released out of the CFTC. That was due to a rise in longs (by 3,176 lots) and a simultaneous drop in shorts (by 1,557), as they slowly raise their net long bias (green-dotted line in the chart below) tracking price higher.
Client sentiment mapped on the daily chart
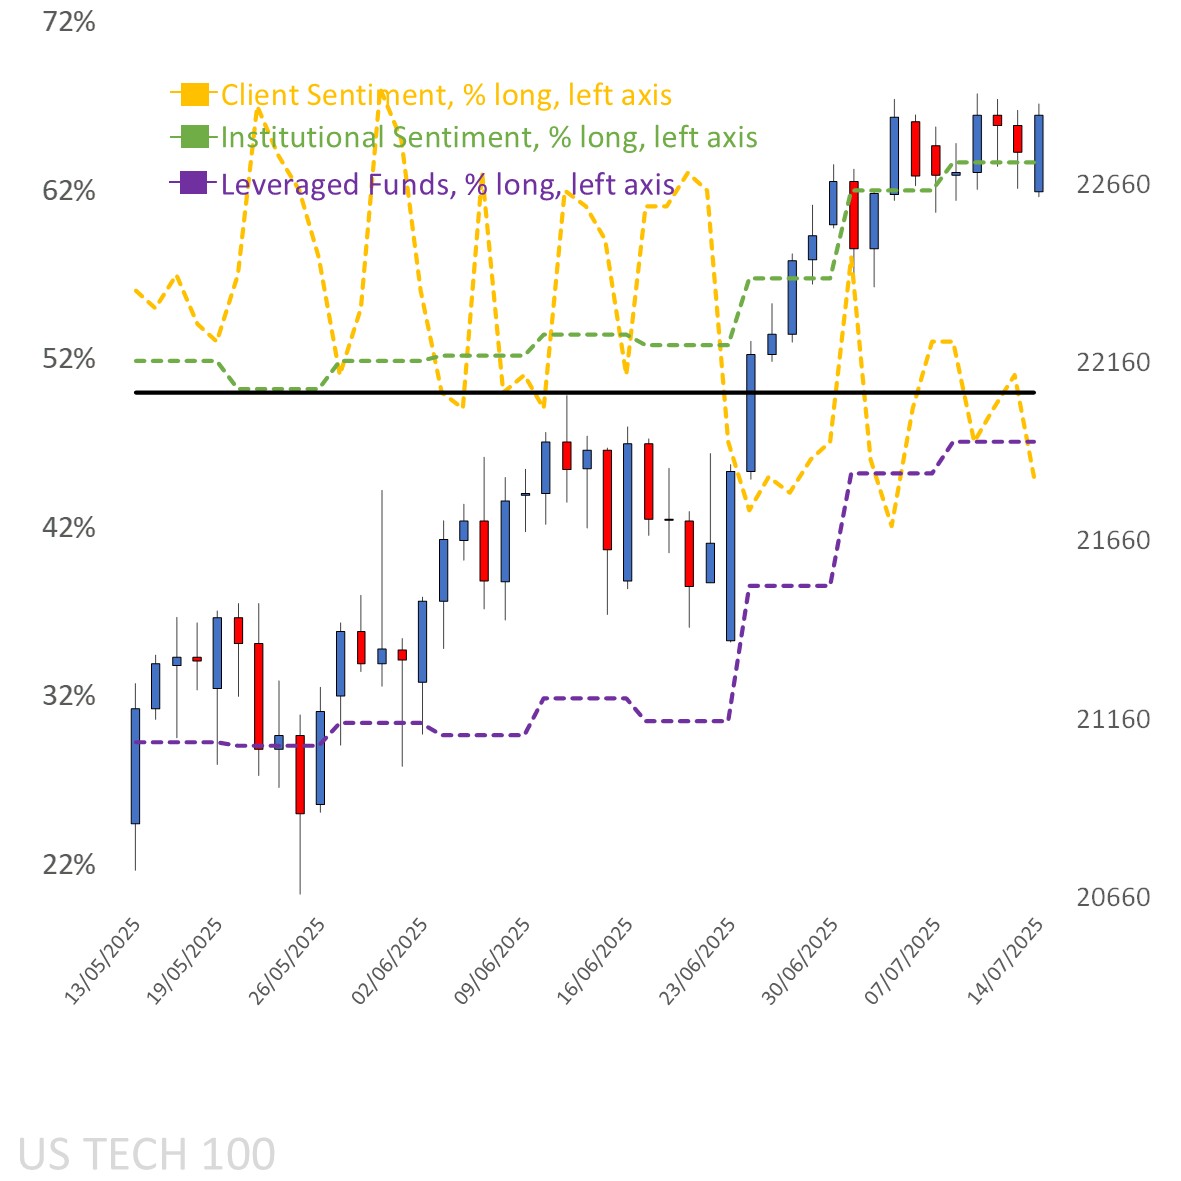
Source: Capital.com
Period: May 2025 – July 2025
Past performance is not an indicator of future results.
Nasdaq 100’s chart on Capital.com platform with key technical indicators
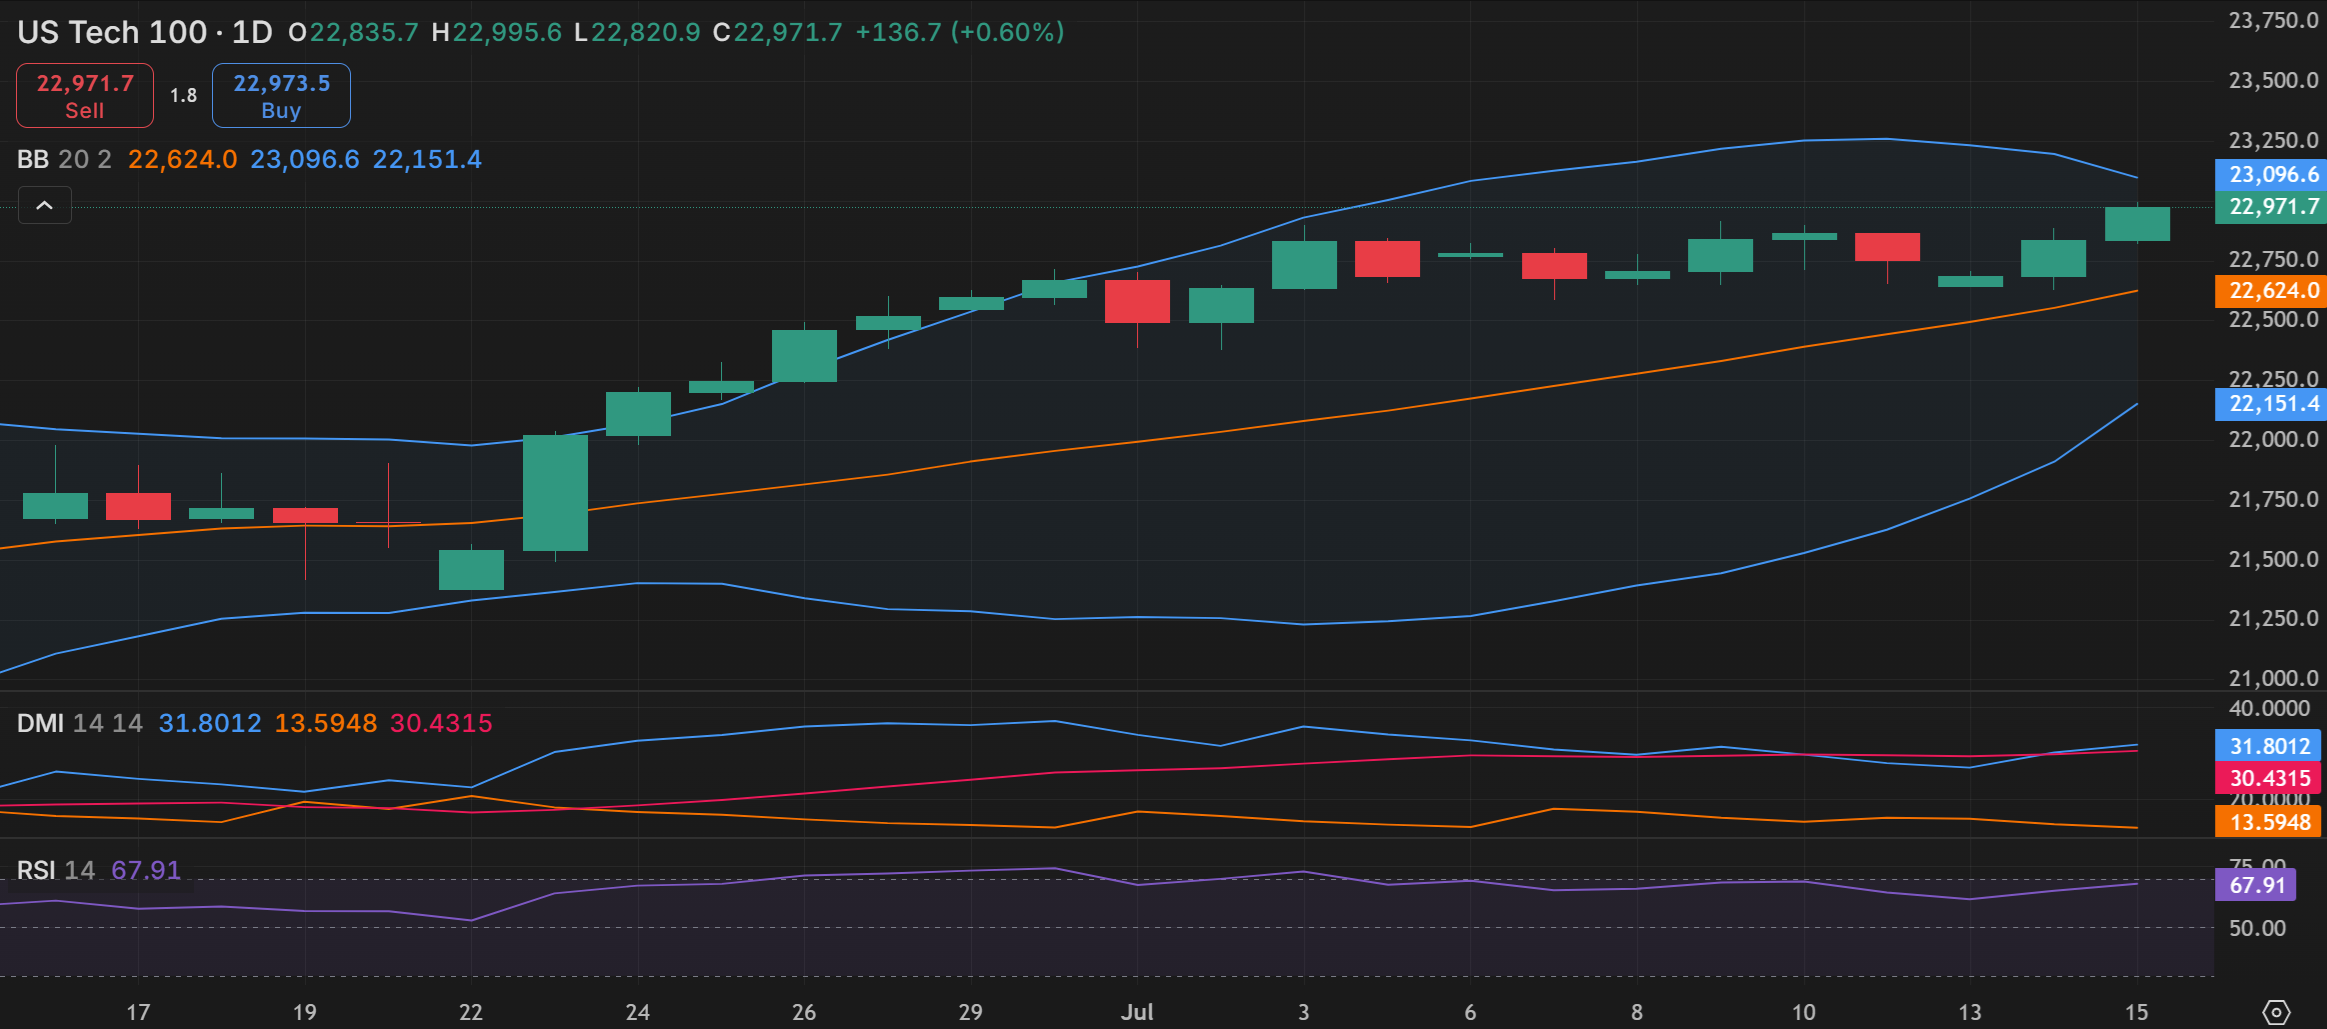 Source: Capital.com
Period: June 2025 – July 2025
Past performance is not an indicator of future results.
RISK DISCLAIMER
CFDs are complex instruments and come with a high risk of losing money rapidly due to leverage. 82.12% of retail investor accounts lose money. You should consider whether you understand how CFDs work and whether you can afford to take the high risk of losing your money.
Past performance is no guarantee of future results. Professional clients can lose more than they deposit. All trading involves risk.
RESEARCH DISCLAIMER
THE PRESENT MATERIAL MUST BE REGARDED AS MARKETING COMMUNICATION AND SHOULD NOT BE INTERPRETED AS INVESTMENT RESEARCH OR INVESTMENT ADVICE.
The content of this communication has been prepared solely for information purposes and should be considered as such. This communication does not constitute research in accordance with the legal requirements designed to promote investment research independence. While the information in this communication, or on which this communication is based, has been obtained from sources that Capital.com believes to be reliable and accurate, it has not undergone independent verification. No representation or warranty, whether expressed or implied, is made as to the accuracy or completeness of any information obtained from third parties.
The information provided as at the date of this communication is subject to change without prior notice. It does not take into consideration the investors’ individual circumstances or objectives and should not be construed as specific advice on the suitability of any investment decision. Investors should consider this report as merely one factor in making any investment decisions. To the extent permitted by law, neither Capital.com nor any of its employees or affiliates accept any liability whatsoever for any direct or consequential loss arising, directly or indirectly, from any use of this communication or its contents. Any person acting on the information does so entirely at their own risk. Any information that may be provided in this communication relating to past performance is not a reliable indicator of future results or performance.
Capital Com Online Investments Ltd is a limited liability company with company number 209236B. Capital Com Online Investments Ltd is a Company registered in the Commonwealth of The Bahamas and authorised by the Securities Commission of The Bahamas with license number SIA-F245. The Company’s registered office is at #3 Bayside Executive Park, Blake Road and West Bay Street, P. O. Box CB 13012, Nassau, The Bahamas.