Trading the Dow 30 after its Recent Record High
Futures take a small dip and CoT speculators remain net sell, but there’s no denying what has been more positive technical bias.
US equity index futures are down slightly and follows a week of record highs for the S&P 500 (w/w +0.9% to 6,449) and Nasdaq 100 (w/w +0.8% to 21,622). Better percentage gains were in store for the Dow 30 (w/w +1.7% to 44,946) enjoying an intraweek record high, avoiding a red finish on Friday as component UnitedHealth jumped about 12% higher by the close thanks to the news prior of Berkshire Hathaway’s stake in the troubled insurer.
There was plenty on offer for market participants to juggle last week, including hotter y/y (year-on-year) core CPI, stronger PPI (Producer Price Index) readings throughout including a significant 0.9% m/m (month-on-month) increase, and import prices also above forecast at 0.4% m/m for July. It also didn’t help that consumer inflation expectations rose (1Y from 4.5% to 4.9% and the 5Y at 3.9% from 3.4%) according to the preliminary figures out of UoM (University of Michigan). Its print for consumer sentiment also disappointed worsening to 58.6, and while retail sales were roughly in line with forecasts up 0.5% m/m for July and 0.3% when excluding autos, traders are still getting nervous over what have been negative surprises on key economic data points.
Combining worrying pricing data with worrying labor data (according to the start of the month’s Non-Farm Payrolls July miss) isn’t good news for the US Federal Reserve (Fed) attempting to contain both threats to its dual mandate, and we heard from one FOMC (Federal Open Market Committee) member, Goolsbee, regarding the latest pricing data that “put in a note of unease”, and they’ve “got to get some clarity from the numbers” with at least “another” report “to figure out if we’re still on the golden path.”
Over in the bond market, Treasury yields ended the week higher on the further end of the curve, and market pricing (CME’s FedWatch) is still in favor of a rate cut in September (roughly 85/15), roughly a coin toss on a second in October, and a significant minority (about 40/60) on a third one in December.
It’ll be light today in terms of economic data with NAHB’s housing market index, likely keeping the attention geopolitical due to another significant meeting taking place after weekend talks.
Week ahead
And there’ll be more housing data tomorrow with building permits and housing starts for the month of July before we get minutes from the latest FOMC meeting where there was division in terms of whether to hold or cut rates by 25bp (basis points). Preliminary manufacturing and services PMIs (Purchasing Managers’ Index) release on Thursday preceded by the weekly claims, and then the attention shifts to Fed Chairman Powell at Jackson Hole on Friday. He’s no doubt expected to bring up uncomfortable readings on the pricing front, but will he choose to interpret the latest figures from the labor market as weak or stick with ‘solid’ and in turn plot a course for a more cautious monetary policy stance for the remainder of the year?
On the earnings front it’ll be largely about the retail sector, with the quarterly figures from Walmart, Home Depot, Target, Lowe’s and more.
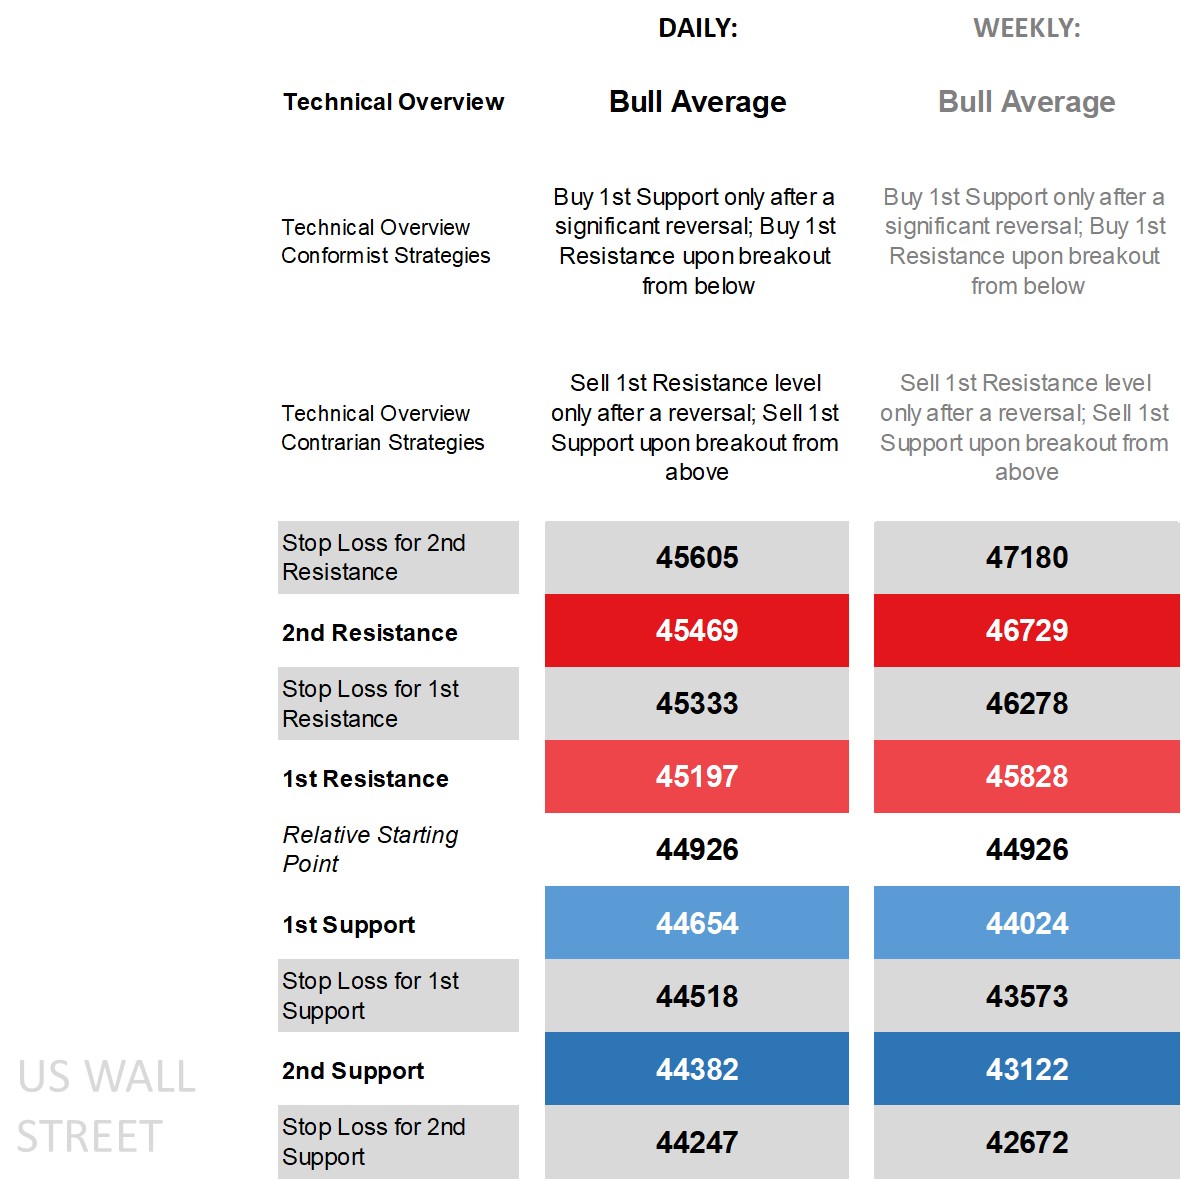
Dow 30’s technical overview, strategies and levels
Starting with the daily time frame and price is above all its main moving averages and not far off the upper end of what are relatively narrowed Bollinger Bands, on the DMI (Directional Movement Index) front the +DI above the -DI but not enough to warrant it as ‘positive’, an ADX (Average Directional Movement Index) reading not in trending territory after falling out of it earlier this month due to mostly rangebound price action, and an RSI (Relative Strength Index) quite a distance from overbought territory.
There’s no denying the positive technical bias that a record high (even if not closing at that level) brings, with a ‘bull average’ technical overview owing more to historic bullish bias (its weekly technical overview is also ‘bull average’). Should the upper band hold and would mean caution for any buys off the 1st Support (daily or weekly) initiated only after a significant reversal for those in the conformist camp who expect this overview to hold, while technical contrarians have sell strategies to work with but only after a reversal off the 1st Resistance (daily or weekly).
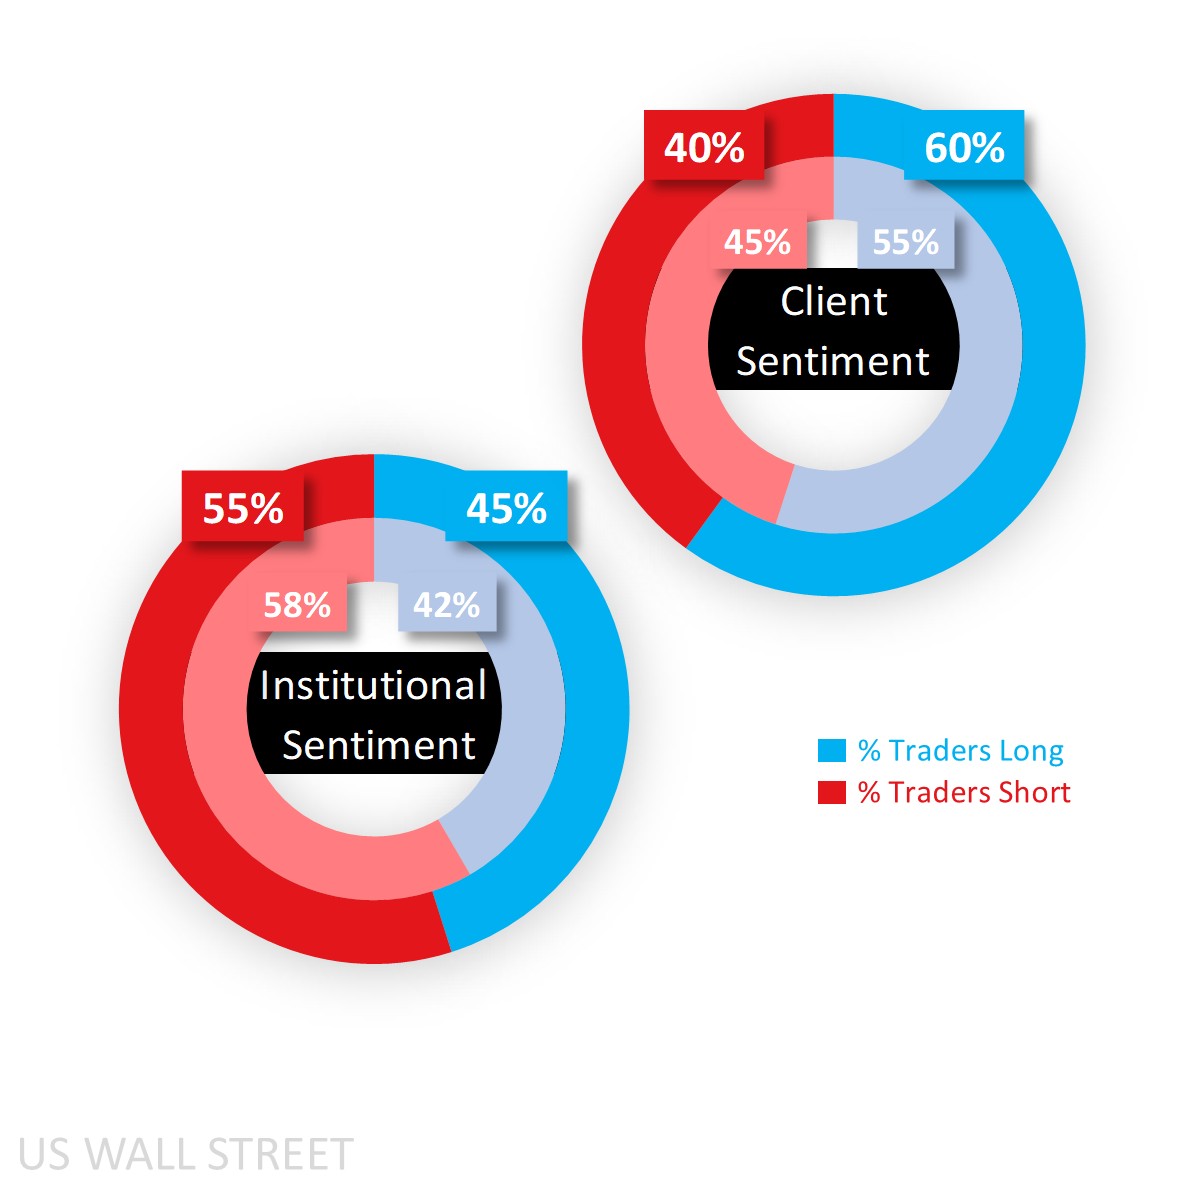
Capital.com’s client sentiment for Dow 30
In sentiment, clients remain majority buy with Friday’s pullback in price taking it from 55% to 60% as fresh shorts were enticed into closing out while longs initiated. CoT speculators were and remain net sell but have reduced that bias from 58% to 55% due to an increase in long positions (by 1,321 lots) and a simultaneous reduction in shorts (182). They are still net sell S&P (65%) and Russell 2000 (73%) while net long (and rising) in the tech-heavy Nasdaq 100 (to 66% from 64%).
Client sentiment mapped on the daily chart
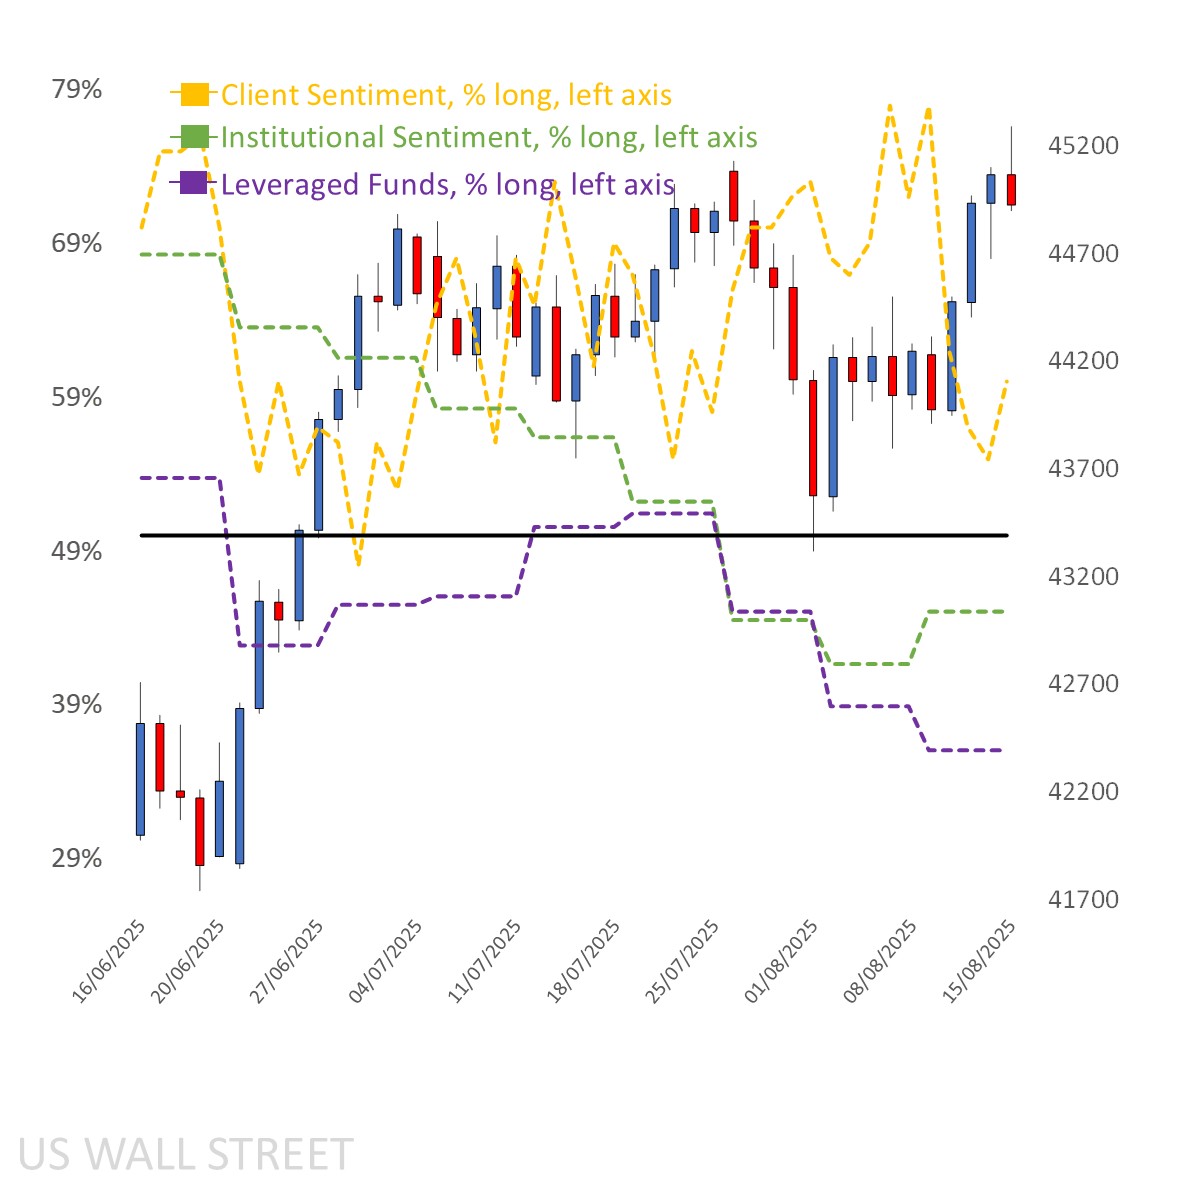
Source: Capital.com
Period: JUNE 2025 – AUGUST 2025
Past performance is not an indicator of future results.
Dow 30’s chart on Capital.com platform with key technical indicators
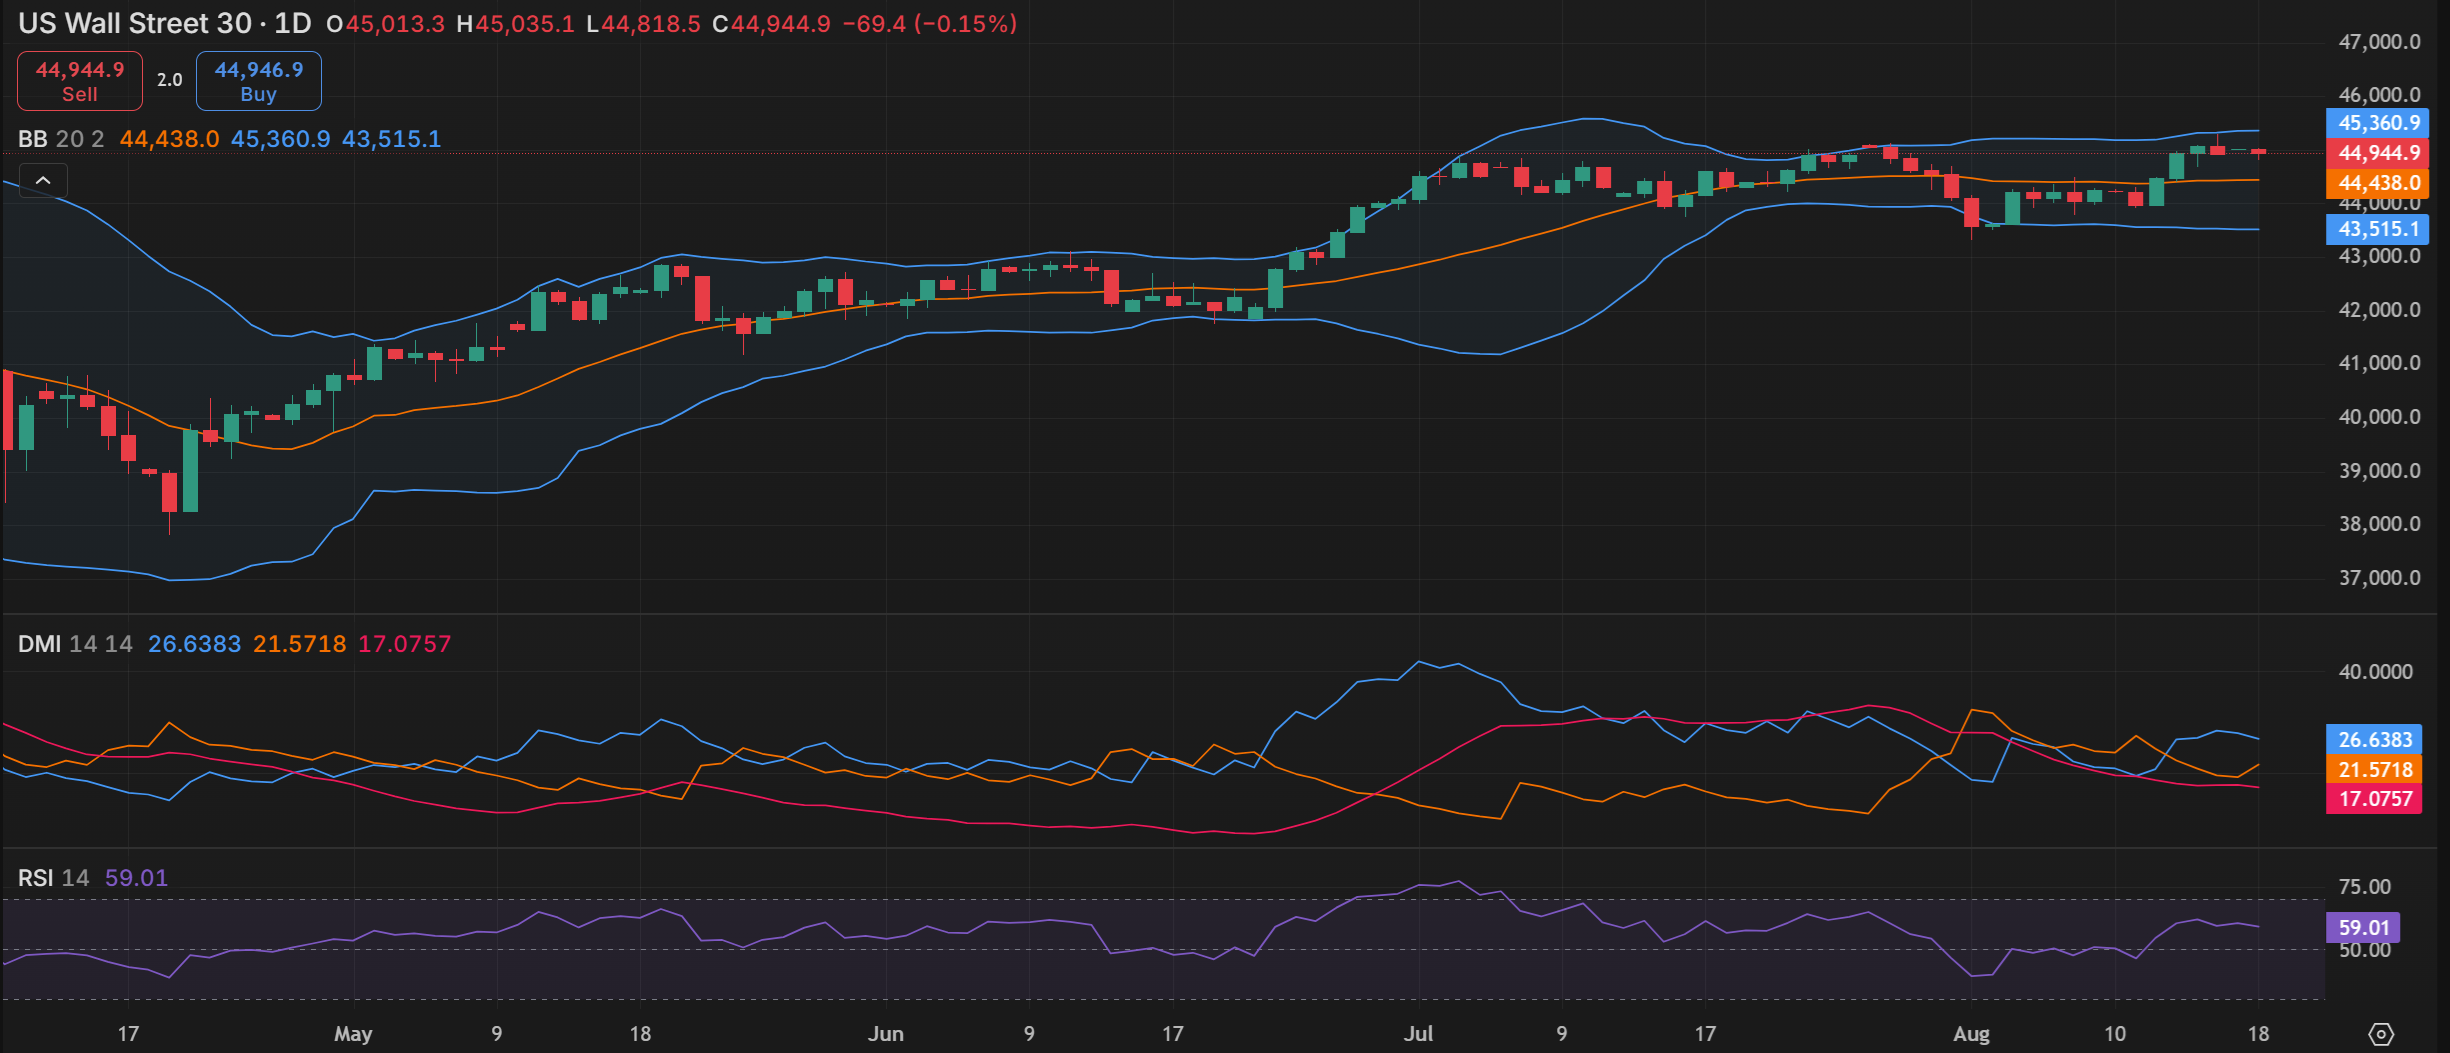
Source: Capital.com
Period: APRIL 2025 – AUGUST 2025
Past performance is not an indicator of future results.