Trading the Nasdaq 100 ahead of Jackson Hole
Rotation out of tech for two sessions in a row hits the tech-heavy index and a couple key short-term technical indicators, but both clients and CoT speculators remain majority buy.
US equity index futures are somewhat steady after yesterday’s light losses for the S&P 500 (-0.24% to 6,395), and where it was another session where tech lagged taking the Nasdaq 100 (-0.6% to 23,249) lower while the Dow 30 (+0.04% to 44,938) avoided a red finish as rotation out of tech played its part once more. The losses for the Nasdaq 100 were lighter this time around after Tuesday’s notable drop, but market participants will no doubt continue to wonder whether a shift out of tech companies and their lofty valuations into other areas of the stock market will persist.
Treasury yields edged lower again following a decent enough 20 -year auction and minutes from the latest FOMC (Federal Open Market Committee) meeting where most policymakers agreed it was too soon to lower rates and “generally pointed to risks to both sides of the Committee’s dual mandate, emphasizing upside risk to inflation and downside risk to employment”, with worries over “the possibility of inflation expectations becoming unanchored” due to tariffs. But speaking of the Federal Reserve (Fed), another member was targeted by US President Trump, this time wanting Lisa Cook to resign over potential mortgage fraud, though she has “no intention of being bullied to step down from my position because of some questions raised in a tweet”.
Market pricing (CME’s FedWatch) still sees a rate cut in September (about 80/20 odds) and fell back from coin toss likelihoods in October on a second one, but expect those odds to change with Fed Chairman Powell speaking tomorrow at Jackson Hole. Financial markets react positively to rate reductions, and within the Fed you’ve got two camps: one sees tariff-induced price increases as a one-time thing and in turn prefers more rate cuts and sooner rather than later. The other, while worried over what has been a weakening labor market, is still trying to balance that mandate with their other mandate, that of price stability in the face of what has been recent hotter pricing data. Powell has the option to tilt to the dovish side and aid rate cut likelihoods, or he could remain cautious and wait for more economic data first, which would hurt risk appetite in the financial markets, as well as inciting further calls and pressure from Trump to lower interest rates.
In terms of economic data, there was the weekly mortgage applications (out of MBA) showing a drop of 1.4%, but up next we’ve got the weekly claims, preliminary PMIs (Purchasing Managers’ Index) for the manufacturing and services sectors, and existing home sales. Those of you monitoring earnings, it’s been about the retail sector lately and in turn less impacting for the tech-heavy index, with Walmart (who isn’t a component of the Nasdaq 100) expected to release its figures next.
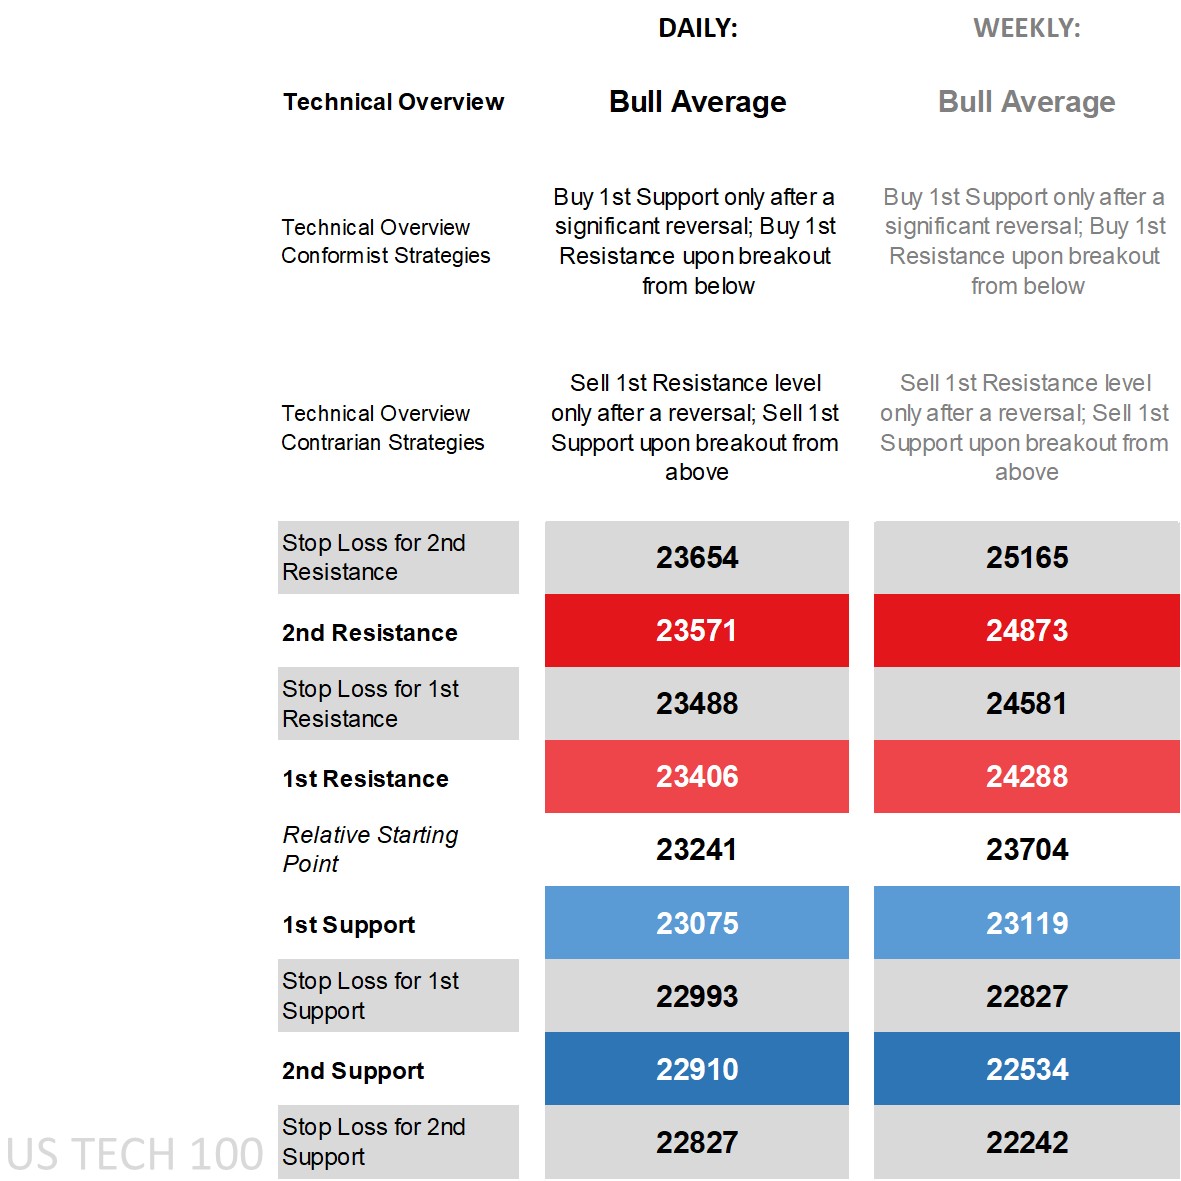
Nasdaq 100’s technical overview, strategies and levels
The technicals are conflicting on the shorter-term daily time frame with price below all its main short-term moving averages (MA) but above all its main long-term ones, intraday lows yesterday that were near the bottom end of the Bollinger Band, an RSI (Relative Strength Index) near the middle, but a negative DMI (Directional Movement Index) with a negative cross (of the -DI above the +DI) occurring earlier this week.
The weekly time frame is still a ‘bull average’ overview, and while that’s the case for the daily time frame it’ll require little to shift and without a doubt means added caution for conformist buys off any dips in price doing so only after a significant reversal. Should we get a move back to the upper band (roughly coinciding with the index’s record high) and that’ll keep buy-breakout strategies in the conformist camp, with contrarians who feel gains will be limited having both sell-after-reversal strategies off the 1st Resistance as well as sell-breakouts off the 1st Support in their arsenal.
We already had a move below this week’s Weekly 1st Support level of 23,119 (see table below) with price back above it as of writing favoring conformist buy-after-significant reversal strategies, but the week isn’t over yet and there’s the crucial fundamental event tomorrow.
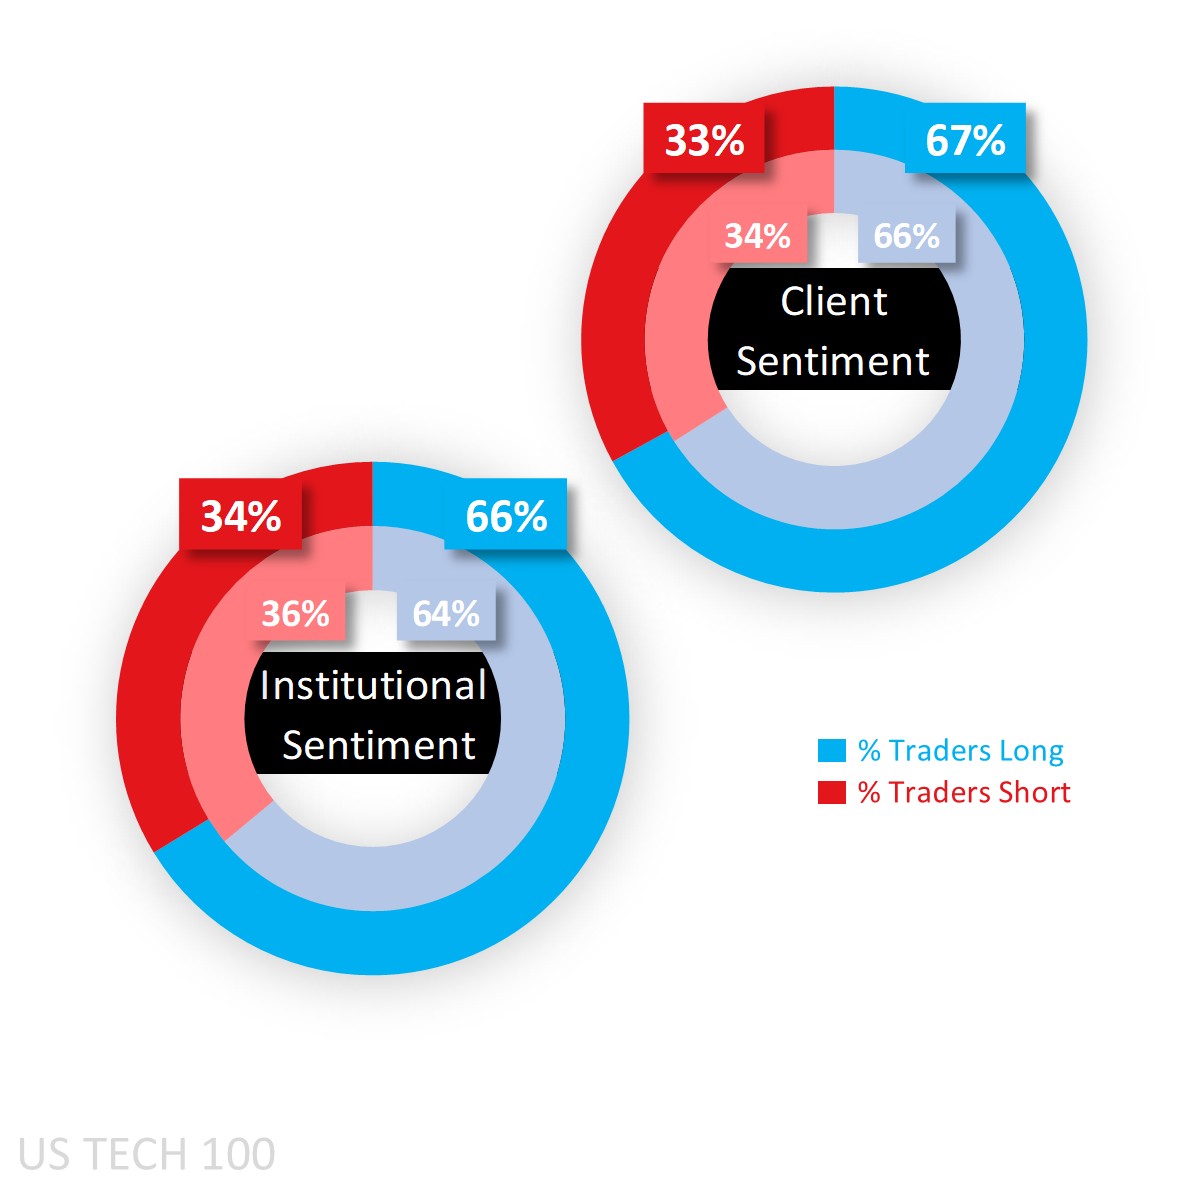
Capital.com’s client sentiment for Nasdaq 100
As for sentiment, it’s still a story of heavy buy bias for Capital.com clients, who following yesterday’s pullback in price raised it a notch to 67% as shorts naturally look for areas to close out while some longs initiate, and that long sentiment is up from 58% at the start of this week largely due to Tuesday’s price drop.
CoT speculators are also in heavy buy territory, the latest figures from the report released last Friday showing long positions up (by 11,451 lots) outdoing a smaller increase in shorts (by 1,315). It’s the exception among the four equity indices as they are net short the S&P 500 (65%), Dow 30 (55%) and Russell 2000 (73%).
Client sentiment mapped on the daily chart
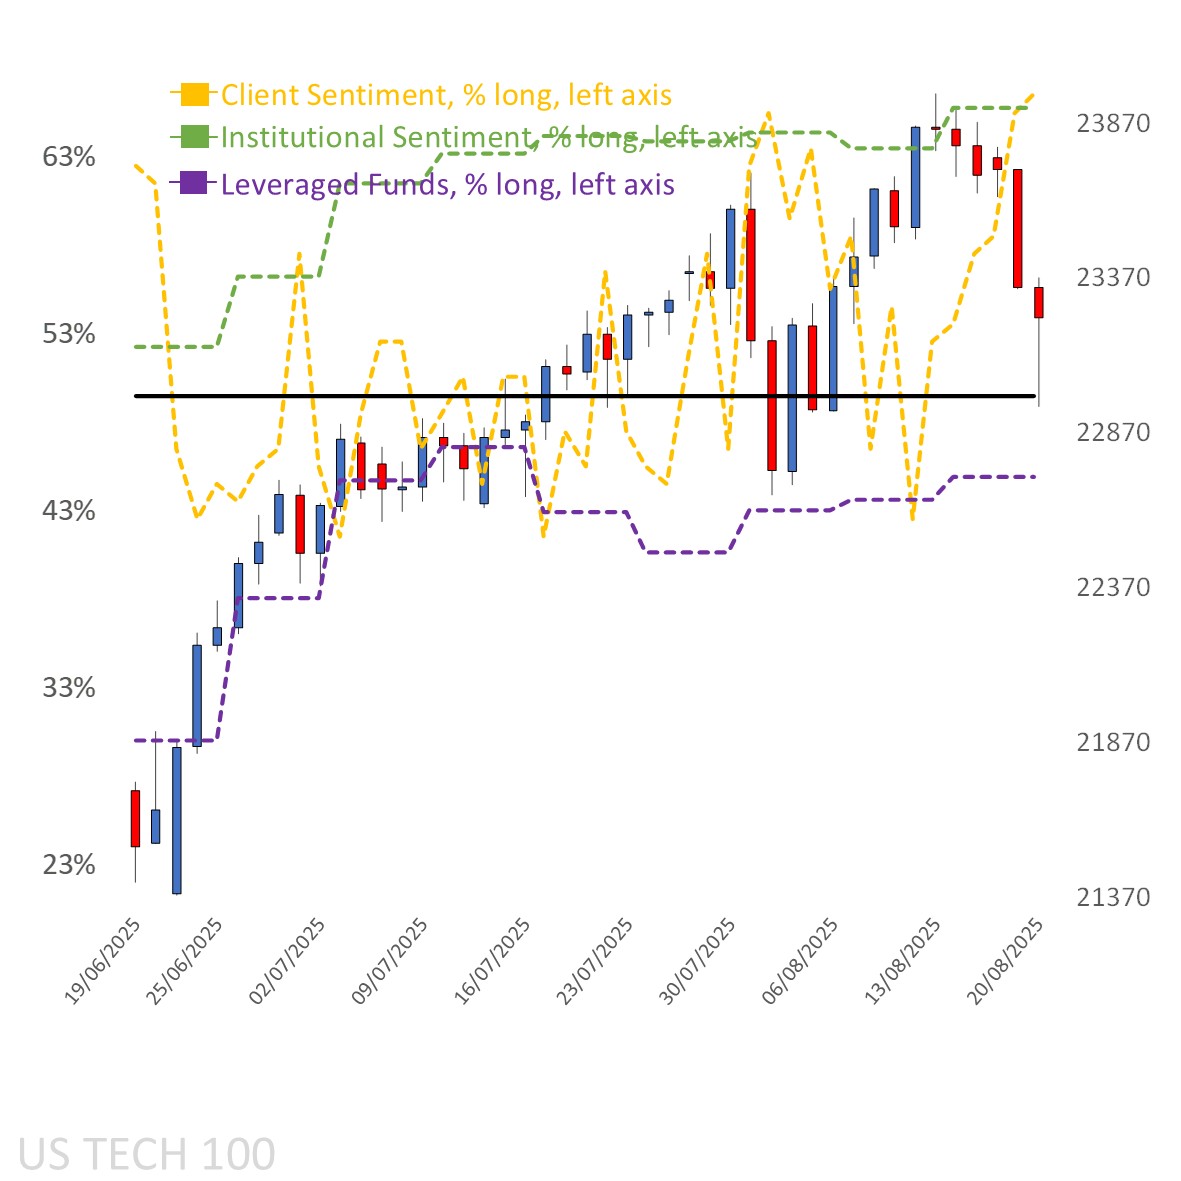
Source: Capital.com
Period: JUNE 2025 – AUGUST 2025
Past performance is not an indicator of future results.
Nasdaq 100’s chart on Capital.com platform with key technical indicators
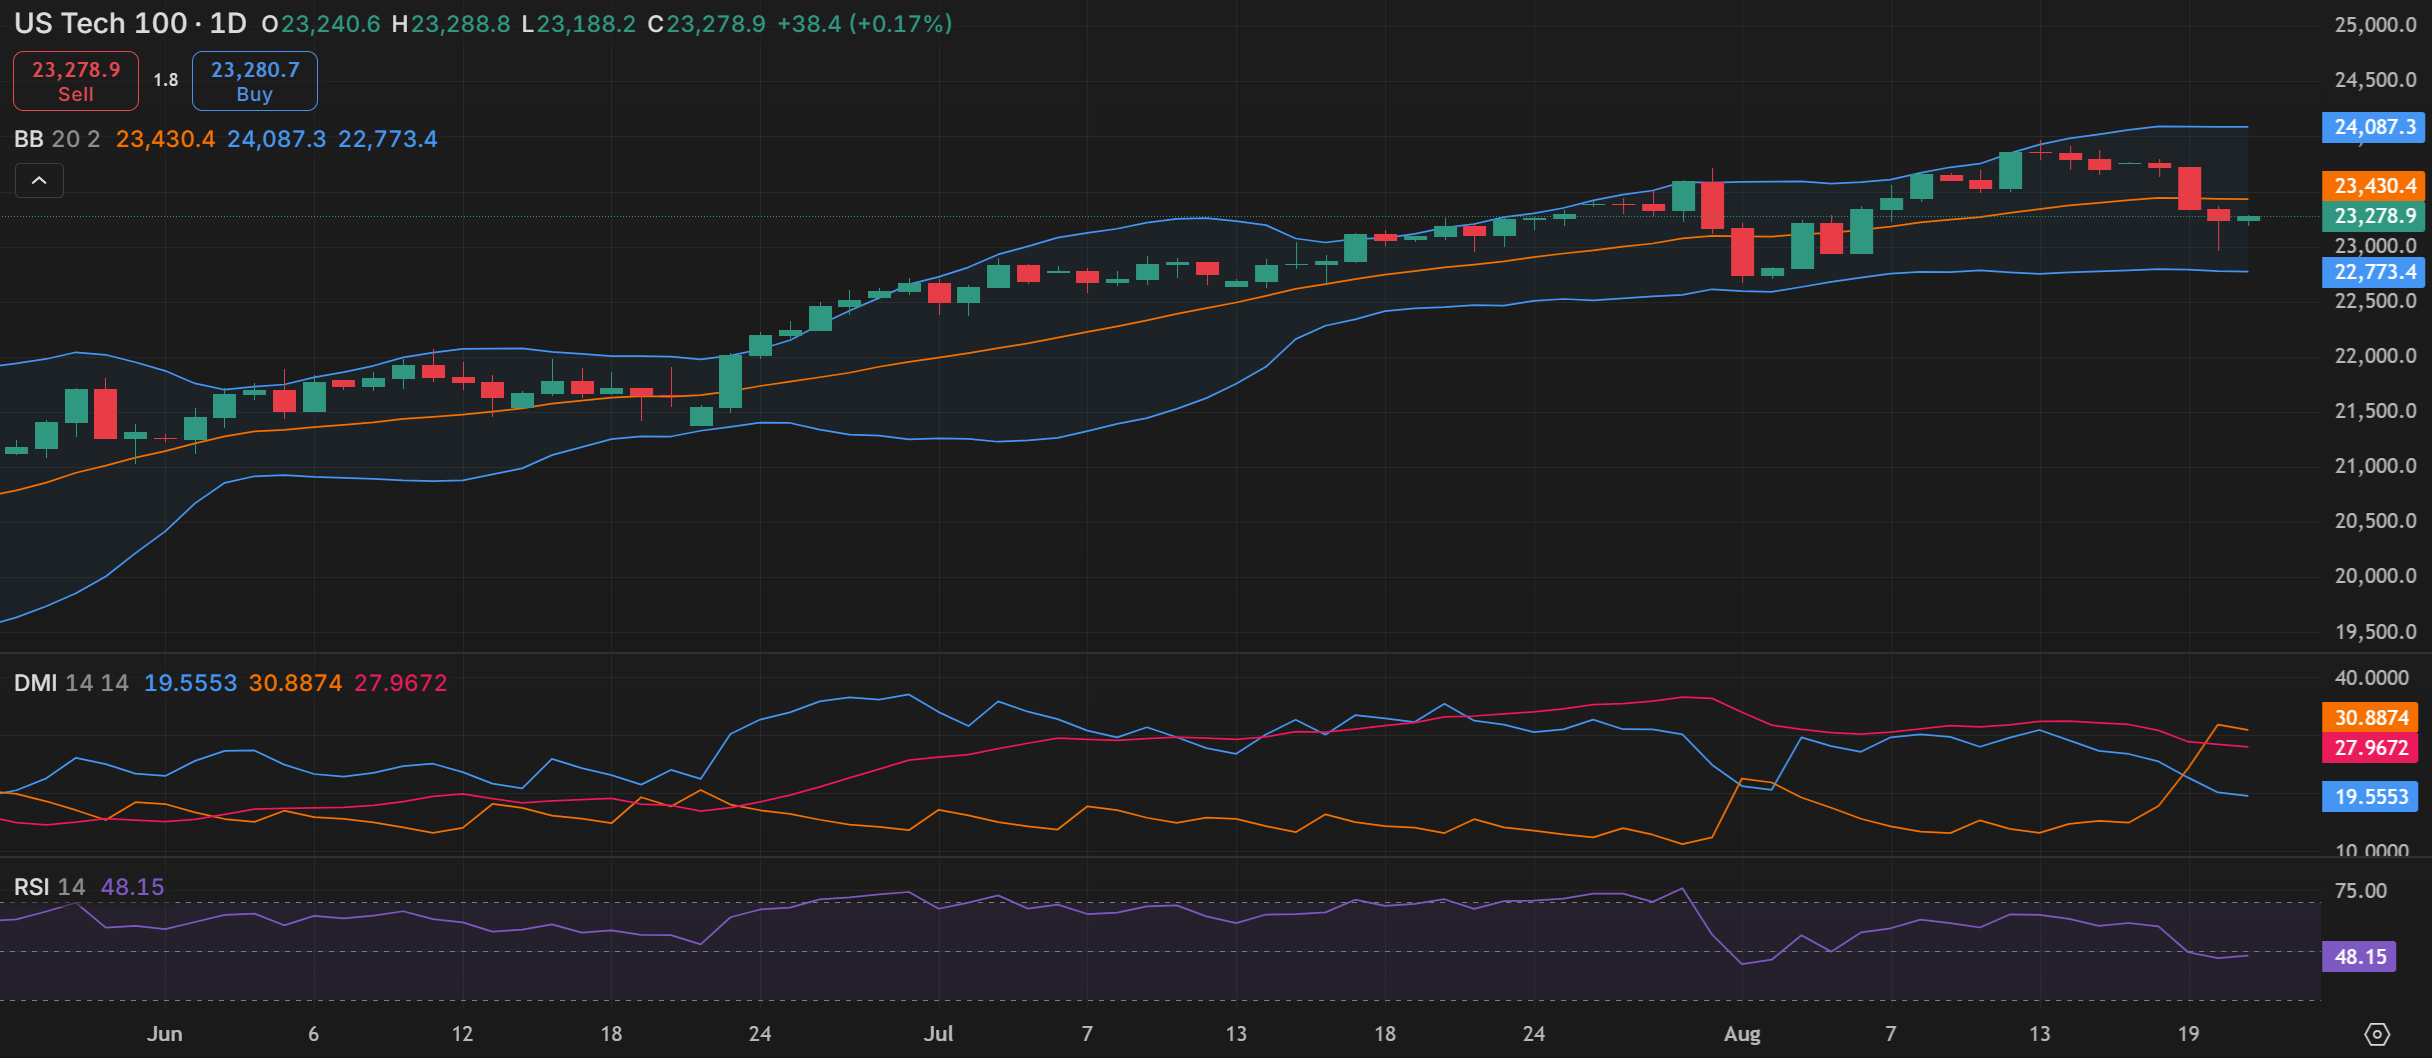
Source: Capital.com
Period: MAY 2025 – AUGUST 2025
Past performance is not an indicator of future results.