Microsoft stock forecast: Third-party projections
Microsoft was trading at $531.62 as of 1:12pm (UTC) on 27 October 2025, moving within an intraday range of $520.20–$531.90. The share price shows modest strength after the previous week’s slight gains, as investors await the company’s upcoming quarterly results.
Market attention is also on Microsoft’s Q1 FY2026 earnings release, scheduled for 29 October (Microsoft Investor Relations FAQ, 27 October 2025). Broader sentiment across the market remains supported by the resilience of Big Tech ahead of a series of major earnings reports this week (Bloomberg, 26 October 2025).
Microsoft stock forecast: Analyst price target view
Guggenheim (investment note)
Guggenheim issued a new target price of $586, reflecting around 12% potential upside from Microsoft’s previous close. The firm noted that AI monetisation through Azure and Copilot continues to support growth momentum (Yahoo Finance, 27 October 2025).
MarketBeat consensus (analyst poll)
MarketBeat reported that the average 12-month target across 36 analysts is $616.47, within a range of $475 to $710. The data show 35 ‘buy’ ratings and one ‘hold’, indicating confidence in enterprise cloud demand (MarketBeat, 27 October 2025).
UBS (equity research)
UBS maintained its $650 target, citing Azure’s 39% revenue growth and continued AI integration across Microsoft’s services. The bank said enterprise adoption trends appear to offset short-term cost pressures from AI infrastructure investment (Investing.com UK, 22 October 2025).
Wells Fargo (sector update)
Wells Fargo reaffirmed its ‘Overweight’ rating and raised the target to $675 from $650. Analysts highlighted Azure’s growth and Copilot’s wider rollout as key factors supporting confidence despite higher capital expenditure (Yahoo Finance, 8 October 2025).
24/7 Wall St. (outlook update)
24/7 Wall St. set its latest year-end 2025 target at $563.64, noting year-to-date gains of nearly 25% and sustained focus on AI-driven earnings growth (24/7 Wall St., 23 October 2025).
Predictions and third-party forecasts may not prove accurate, as they cannot anticipate unforeseen market events. CFDs are complex instruments and carry a high risk of losing money rapidly due to leverage. Ensure you understand how CFDs work and whether you can afford the associated risks. Past performance is not a reliable indicator of future results.
MSFT stock price: Technical overview
Microsoft (MSFT) last traded at $531.62 as of 1:12pm (UTC) on 27 October 2025, holding above its 20-, 50-, 100- and 200-day moving averages at approximately $518, $512, $506 and $458. The 20-over-50 alignment remains intact, with short- and medium-term averages positioned above longer-term levels. The 10- and 30-day simple moving averages (SMAs) around $517–516 reinforce underlying support within the current range.
Momentum indicators are neutral: the 14-day RSI stands at 59.75, within the upper-neutral zone, while the ADX at 14.25 signals a weak directional trend. A daily close above the Classic Pivot R1 at $527.38 could bring the next resistance at $536.80 into focus. Initial support sits at the Classic Pivot (P) near $509.88, with the 100-day SMA at $506 providing the next support level. A move below the 100-day average could expose the S1 level at $500.45 (TradingView, 27 October 2025).
This technical overview is for informational purposes only and does not constitute financial advice or a recommendation to buy or sell any instrument.
Microsoft share price history
Microsoft’s share price has risen steadily over the past two years, supported by demand for cloud and AI services. From late-2023 levels near $370, the stock advanced through several quarters of consistent gains, reaching around $420 by the end of 2024 and above $530 by October 2025. This represents an increase of roughly 40% year on year as of 27 October 2025, with Microsoft trading near its highest levels for the period. The trend indicates continued investor confidence amid broader market volatility, highlighting the company’s ongoing strength in enterprise software and AI-related growth areas.
Past performance is not a reliable indicator of future results. Share prices are indicative and may differ from live market prices.
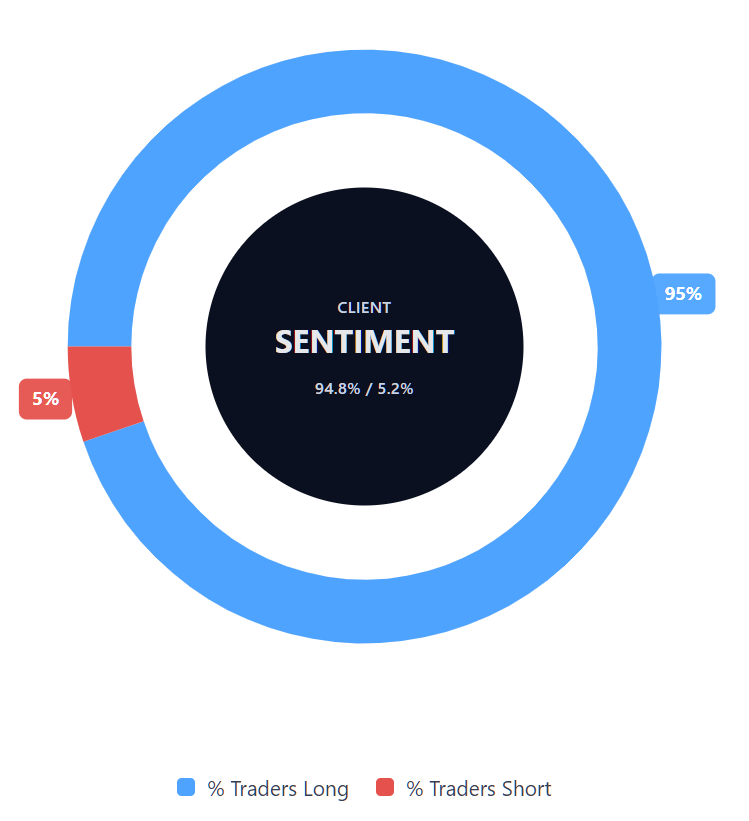
Capital.com’s client sentiment for Microsoft CFDs
As of 27 October 2025, Capital.com client positioning in Microsoft CFDs currently shows a strong buy bias, with 94.8% of positions long and 5.2% short, putting buyers ahead by 89.6 percentage points. This represents a notably one-sided long skew, indicating a preference for upward exposure among clients at this time. Figures reflect open positions on Capital.com and are subject to change.