FTSE 100: Fibonacci Levels to Watch
The FTSE 100 has been locked in a well-defined trading range since last summer. The market has failed to break above the resistance zone on multiple occasions and we have also seen several swift bounces from the support zone (see chart below).
FTSE respects Fib levels within long-term range.
The FTSE 100 has been locked in a well-defined trading range since last summer. The market has failed to break above the resistance zone on multiple occasions and we have also seen several swift bounces from the support zone (see chart below).
Within the context of this long-term trading range, we can use key Fibonacci retracement levels as a tool to time inflection points. In recent weeks we have seen the market rally from a 61.8% retracement of the Nov-Jan bull run. And last week, the FTSE reversed and sold off from the 78.6% Fibonacci retracement of the New Year sell-off – an area confluent with the top of the long-term trading range.
FTSE 100 daily candle chart
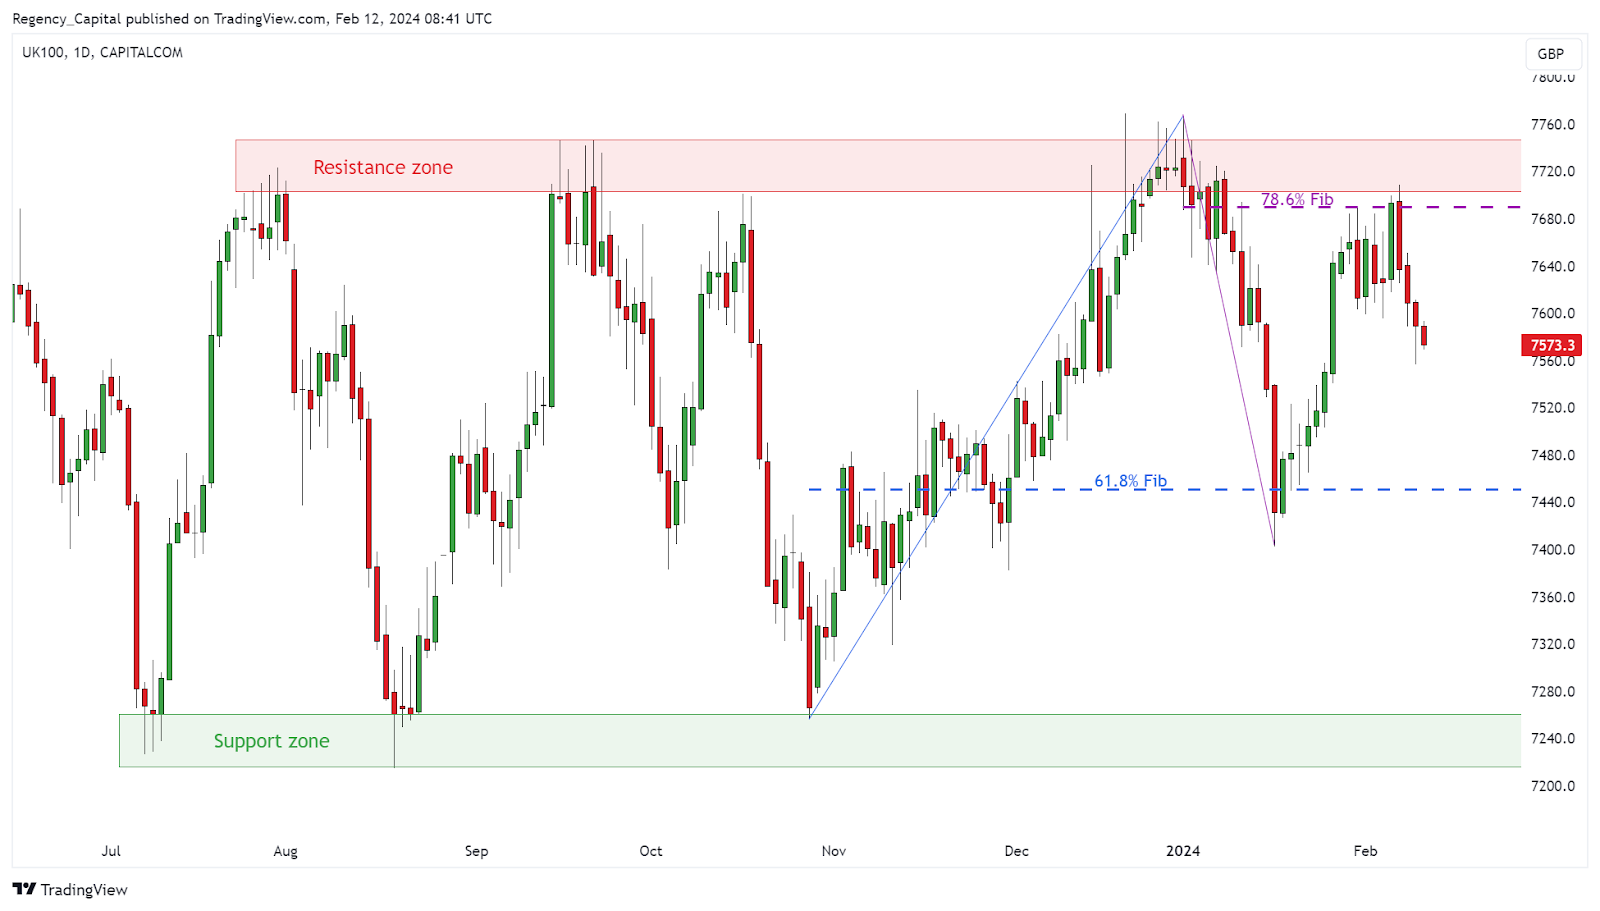
(Past performance is not a reliable indicator of future results)
Gartley pattern taking shape
With recent price action on the FTSE respecting two Fibonacci retracement levels, we can take this analysis one set further and project where the next inflection may occur. To do this, we can use an advanced Fibonacci pattern called the Gartley Pattern…
The Gartley pattern has a beautiful harmonic aesthetic. The pattern essentially looks to enter the market on a two-legged pullback from the impulse leg (X-A) highs. The two-legged pullback should take the market back down towards the 78.6% retracement of the impulse leg – potentially creating a trade setup which has attractive levels of risk reward.
Here are the Gartley pattern rules that must be met:
-
AB retraces XA by 61.8%
-
BC retraces AB by 38.2% to 88.6%.
-
CD retraces XA by 61.8% to 78.6%.
Here’s how the pattern is shaping up on the FTSE 100:
FTSE potential gartley pattern
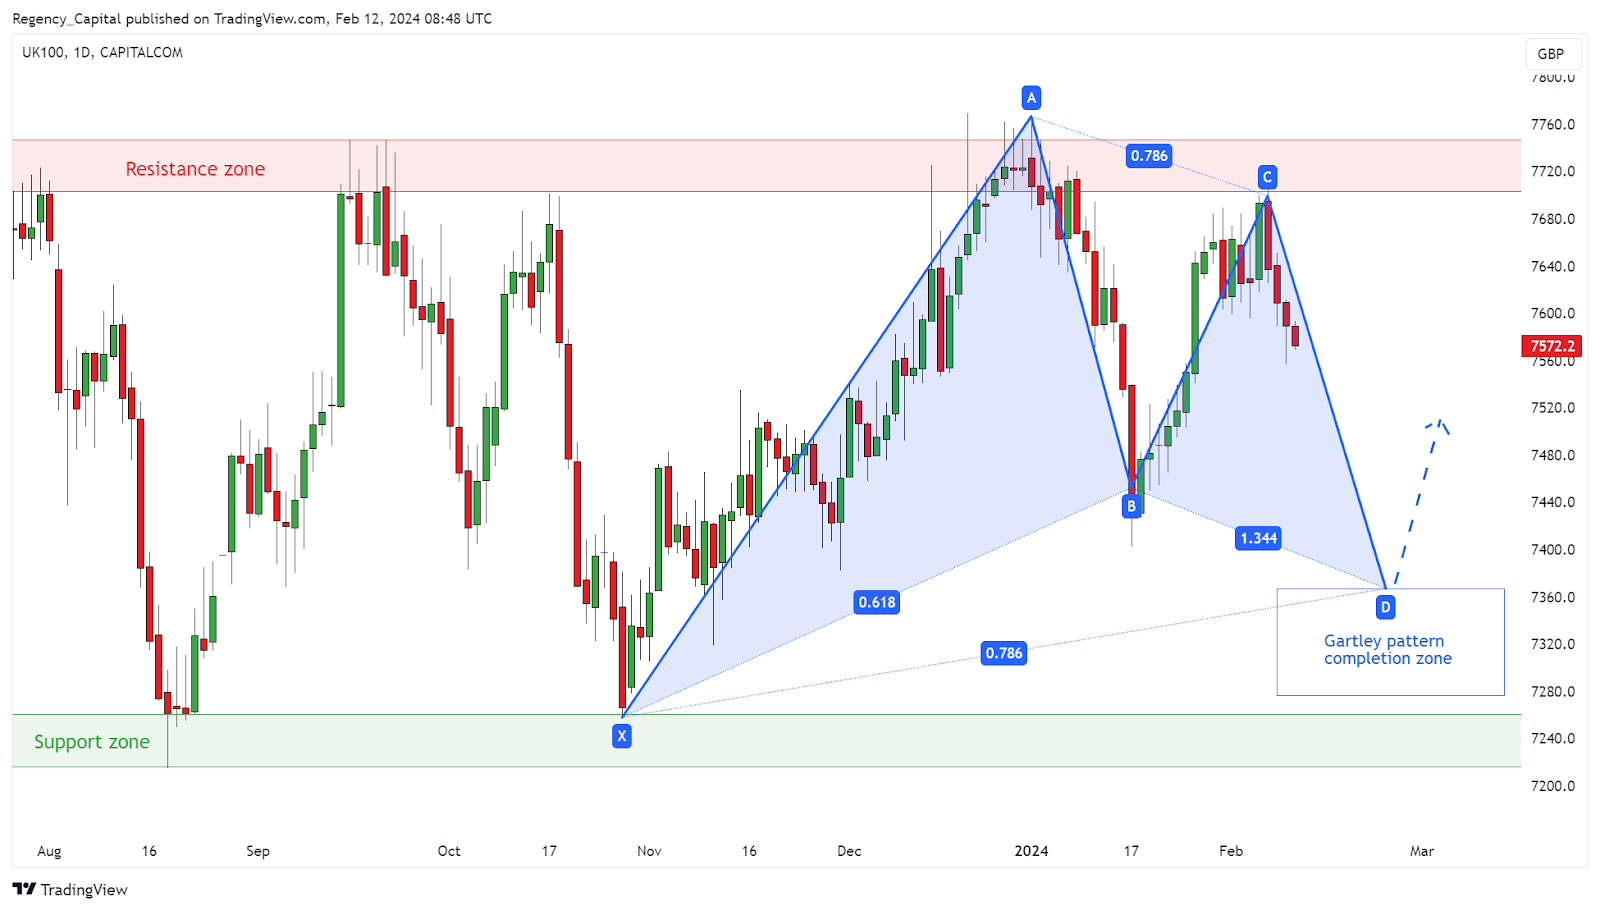
(Past performance is not a reliable indicator of future results)
How to trade the Gartley pattern
Entry and Stop: Traders typically enter upon completion of the pattern near the D point, implementing a stop-loss below or above point X.
Targets: Point C makes for a clean initial target, with secondary targets coming in at point A – an area that coincides with the top of the long-term range.
Insight: Rather than simply entering on D – wait for a reversal candle pattern to form. This can help to ensure that your entry is aligned with short-term and can help to tip the probabilities of success in your favour.