WTI remains stuck as oil traders lack direction
West Texas Intermediate (WTI) continues to move sideways as traders lack the desire to move in either direction
Oil prices have lacked direction for the past 10 days with US Crude (WTI) hovering along $77.75, failing to get a close above $78 despite a few attempts. The upside seems limited in the current market dynamic even as the RSI remains way below the overbought level. Wednesday’s FOMC meeting minutes could have put a damper on some oil bulls as they evidenced once again that the Federal Reserve is in no rush to cut rates. That said, risk appetite remains strong in the equity market, despite warning bells going off in Europe on the back of concerning growth figures, suggesting the lack of appetite for oil could be more centred around commodities.
But there is also a lack of desire to be a seller in current conditions, with minor pullbacks attracting new demand for oil as ongoing political tensions in the Middle East keep prices supported. This is causing the sideways consolidation in WTI, which is likely causing many traders to question where to next.
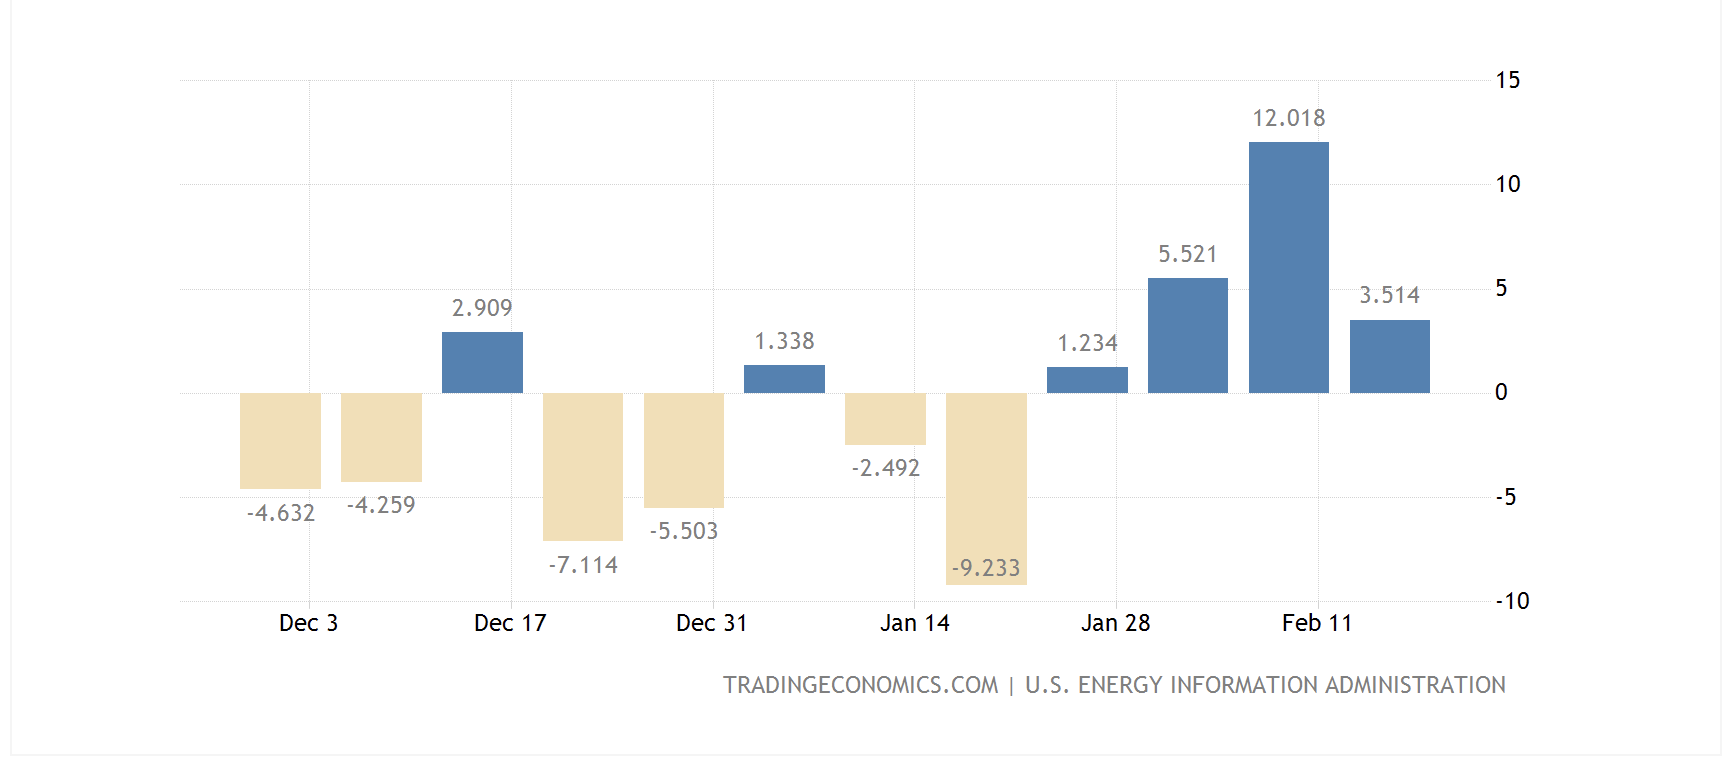
On the supply side, US crude inventories rose 3.52 million in the week to February 16th, slightly below forecasts of 3.88 million. This was positive news for oil markets as the reading had come in higher than anticipated in the prior three weeks, after a good start to the year. The total rise in inventories between the 22nd of January and the 9th of February was 18.7 million barrels, versus estimates of just 9 million. But even this data has failed to offer much direction to oil traders.
US Crude weekly inventories
Weaker growth data in Europe is likely weighing on sentiment as demand expectations remain weak in the area. This is coupled with ongoing concerns about Chinese growth and how crude demand will hold up over the coming months.
The WTI daily chart continues to suggest a bullish bias but the short-term direction is becoming messier by the day. The lack of conviction in buyers is weighing on the RSI which has started to point downward, heading towards the mid-line (50). The last time we saw it dip below this level we experienced a 9% pullback in a matter of 5 days. Buyers will need to achieve a close above $78 in the coming days if they wish to continue building the momentum higher over the coming weeks, at which point resistance could arise between $79.19 and $79.65. On the flip side, the 100-day and 20-day SMAs could offer some immediate support if selling pressure intensifies, but a further reversal to $75.55 cannot be discarded. The ascending trend line from the December 13th lows continues to offer longer-term support, currently at $73.65.
WTI daily chart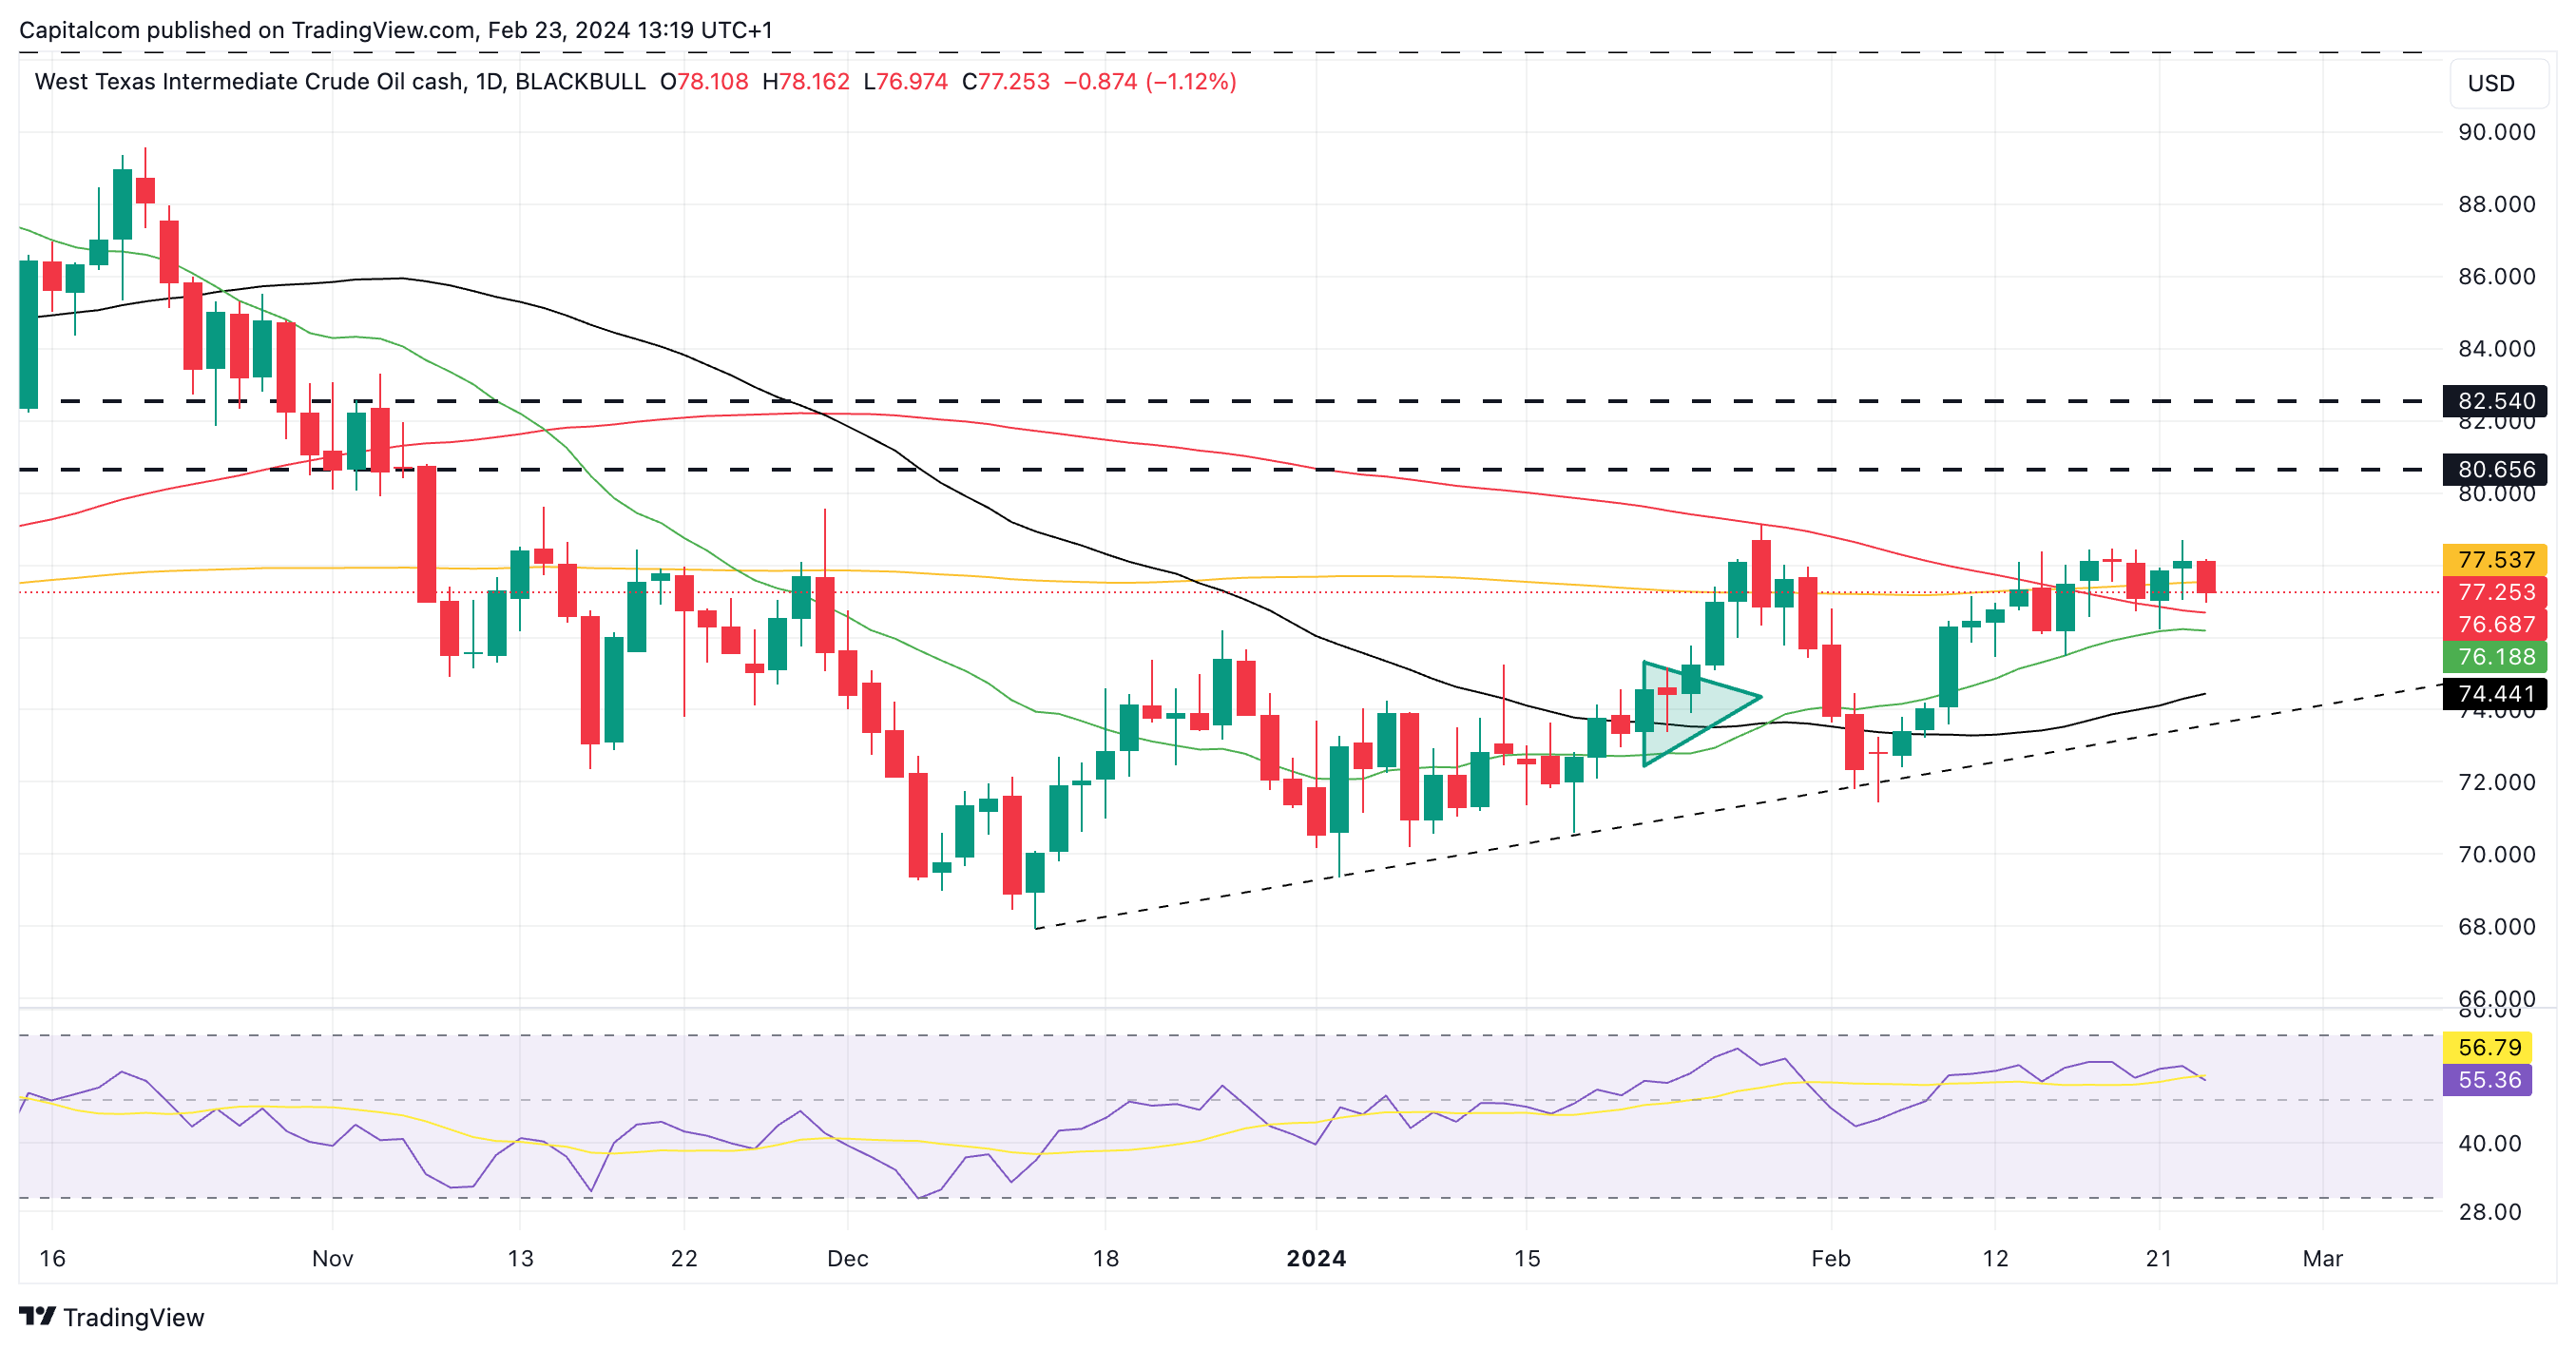 Past performance is not a reliable indicator of future results.