XAG/USD latest: Silver’s surge looks increasingly speculative
The recent rally in silver has been impressive but the technical picture shows signs of overexhaustion
Silver has staged an impressive rally in recent weeks, breaking higher alongside gold but far outpacing it in momentum. XAG/USD has climbed sharply, pushing through resistance levels with an almost parabolic rise. Yet behind the strength lies a mix of structural bullish drivers and increasingly speculative market behaviour, reflected most clearly in the dramatic drop in the gold–silver ratio.
Silver (XAG/USD) weekly chart
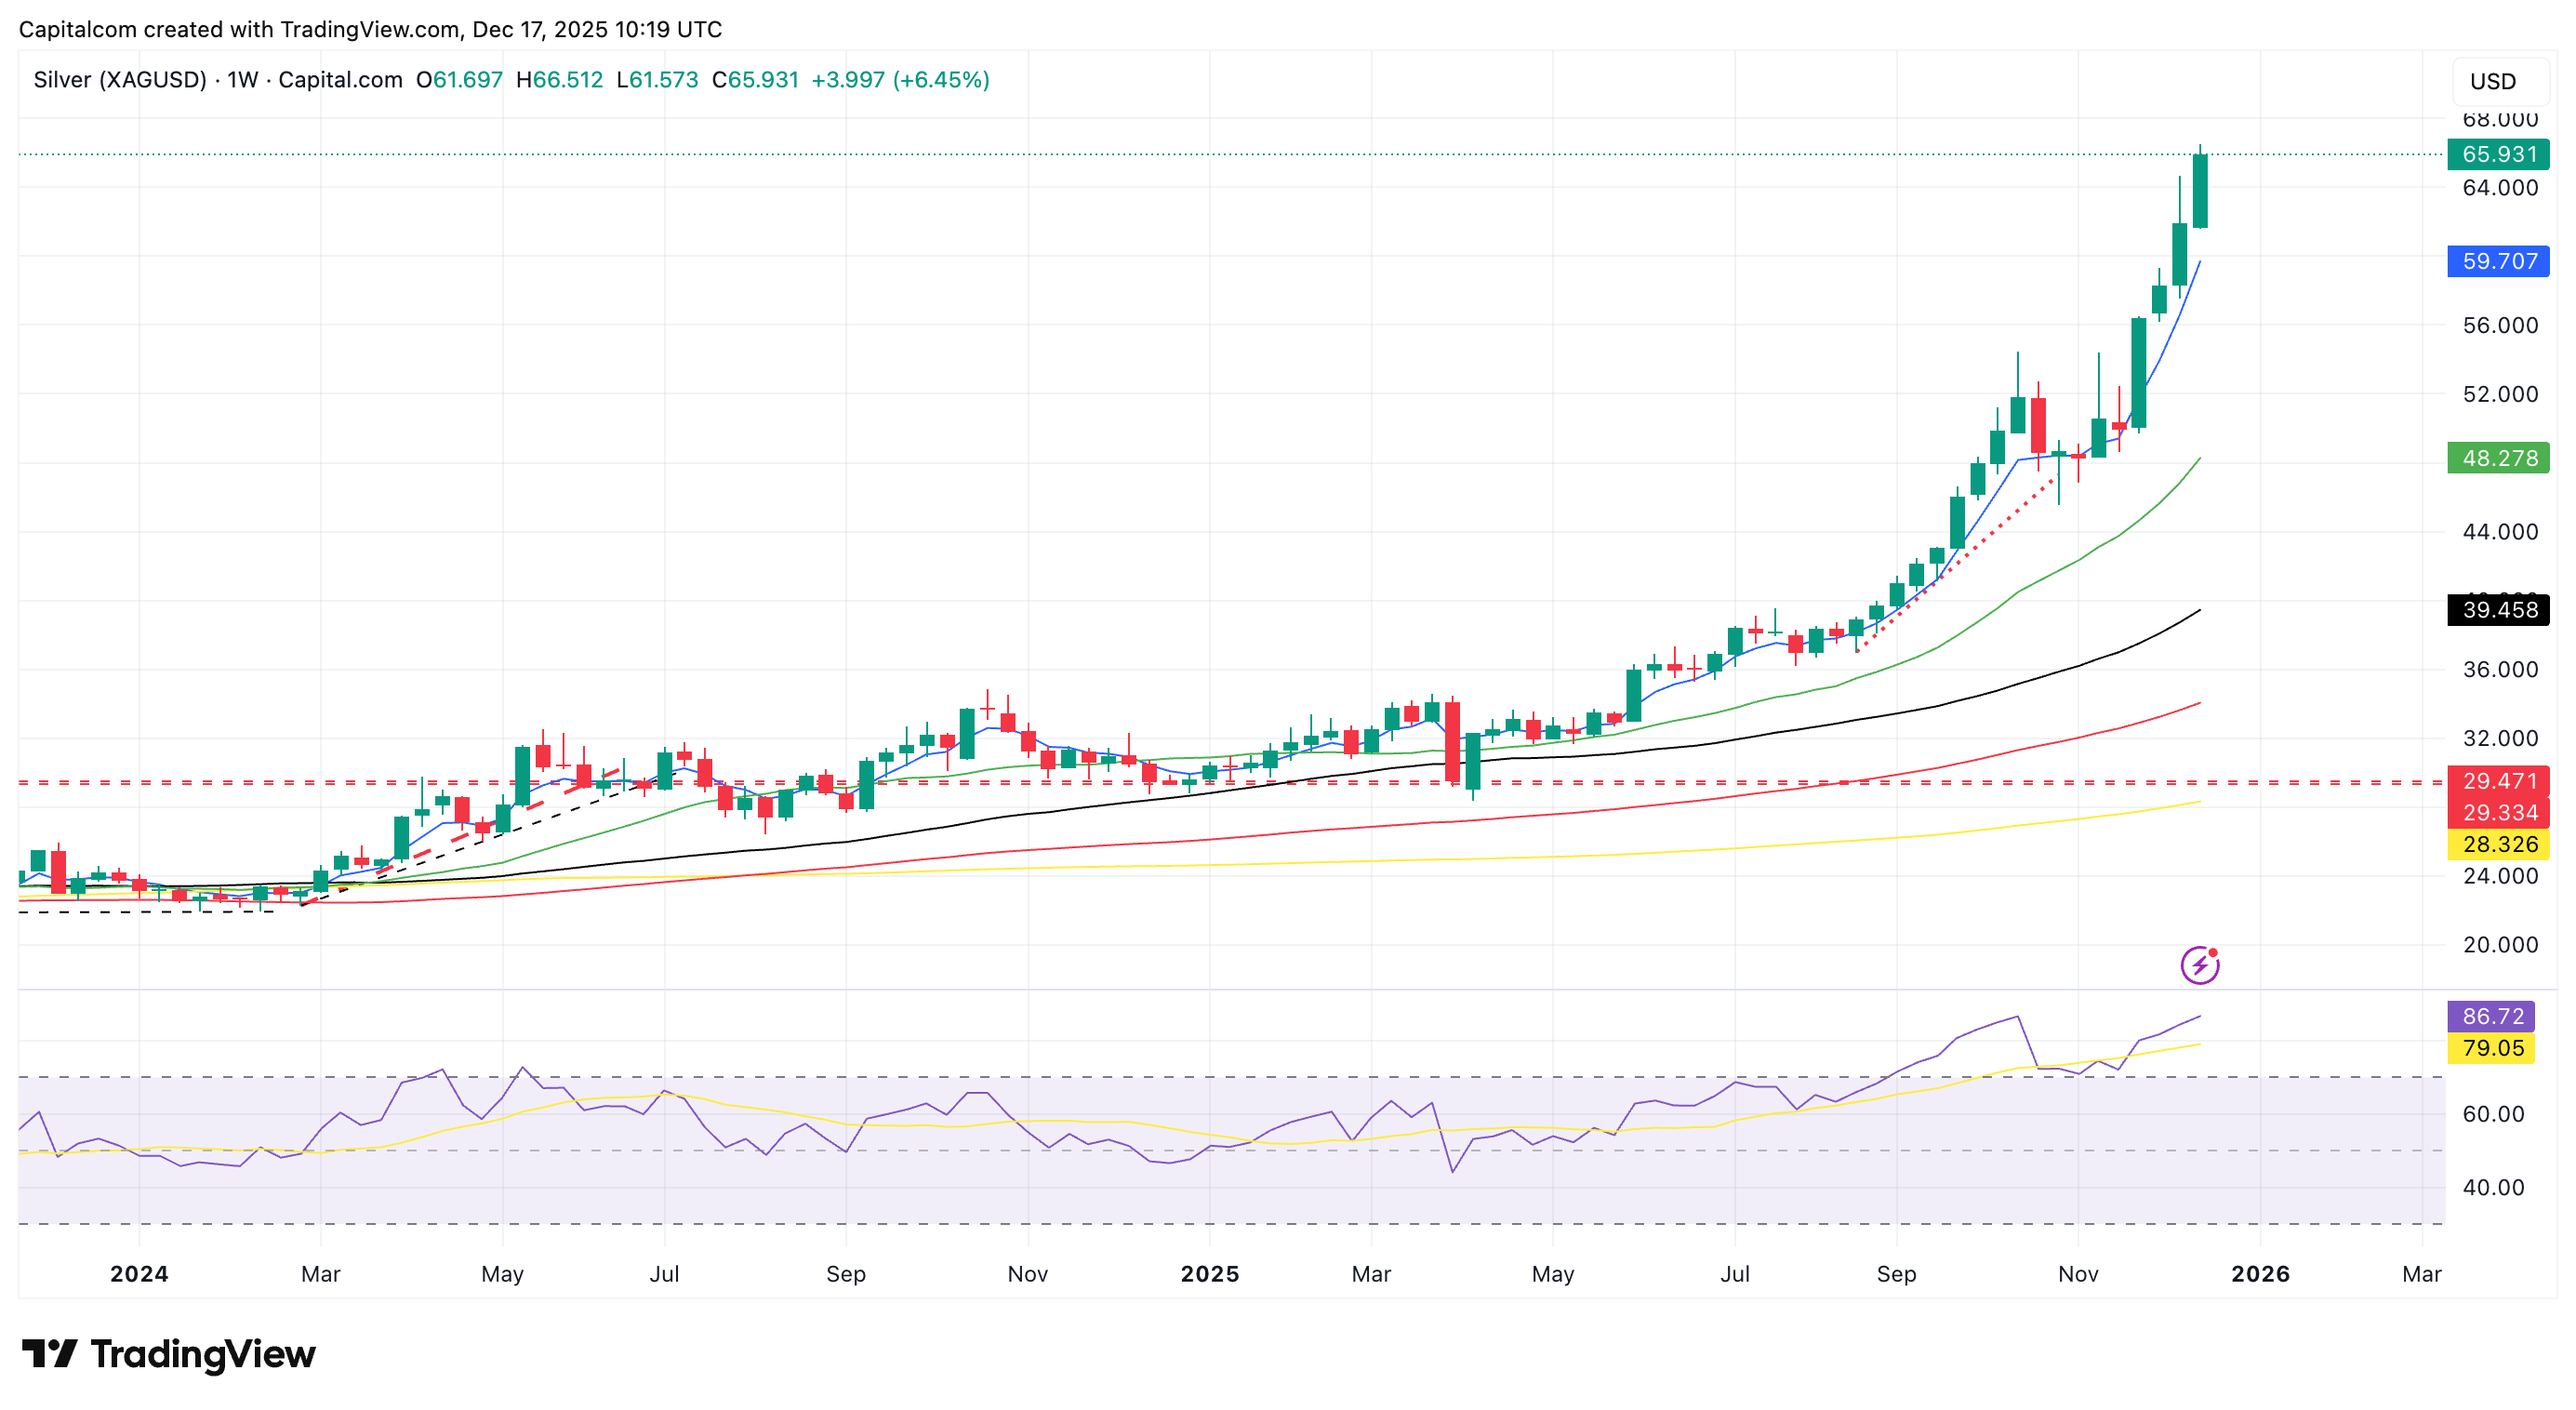
Past performance is not a reliable indicator of future results.
Safe haven demand meets industrial tightness
Silver has benefited from the same macro forces lifting gold: expectations of additional Fed easing, falling US yields, and rising concerns over policy credibility and fiscal imbalances. As real rates decline, precious metals generally find support, and silver has followed gold higher.
But unlike gold, silver has an additional industrial story. Demand from semiconductors, solar panels, and electric vehicles continues to rise, with supply forecasts pointing to structural deficits in the years ahead. Investors have become increasingly sensitive to this theme, treating silver as a leveraged play on both electrification and the AI hardware cycle. This has given silver a dual role: a defensive hedge and a growth-linked commodity, widening its appeal as momentum builds.
Gold-Silver ratio drops to 5-year lows
One of the clearest signs of silver’s outsized move is the collapse in the gold–silver ratio, which has dropped to its lowest level since the pandemic-era surge in 2020. The ratio has broken decisively below long-term averages, indicating that silver is outperforming gold at a pace rarely seen outside periods of market stress or speculative fervour.
Historically, a rapid decline in this ratio tends to occur when investors chase silver as a high-beta version of gold, industrial-demand narratives dominate, or speculative leverage builds aggressively in futures markets.
While gold has moved steadily higher on macro fundamentals, silver’s acceleration suggests positioning rather than fundamentals has taken the lead.
Gold/Silver ratio chart (2005 – 2025)
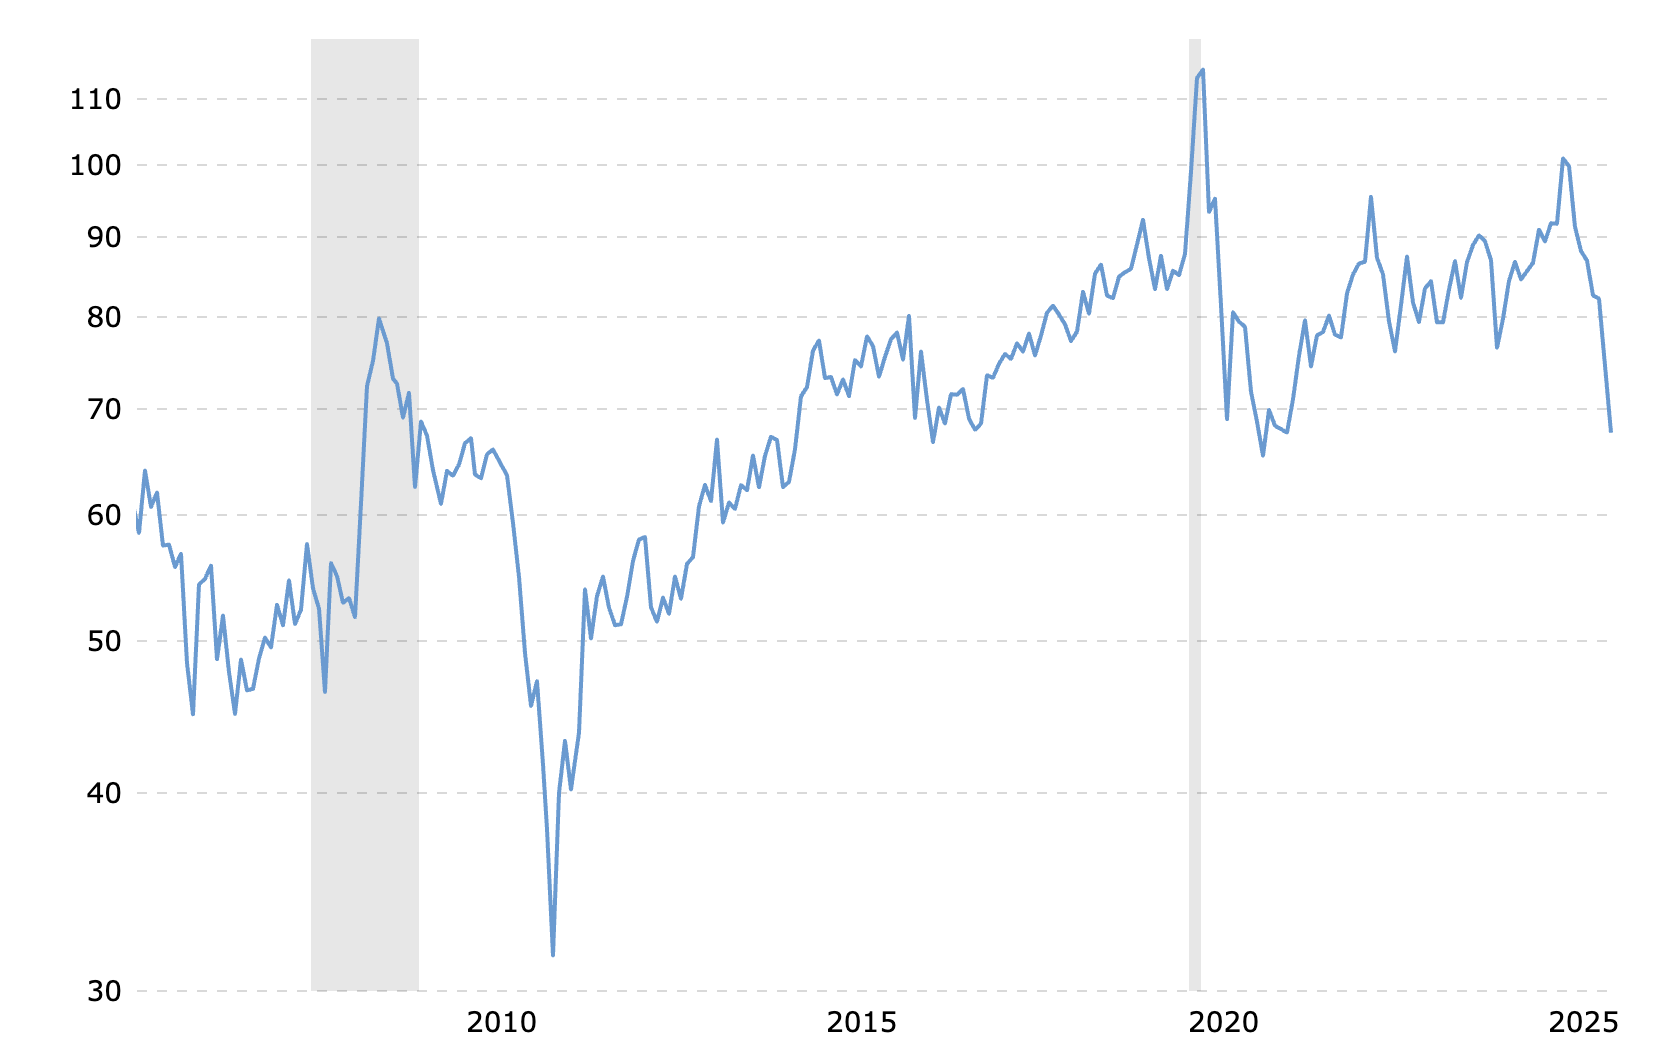
Source: macrotrends.net
Silver (XAG/USD) technical outlook
Despite the constructive long-term story, the near-term picture for silver looks increasingly speculative. Price action has become exponential, with successive large daily candles and minimal consolidation, all whilst momentum indicators show extreme overbought conditions, with RSI at levels historically associated with sharp pullbacks. Meanwhile, futures data point to heavy long positioning, raising the risk of profit-taking if momentum falters, and volatility has risen disproportionately relative to gold, another sign that fast-money flows are dominating.
On the charts, the rally lacks meaningful technical tests. Silver has posted four consecutive weeks of gains without revisiting support levels or forming sustainable bases, a classic behaviour in a momentum-driven market vulnerable to abrupt reversals.
Over the long run, silver’s structural drivers remain compelling: tightening supply, expanding industrial demand, and the potential for further gains if gold continues to climb as global central banks ease policy. But in the short term, XAG/USD appears stretched. Traders should watch for signs of momentum exhaustion, a reversal in the gold–silver ratio, profit-taking near multi-year highs, and geopolitical or macro catalysts that could trigger volatility across precious metals.
The path of least resistance has undoubtedly been to the upside, but the slope of the ascent now implies that even a mild shift in sentiment could spark a sharp correction.