Market Mondays: Markets on edge as Middle East escalation triggers oil shock and policy uncertainty
Oil prices jump higher as Iran elects a new leader, dragging out the conflict as the Strait of Hormuz faces continued disruption.
Financial markets have been jolted into action as geopolitical tensions in the Middle East intensify, delivering one of the sharpest oil price spikes in history and forcing investors to reassess the global economic outlook.
After weeks of what appeared to be relative complacency, particularly in US equities, the past several days have fundamentally altered the macro landscape. With energy infrastructure under attack, the Strait of Hormuz effectively at a standstill, and oil production disruptions spreading across the Gulf, markets are now confronting the real economic consequences of escalation.
Oil shock sends shockwaves through global markets
The most immediate and dramatic reaction has come from the energy market. At one stage during Asian trade, West Texas Intermediate crude surged nearly 30% intraday, close to the largest one-day rally on record, before moderating following reports that G7 nations would convene to discuss tapping strategic reserves. Even after the pullback, oil remained up roughly 10%, marking a significant supply-driven price shock.
The core issue is duration. Strategic reserves may temporarily smooth volatility, but they cannot offset a prolonged disruption in Middle Eastern production and exports. Several regional producers have signalled production slowdowns or outright halts. Crucially, oil production cannot simply be “switched back on.” Restarting output is a complex process, and ongoing security risks, particularly to shipping through the Strait of Hormuz, further complicate the outlook. As long as the conflict drags on, energy markets are likely to remain tight, with implications extending well beyond oil itself.
Equity markets: from complacency to risk aversion
Last week, European and Asian markets had already begun reacting to rising energy prices. The DAX, sensitive to energy costs given Germany’s import dependence, saw sustained downside pressure. The STOXX 600 and Japan’s Nikkei also reflected growing concerns.
In contrast, US indices such as the S&P 500 and Nasdaq had largely traded sideways for much of the week, seemingly insulated by geography and a perception that the US would ultimately prevail in the conflict.
That changed. Pre-market US trading has turned decisively lower, while European markets have extended declines. The DAX has fallen below 23,000, its lowest level since mid-last year, underscoring mounting pressure.
Technically, US equities are flashing warning signs. The S&P 500 has effectively gone nowhere for six months, momentum has slowed, and price action is beginning to resemble a rounding top formation, often a precursor to more meaningful trend reversals. A break below key support levels near 6,700 could signal further downside risk.
S&P 500 daily chart
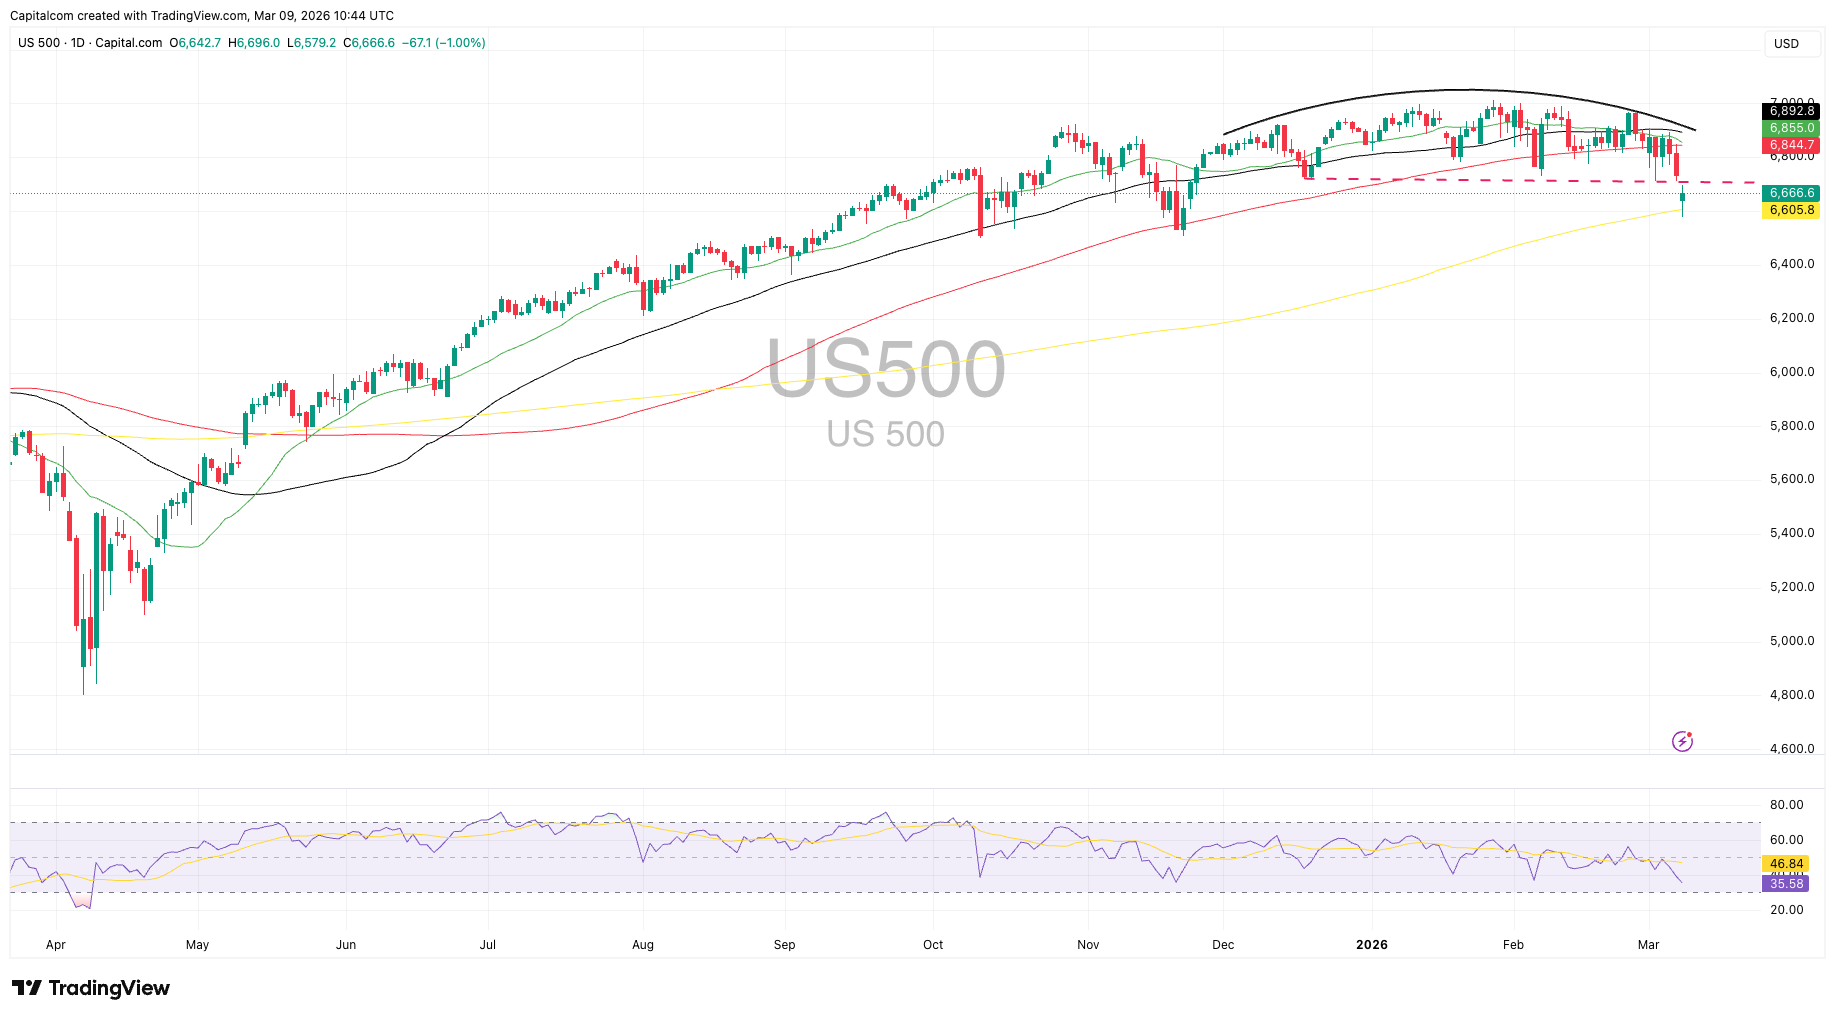
Past performance is not a reliable indicator of future results.
The monetary policy dilemma: inflation vs. growth
The oil shock comes at an already fragile moment for global monetary policy. Interest rate markets in Europe and the UK are beginning to price in a reduced probability of further rate cuts — and in some cases even hikes — as higher energy prices threaten to lift inflation. In the US, expectations for rate cuts have also been pushed back. This creates a “worst of both worlds” scenario: a supply shock that raises inflation while growth momentum appears to be slowing.
Friday’s US nonfarm payrolls report added to the unease. The unemployment rate ticked higher, and February saw a net loss in jobs. More concerning was a rise in permanent job losses to roughly 2 million — the highest level since late 2021.
While temporary factors such as strikes and weather may have influenced the headline figures, the broader trend is troubling. Downward revisions have become a consistent feature of recent reports, and on a net basis, the US economy has added virtually no jobs over the past 12 months.
Structural shifts may also be at play. Slower hiring, tighter immigration policy, and cost-cutting measures — including increased use of artificial intelligence — are contributing to softer labour demand. If this trend persists over the next few readings, it could signal deeper underlying economic weakness at a time when the Federal Reserve may be constrained from easing policy due to inflation risks.
Inflation data: asymmetric risks ahead
This week’s US CPI and PCE inflation releases take on added significance. Headline CPI is expected to remain around 2.4–2.5%, while core measures remain elevated. The January core PCE reading — the Fed’s preferred gauge — is forecast at 3.1%, potentially marking a multi-month high.
Markets face an asymmetric risk: if inflation surprises to the upside, investors may begin to fear that price pressures were already reaccelerating even before the energy shock filters through. That could raise uncomfortable questions about how much worse inflation may become in the months ahead.
With a Federal Reserve meeting approaching — including updated projections and a dot plot — policymakers face a deeply complicated decision-making environment. Some officials may argue for looking through a supply shock and supporting a weakening labour market. Others may warn against repeating past mistakes by easing too early.
The likely result? A more divided Fed, greater policy uncertainty, and increased volatility across both bond and equity markets. The MOVE index — a measure of Treasury market volatility — has already begun rising, signalling growing uncertainty in rate expectations.
MOVE Bond Market Volatility Index daily chart
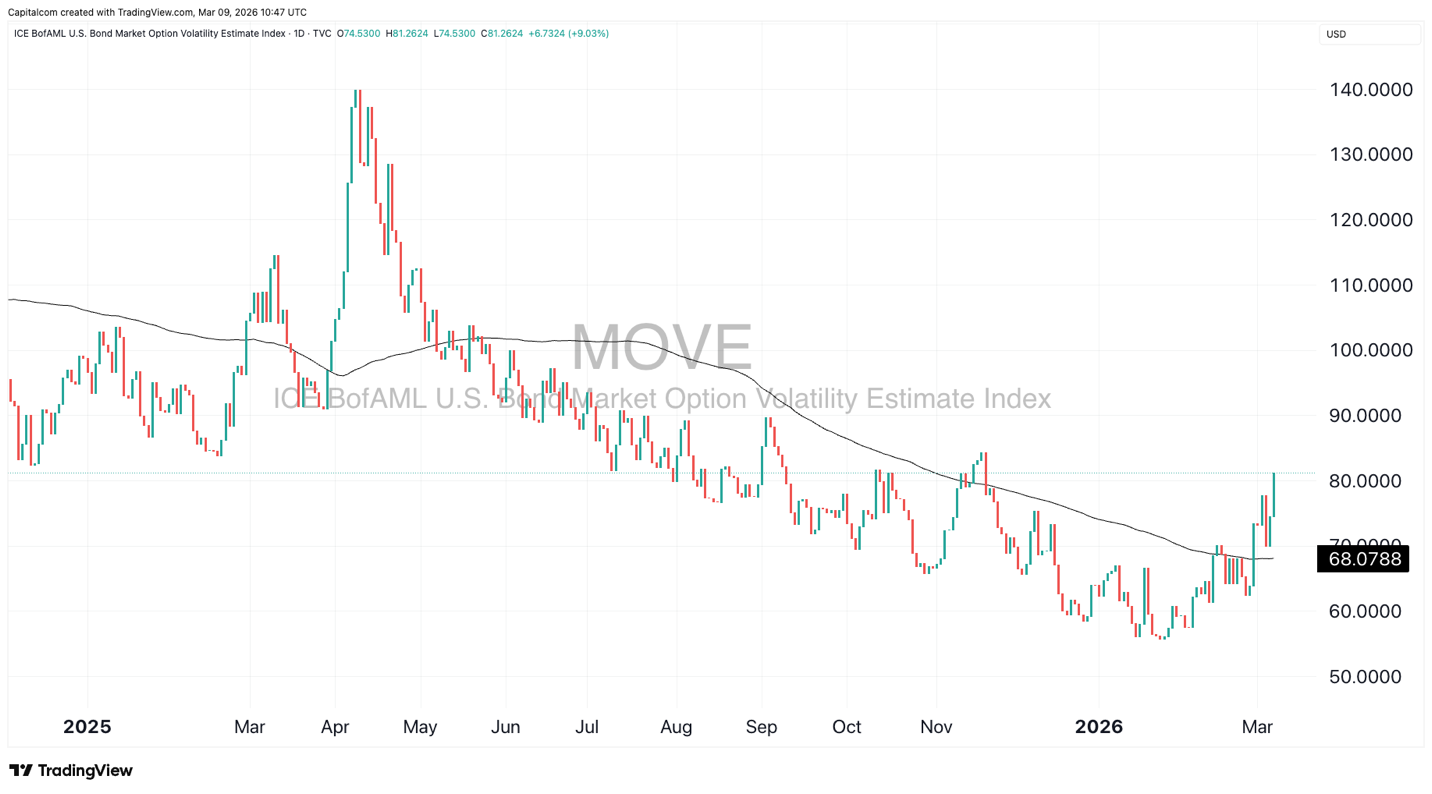
Past performance is not a reliable indicator of future results.
Gold’s counterintuitive pullback
Amid geopolitical turmoil, gold’s recent weakness has puzzled some investors.
Despite its safe-haven reputation, gold fell nearly 4.5% at one point last week and is now hovering below the $5,200 level. Several factors explain the move:
- Positioning was already stretched, with portfolios heavily allocated to gold.
- The US dollar, previously heavily sold, saw a sharp rebound as liquidity demand surged.
- Higher yields and reduced rate-cut expectations pressured non-yielding assets like gold.
- Oil’s dollar pricing mechanically increases demand for the greenback.
While short-term dynamics have created headwinds, the longer-term case for gold remains intact. Geopolitical fragmentation, strained US alliances, fiscal expansion, and diversification away from the dollar system all support its structural appeal. However, at elevated levels, fresh buying becomes harder to justify without a new catalyst.
Gold (XAU/USD) daily chart
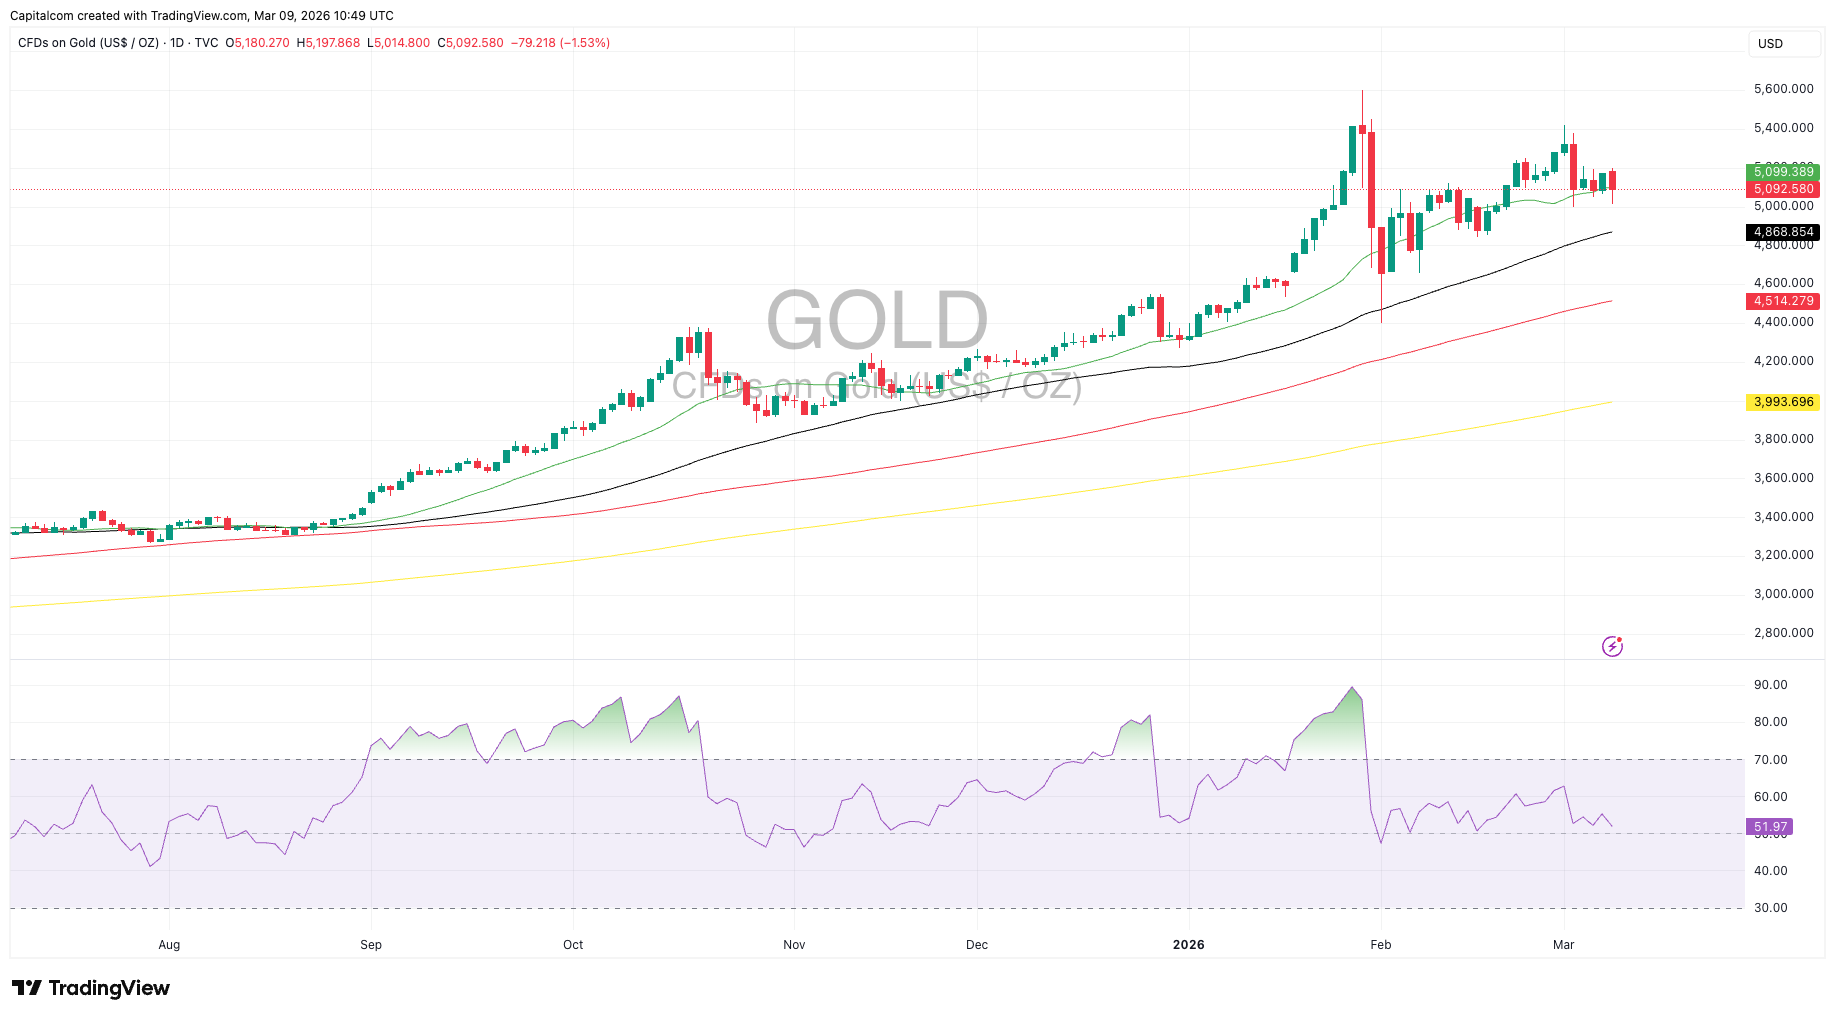
Past performance is not a reliable indicator of future results.
Duration is the key variable
At this stage, markets are less concerned with who ultimately “wins” the conflict and more focused on how long it lasts. Early hopes that the escalation would resemble a limited, isolated exchange have faded. Leadership changes, retaliatory strikes on critical infrastructure, and shipping disruptions have increased the probability of a prolonged conflict. Betting markets suggest a meaningful chance that hostilities could persist into late April or beyond.
As long as duration remains uncertain, volatility is likely to stay elevated across oil, equities, rates, and currencies. For traders and investors, this creates a challenging environment. Following prevailing trends may be prudent, but those trends can reverse quickly on a single headline.
With geopolitical escalation, energy disruption, labour market softening, and critical inflation data all converging, this week could prove pivotal for the broader macro landscape. Markets are no longer operating in a vacuum of complacency. The storm is here — and until there is a clear off-ramp to de-escalation, investors should prepare for continued turbulence across asset classes.