USD/JPY storms past 150 amid rising uncertainty
The Japanese Yen take a hard hit from the leadership change in Japan as markets expect higher fiscal spending and inflation
It has been a challenging few days for the Japanese Yen. USD/JPY has stormed through 150 as traders rushed to offload their yen holdings when it was announced that Sanae Takaichi was elected as the new leader of Japan’s Liberal Democratic Party (LDP). The pair is now trading at a 10-year high nearing 153 with further room to go before encountering possible resistance around 154.5. However, the RSI is nearing the overbought level, which is not often breached for extended periods in USD/JPY, suggesting a reversal may be on the cards. If so, the downside looks well protected below 150.
USD/JPY daily chart
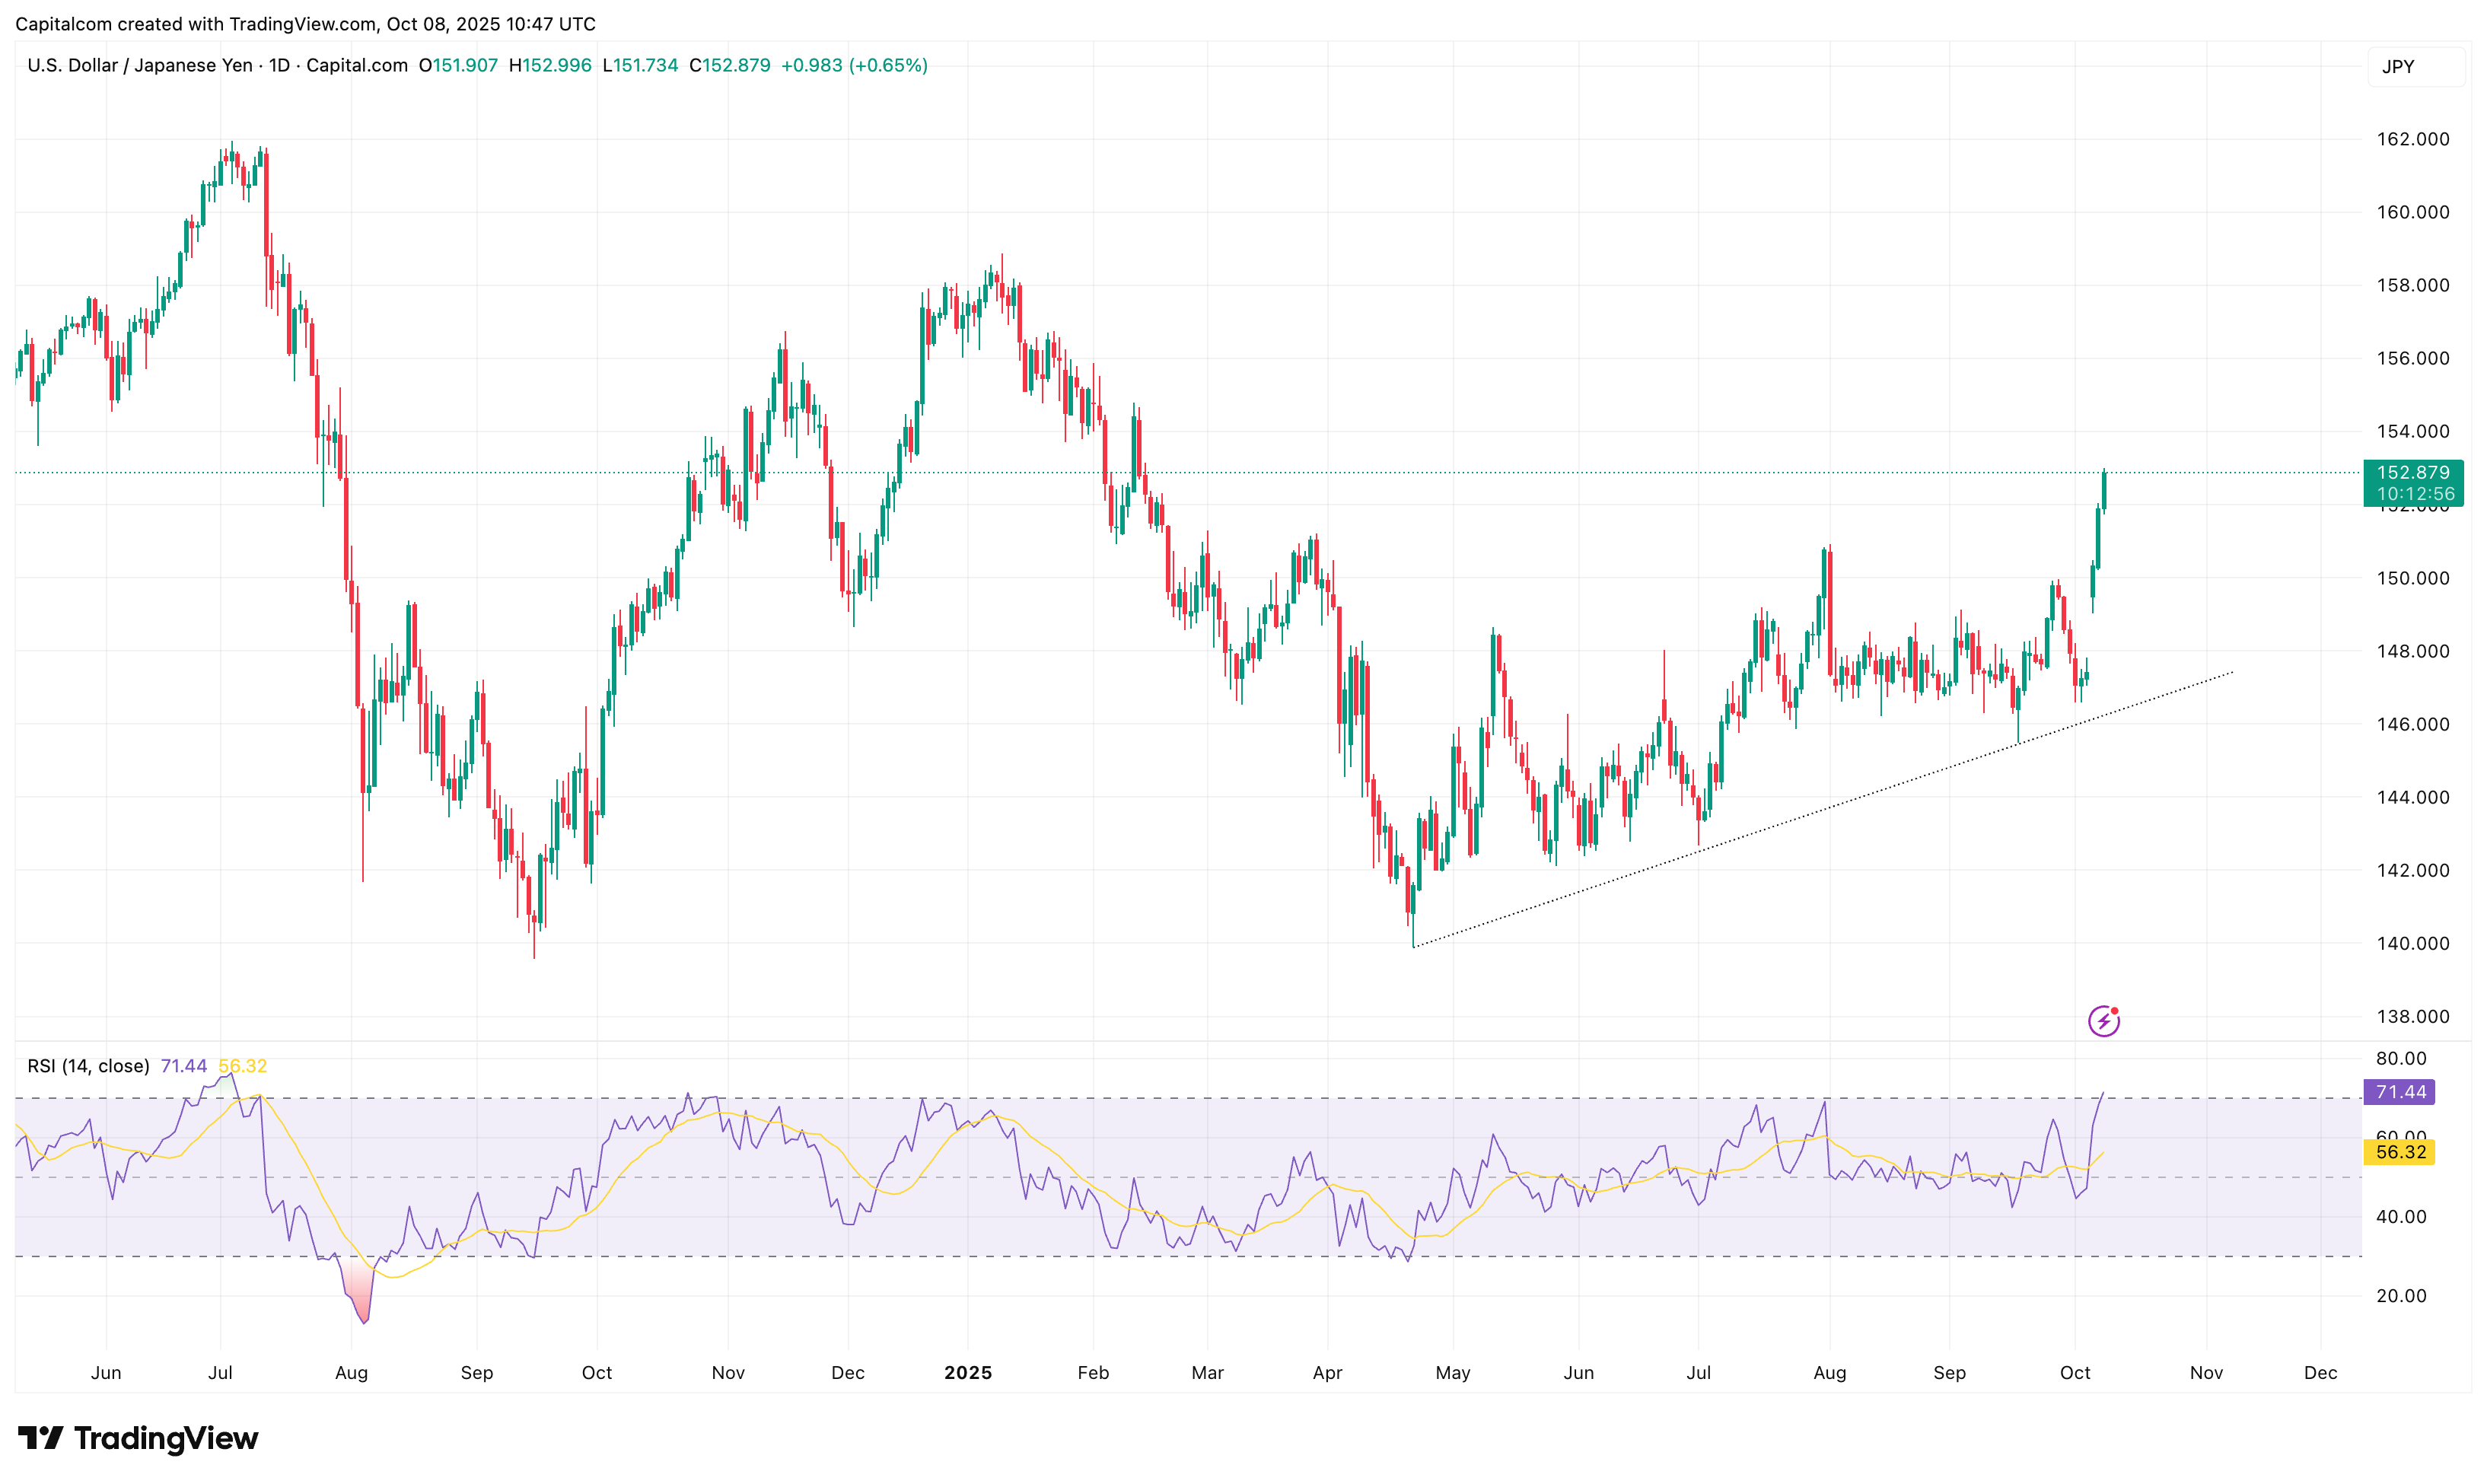
Past performance is not a reliable indicator of future results.
The issue for markets is Takaichi’s economic plans. She has consistently advocated expansionary fiscal policy to stimulate output, a position that has prompted questions about debt dynamics and medium-term sustainability. In the near term, her administration could prefer lower policy rates to support demand, a priority that may conflict with the Bank of Japan’s price-stability mandate.
In fact, Governor Ueda has kept investors guessing on the timing of the next hike, noting global uncertainties; yet a former BoJ executive says the yen’s slide itself could force an earlier move (Oct/Dec) to lean against imported inflation. That tug-of-war—caution from Ueda vs pressure from yen weakness—can be a key driver of near-term direction.
Meanwhile, the US dollar has caught on to a broader shift towards safe havens as political jitters rise, mainly because of the US shutdown and France’s prime-ministerial resignation. Is the move durable? In the short-term, yes. The broader momentum in the Us dollar index seems to be pointing towards technical support after an extended period of downside pressure since the start of the year. The 96 mark seems to have held as the lower end of support, acting as a possible double bottom, with the upside now looking fresh up until just below the 100 mark, at which point resistance may strengthen.
US dollar Index (DXY) daily chart
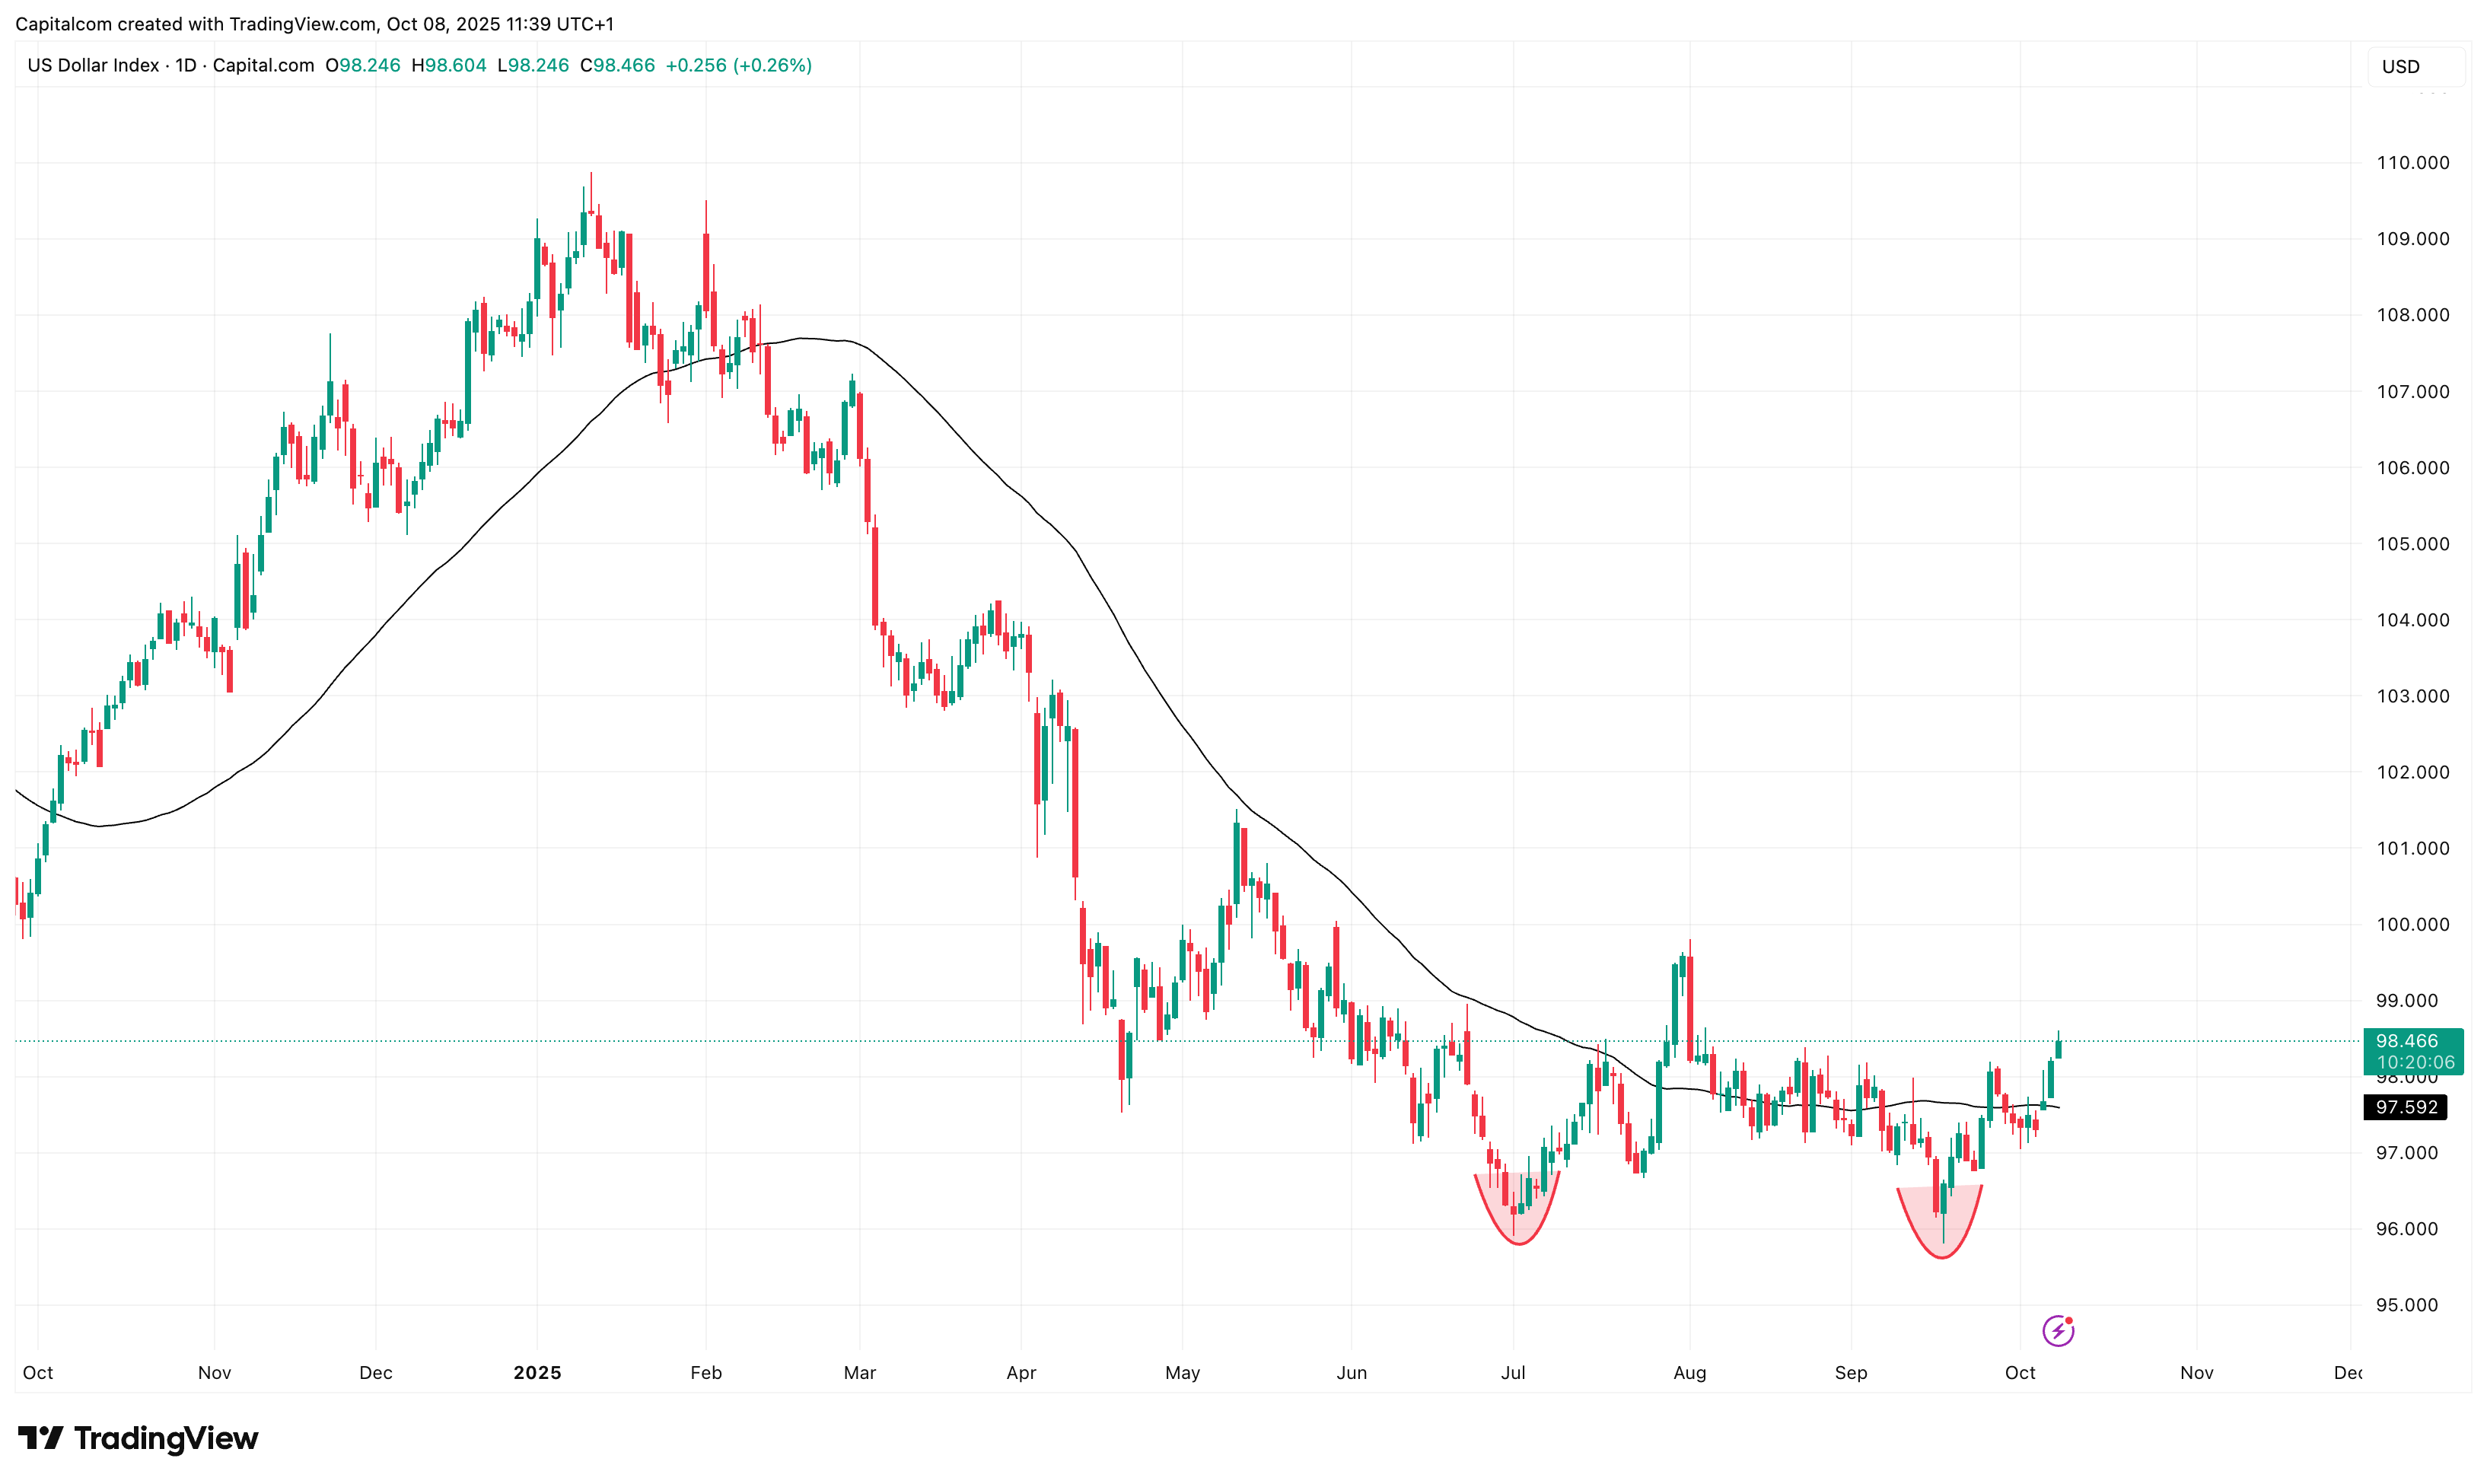
Past performance is not a reliable indicator of future results.