US 30 and US 100 pullback as inflation jitters return
US equity indices pull back from recent highs as traders prepare for the US PCE data
US equities are trading with mixed feelings this week. The Dow Jones (US 30) continues to drop as inflation concerns take hold of sentiment, whilst the US 100 – more tech-focused – continues pushing through the resistance, even if it is becoming tougher. The strong gains in Nvidia backed Tuesday’s move higher. The chip-maker jumped more than 7% last week to a new high as it continues to deliver a stellar performance.
Nevertheless, nerves about the upcoming PCE data in the US are limiting the gains in equity markets. As inflationary pressures remain sticky, markets are concerned about the possibility of lower rates from the Federal Reserve, with hopes for any cut in 2024 slowly diminishing. The PCE data on Friday is likely going to offer some short-term direction to equity traders. A weaker reading could encourage new buyers, pushing the US 100 higher and attempting to reverse the short-term momentum in the US 30. That said, if the data suggests ongoing inflationary pressures then the selloff might intensify across the board.
Technically, the US 100 has further room to pull back compared to the US 30. The tech-heavy index has been holding on to recent gains much better which is evidenced by a robust RSI that remains close to the 70 mark. For the US 30, on the other hand, the RSI has slipped back down towards 40, an area where support has arisen in the past. The immediate level to watch out for is the ascending trendline from the October 2023 and the April 2024 lows, which is currently at 38,357. A drop below this line would likely open up the door for a pullback towards 37,000.
Dow Jones (US 30) daily chart
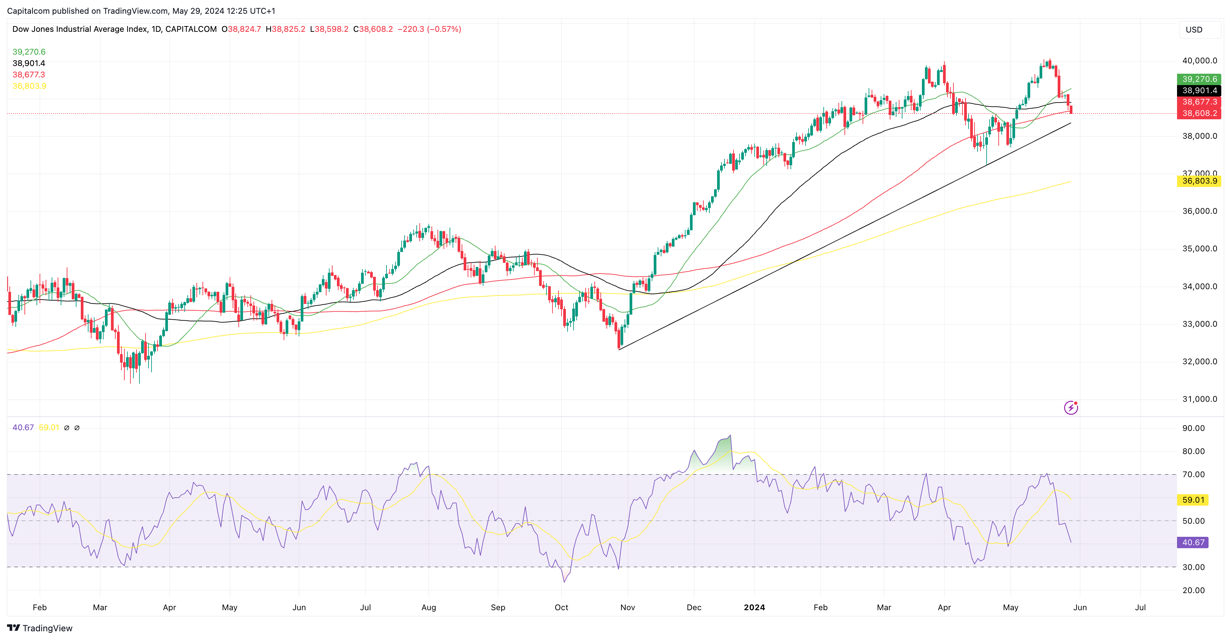 (Past performance is not a reliable indicator of future results)
The US 100 also has an ascending trendline that is likely to offer support. In this case, it arises from the lows in April and May and is 3.8% away from the current price, at 17,960, as opposed to just 0.8% as in the case of the US 30. There is currently a lot of hesitation towards the highs with the index down 1% in Wednesday afternoon trading in London. The fact that the momentum seems to be derived in great part from Nvidia’s performance could be a warning sign of more turbulent times ahead, especially if traders start to believe the stock is currently overpriced and want to take part in any possible pullbacks.
US 100 daily chart
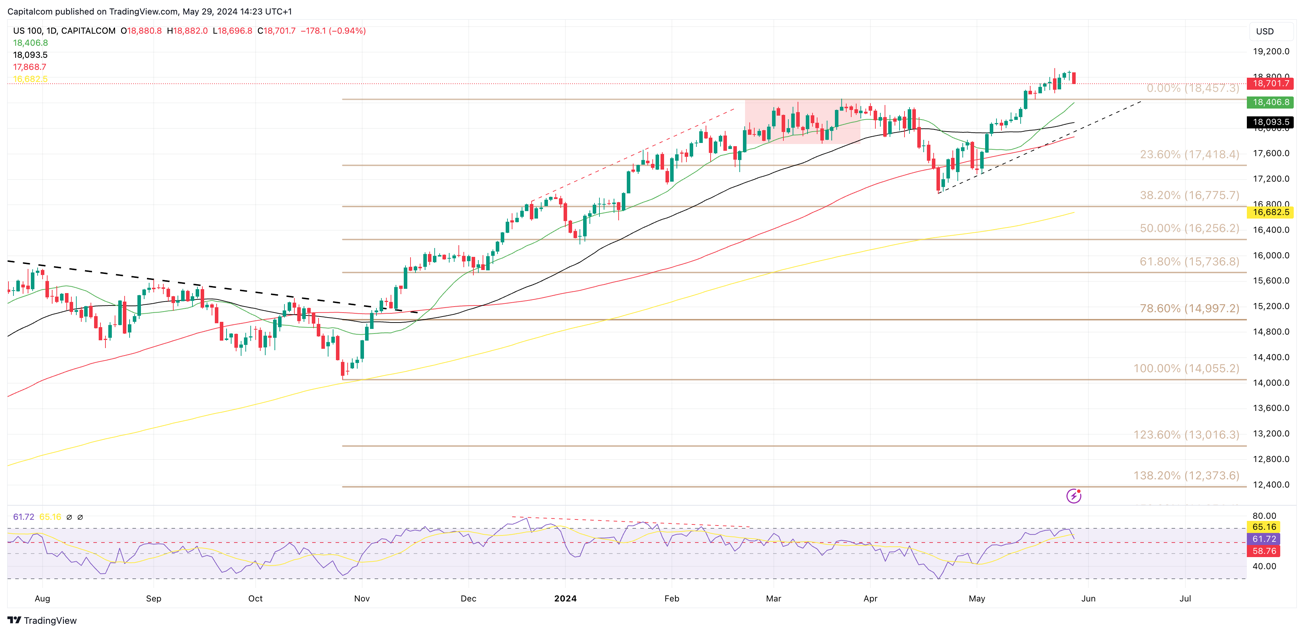 (Past performance is not a reliable indicator of future results)