Oil moves higher as geopolitical risks escalate, WTI faces key resistance range
Increased tensions between Russia and Ukraine lead to higher risks of supply disruptions
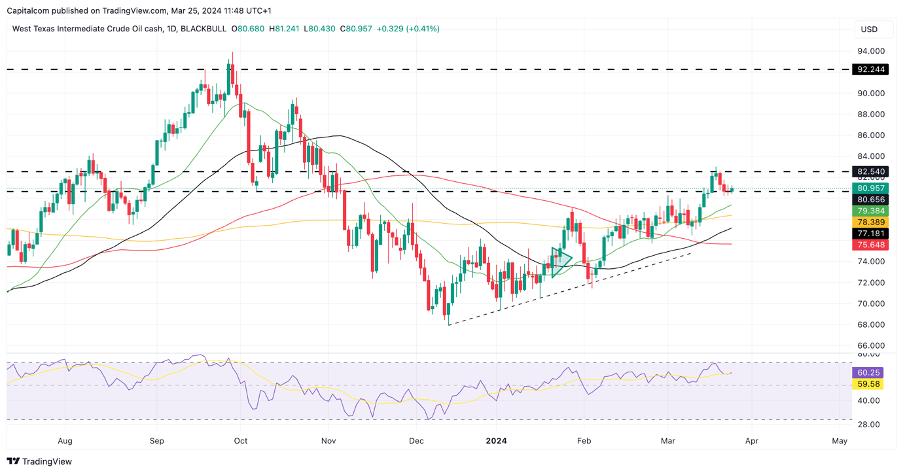
US crude prices have converged to their long-term support/resistance range between $80.65 and $82.54. This area is proving once again to attract increased attention as the price of WTI has touched both the upper and lower boundaries in a matter of four days, suggesting resistance and support remain strong.
Oil prices moved higher on Monday morning as tensions between Russia and Ukraine escalated after the surprise attack on a Moscow concert hall on Friday, an act for which Vladimir Putin blames Ukraine. Officials in Kyiv say the claims are absurd but that hasn’t stopped Russia from retaliating with a series of missile attacks. Whilst the tensions in the Middle East have been present for over a year, the escalation in attacks and finger-pointing has traders pricing in a higher risk of supply disruptions given recent attacks on oil infrastructures, which provides short-term bullish support for oil prices
Meanwhile, the latest data showed oil inventories dropping in the US for a second week. Analysts were forecasting inventories to drop by 900 thousand barrels and the actual data showed a drop of almost two million barrels in the week to March 15th, which implies stronger demand for crude. Robust economic growth in the US is also helping keep oil prices supported, as is improving economic data in China, which has been a source of weakness in previous months.
United States Crude Oil Stocks Change
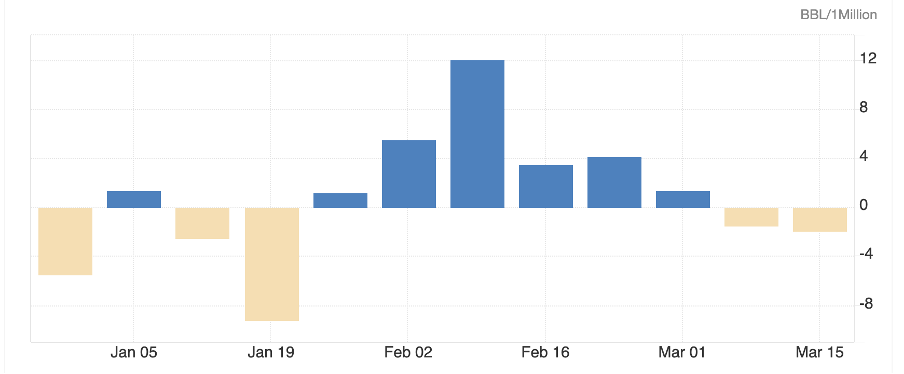
Source: Trading Economics
Technically, US crude price continues to point higher in the medium term, but traders will need to overcome resistance at $82.54 in the short term. This area continues to provide strong resistance so it may take a few attempts to break above it. If so, the path higher seems pretty clear until $85.50 at which point buyers may be faced with increased selling pressure once again. If buyers are unable to break above the key resistance range, there is short-term support at $80.65, followed by the 200-day SMA at $78.40.
US crude (WTI) daily chart
Past performance is not a reliable indicator of future results