Natural gas price forecast: Third-party outlook
US natural gas prices are influenced by a complex mix of seasonal demand, weather patterns, production trends and global energy flows. Explore third-party analyst perspectives and technical indicators.
Recent moves come amid weaker US natural gas futures, which have been under pressure as warmer-than-normal weather forecasts reduce projected heating demand into mid-January. Recent sessions have also seen prices slide on lower nationwide consumption expectations (Investing.com, 6 January 2026). Market commentary continues to focus on US production and LNG export trends, with the US Energy Information Administration noting robust output of around 109 billion cubic feet per day in its 2026 forecasts (EIA, 9 December 2025), while front-month futures on CME traded lower on the day alongside these fundamental signals (Wall Street Journal, 2 January 2026).
Natural gas price forecast 2026-2030: Analyst price target view
As of 6 January 2025, third-party natural gas price predictions over the medium term focus mainly on benchmark Henry Hub spot prices and regional gas hubs, with forecasts typically expressed as annual or seasonal averages rather than specific month-end targets. Across recent outlooks, institutions emphasise weather patterns, storage levels, LNG exports and production growth as the key variables shaping expected price paths, particularly across the nearer years of the forecast horizon.
US Energy Information Administration (STEO baseline)
The US Energy Information Administration forecasts Henry Hub spot natural gas prices to average around $3.56 per MMBtu in 2025 and $4.01 per MMBtu in 2026. These projections sit alongside expectations for dry gas production to reach about 109.1 billion cubic feet per day in 2026. The agency links this price path to a colder early winter that lifted near-term heating demand and storage withdrawals, while higher production and inventories above the five-year average are expected to moderate prices later in the outlook period(S&P Global, 9 December 2025).
American Gas Association (market indicators)
The American Gas Association’s Natural Gas Market Indicators note that the December Short-Term Energy Outlook raised its US winter spot price forecast to an average of almost $4.30 per MMBtu, while keeping the projected 2026 spot price near $4.01 per MMBtu as of 10 December 2025. The report cites stronger early-winter pricing with colder conditions, while suggesting that ample supply and expectations for lower residential retail gas rates in 2026 could temper the pass-through of wholesale price levels to end users (American Gas Association, 11 December 2025).
RSM US (macro energy outlook)
RSM US highlights an EIA forecast that Henry Hub natural gas prices will average about $3.90 per MMBtu in 2026, compared with levels near $2 in 2024, in an outlook published on 25 November 2025. The firm notes that this higher mid-2020s price environment is underpinned by anticipated demand growth, including power-sector use, and references views from other data providers that point to potential upside risk towards the high-$4 range by late 2025 (RSM US, 26 November 2025).
Bernstein (Americas natural gas outlook)
Bernstein’s Americas Natural Gas Outlook 2026 reiterates a long-term mid-cycle Henry Hub price assumption of about $5 per thousand cubic feet for 2026, maintaining this level as of 20 December 2025 despite recent spot price volatility. The research describes what it terms a post-$3.50 equilibrium, suggesting that structurally higher demand and supply-cost dynamics could support a higher average clearing price over time (Yahoo Finance, 20 December 2025).
Predictions and third-party forecasts are inherently uncertain, as they cannot fully account for unexpected market developments. Past performance is not a reliable indicator of future results.
Natural gas price: Technical overview
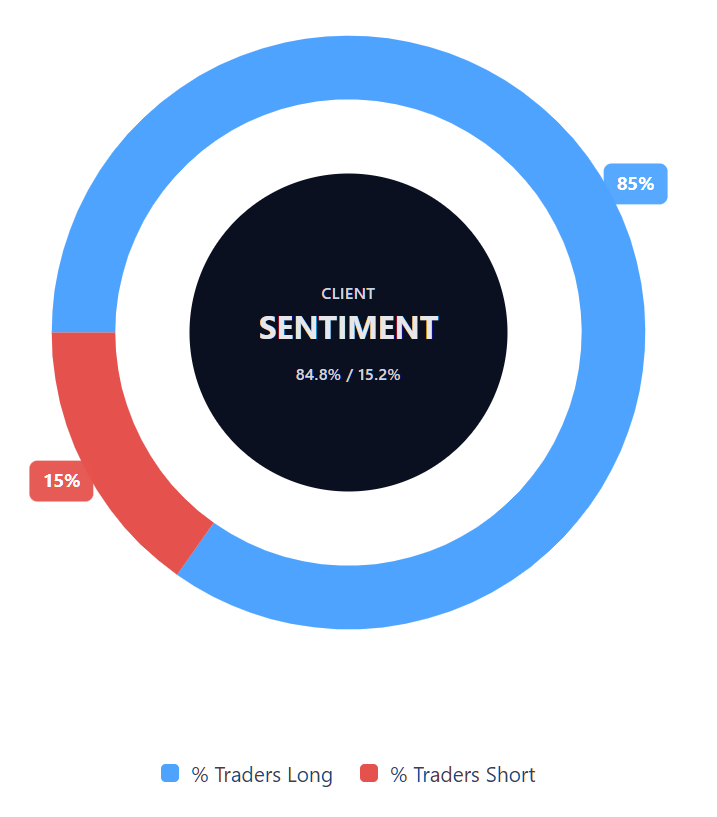
US natural gas is quoted around $3.20 as of 12:30pm on 6 January 2026 (UTC), with price holding well below the short-term 10-, 20- and 30-day simple moving averages clustered near $3.87, $4.00 and $4.20, and the 50-, 100- and 200-day SMAs around $4.10, $3.55 and $3.46, underscoring a market trading beneath its recent trend band. The 14-day RSI near 35.8 sits in lower-neutral territory rather than oversold, while an ADX reading around 20.4 points to a modest, not strongly established, directional trend. Downside momentum is also reflected by negative MACD and Momentum signals. Client sentiment on the platform, with buyers representing 84.78% of positions versus 15.22% sellers, highlights a pronounced positioning skew even as price remains below its main moving-average cluster.
On the topside, the nearest classic resistance sits at the R1 pivot around $4.87, with R2 near $5.89 coming into view only if a daily close above the initial pivot level were to develop. On the downside, the classic pivot at $4.25 acts as the first technical reference, followed by the 100-day SMA zone near $3.55 as a key moving-average area. A sustained break below this broader trend zone would risk exposing the lower S1 region around $3.23 as the next notable support area (TradingView, 6 January 2026).
This is technical analysis for informational purposes only and does not constitute financial advice or a recommendation to buy or sell any instrument.
Natural gas price history
US natural gas has experienced a full round trip over the past two years, moving from sub-$2.00 levels in early 2024 to above $5.00 in late 2025 before sliding back towards the low $3s by early 2026. Prices traded largely between $2.75 and $3.50 through much of 2024, with the market closing the year at about $3.53 on 31 December 2024 before starting 2025 near $3.49 and trading mostly within a $3.00–$4.50 range into the spring.
Volatility increased sharply from March 2025, as US natural gas rose from roughly $3.78 at the end of February to above $4.90 in early March, before continuing higher to a peak close of $5.18 on 5 December 2025 and then easing into year-end around $3.62. By 6 January 2026, US natural gas had pulled back to about $3.21, leaving it slightly below where it began in 2025 but still above many of the sub-$2.50 closes recorded in the first half of 2024.
Past performance is not a reliable indicator of future results. Share prices are indicative and may differ from live market prices.
Natural gas price outlook: Capital.com analyst view
Capital.com analyst Daniela Hathorn notes that recent moves in US natural gas reflect a market adjusting after a sharp early-December rally. She observes that prices have ‘fallen sharply since the 5 December 2025 highs, declining by more than 30%’, as weather expectations shifted and speculative positioning unwound.
Hathorn explains that the initial surge was closely linked to forecasts for colder conditions across key US demand regions, which ‘prompted aggressive speculative buying’. However, she adds that forecast models have since shifted consistently towards milder-than-normal temperatures, sharply reducing heating demand expectations at a time when the market had been positioned for scarcity. This change in outlook has weighed on prices, particularly as production remains elevated.
Geopolitical and supply dynamics continue to play a role in the background. According to Hathorn, ‘European energy security concerns related to Russia–Ukraine tensions continue to influence pricing indirectly via LNG flows’, while US fundamentals remain relatively well supplied. She points out that ‘storage levels remain well above critical stress thresholds, and US production is still historically high’, which may limit the scope for sustained upside.
From a technical perspective, Hathorn notes that momentum indicators are softening. She highlights that ‘the daily chart shows the RSI approaching oversold territory’, suggesting prices are moving towards areas where demand has previously emerged. At the same time, she cautions that ‘there may still be scope for further downside’, with the market nearing a broader sideways range where both support and resistance have tended to form.
Capital.com’s client sentiment for natural gas CFDs
As of 6 January 2026, Capital.com client positioning towards US natural gas CFDs shows 84.8% buyers versus 15.2% sellers, representing a heavy-buy, one-sided skew towards long positions that puts buyers ahead by around 69.6 percentage points. This positioning remains firmly buy-dominated, while reflecting only the current balance of open positions rather than a directional signal. This snapshot reflects open positions on Capital.com and may change over time.
Summary – natural gas price 2026
- US natural gas traded within a wide range during 2025, moving from the low-$3.00 area at the start of the year to a December closing high near $5.18 on 5 December 2025, before pulling back into year-end.
- The CFD recorded several strong rallies through March and late autumn 2025, interspersed with sharp corrections, highlighting the market’s sensitivity to shifting fundamentals.
- By 31 December 2025, US natural gas had retreated to about $3.62, leaving it only modestly higher than at the start of 2025 despite the brief move above $5.00 in December.
Past performance is not a reliable indicator of future results.
FAQ
What is the natural gas price forecast?
Natural gas price forecasts typically focus on benchmark prices such as Henry Hub and are usually expressed as seasonal or annual averages rather than precise short-term targets. Current projections from major institutions, as of 6 January 2025, highlight weather patterns, storage levels, LNG exports, and production trends as the primary factors shaping price expectations. While some forecasts point to higher average prices during peak winter demand, others anticipate a period of moderation as production remains elevated and demand conditions evolve. These projections reflect a range of possible scenarios rather than a single, fixed outcome.
Could natural gas prices go up or down?
Natural gas prices can move both higher and lower, often reacting to changes in weather forecasts, demand expectations, supply conditions and geopolitical developments. Colder-than-expected weather can increase heating demand and support prices, while milder conditions, high production or ample storage may weigh on the market. In addition, shifts in speculative positioning and technical factors can contribute to short-term volatility. As a result, price movements are often uneven and may change direction over relatively short periods.
Should I invest in natural gas?
Whether natural gas is suitable for you depends on your individual financial situation, objectives and risk tolerance. Natural gas markets are known for periods of heightened volatility, which can amplify both potential gains and losses, particularly when trading leveraged products. It’s important to understand the risks involved, consider how this market fits within a broader approach, and ensure you are comfortable with possible outcomes. This information is provided for general market context only and does not constitute investment advice.
How can I trade natural gas CFDs on Capital.com?
You can trade natural gas CFDs on Capital.com, which allow you to speculate on price movements without owning the underlying commodity. Contracts for difference (CFDs) let you take long or short positions and access risk management tools such as take-profit and stop-loss orders. CFDs are traded on margin – leverage amplifies both your profits and your losses.*
*Standard stop-loss orders aren’t guaranteed. Guaranteed stop-loss orders (GSLOs) incur a fee if activated.