Market Volatility Rises as Metals Swing and Netflix Slides
Gold and silver continued to experience considerable volatility during trading on Wednesday, 22 October, with both metals seeing notable intraday fluctuations.
Meanwhile, equity market volatility was elevated, as stocks plunged midday amid renewed concerns over a potential deterioration in U.S.–China trade relations. Lastly, Netflix fell sharply following a disappointing earnings report.

S&P 500
The S&P 500 fell by more than 1% on Wednesday, 22 October, before rebounding and finishing lower by around 50 bps. That intraday decline allowed the index to fill the gap created on Monday, 20 October.
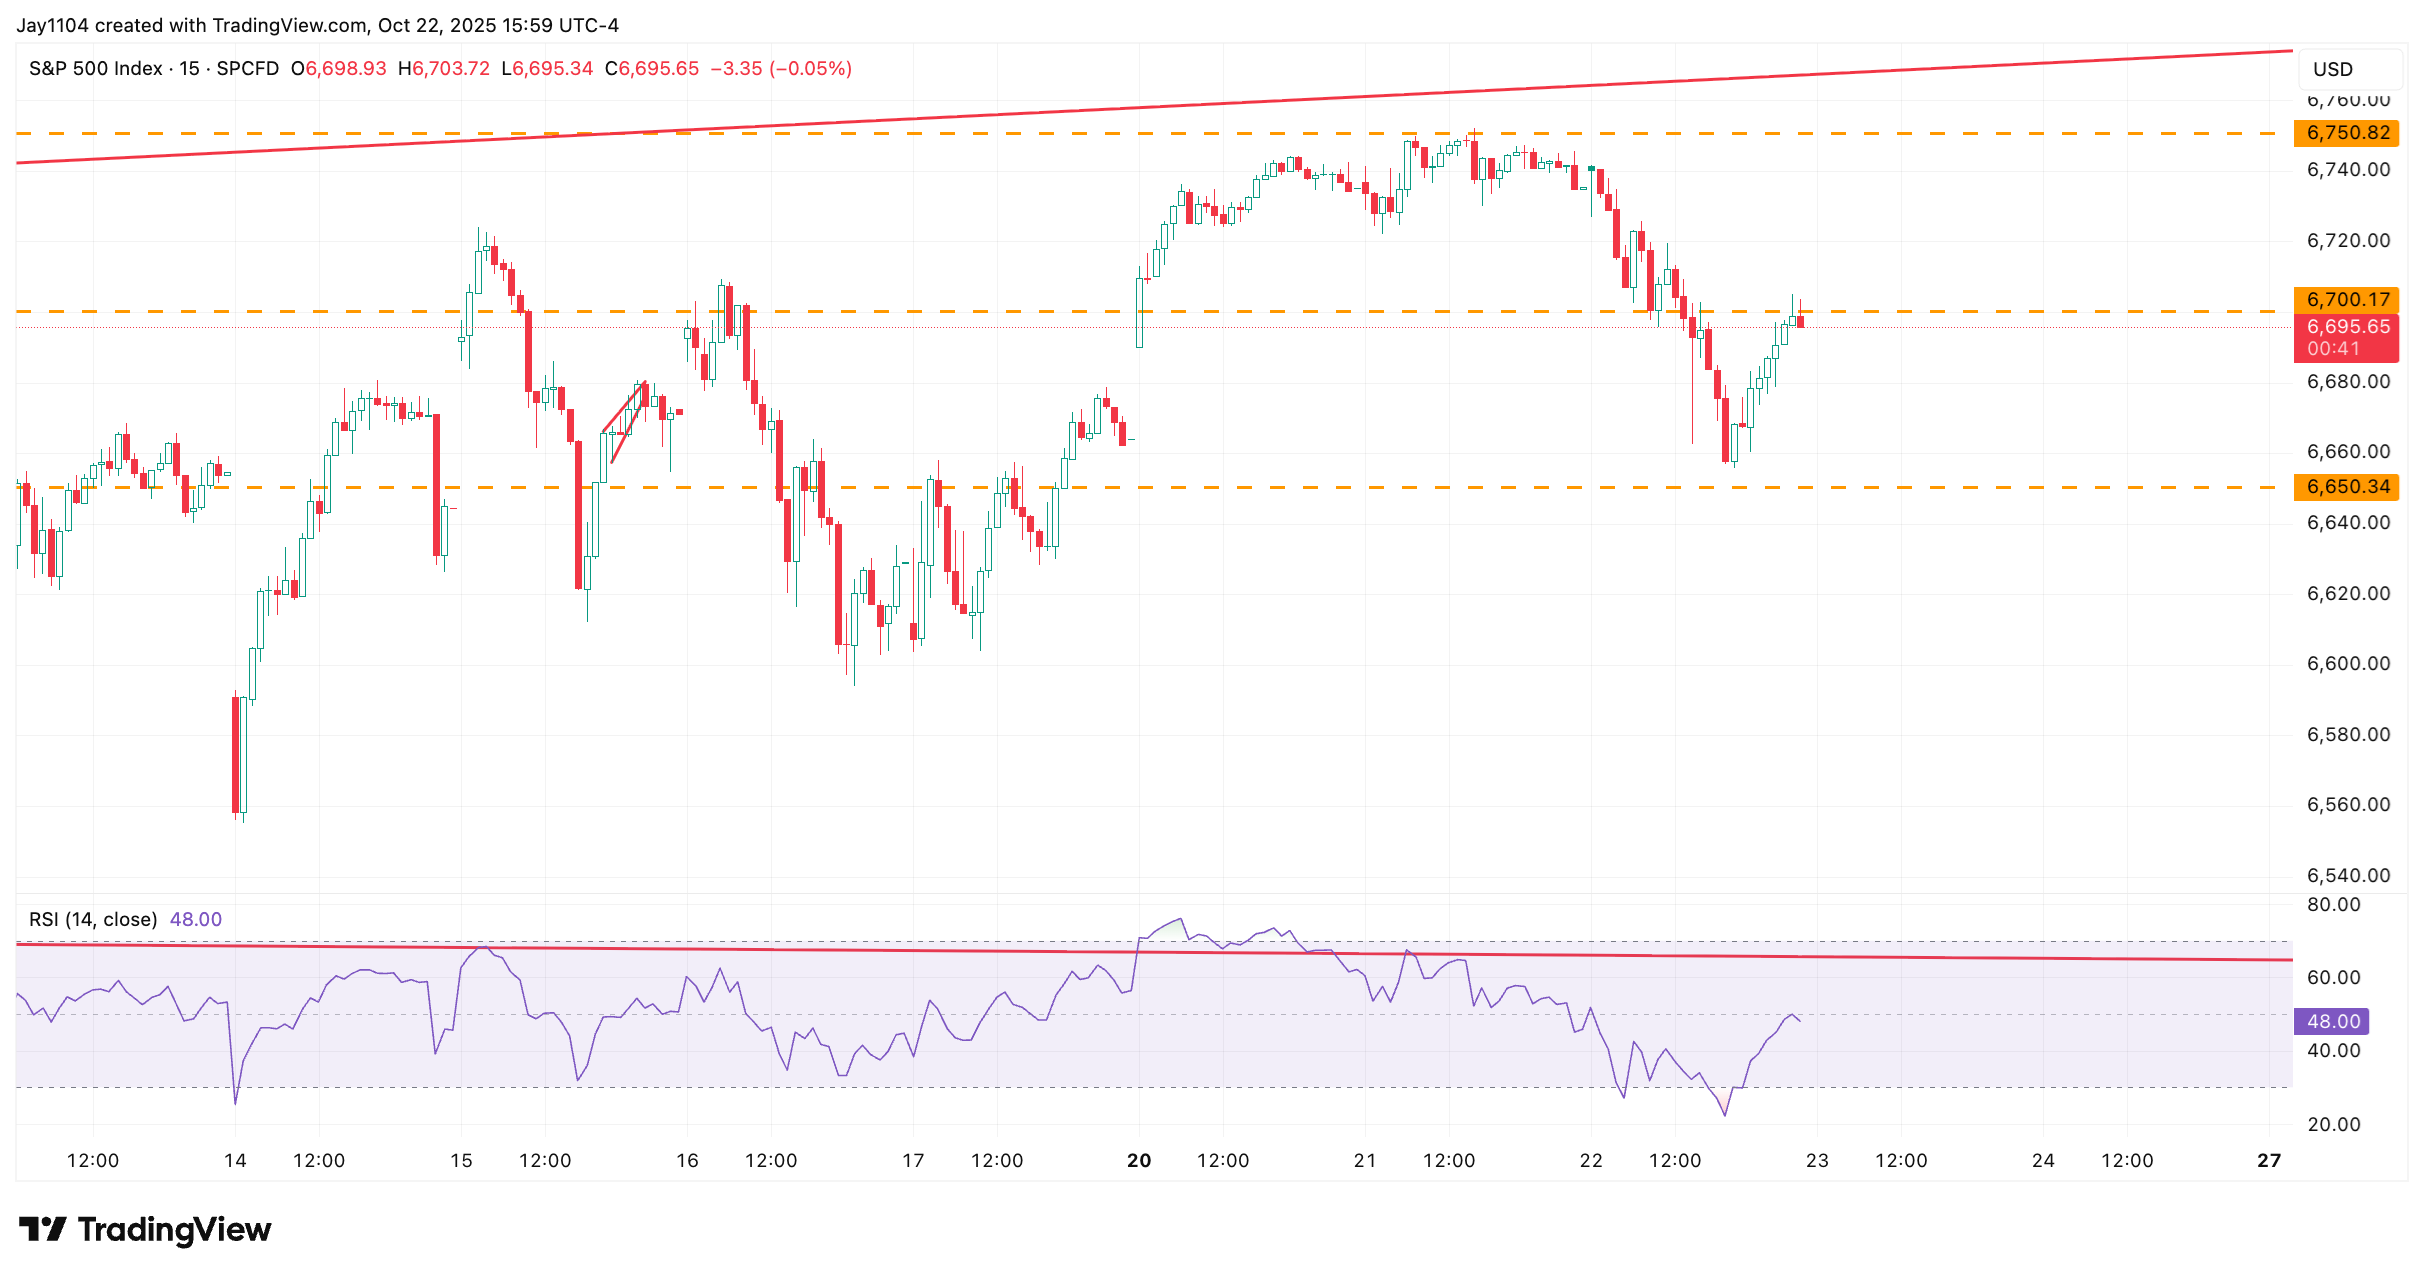 (Source: TradingView)
(Past performance is not a reliable indicator of future results)
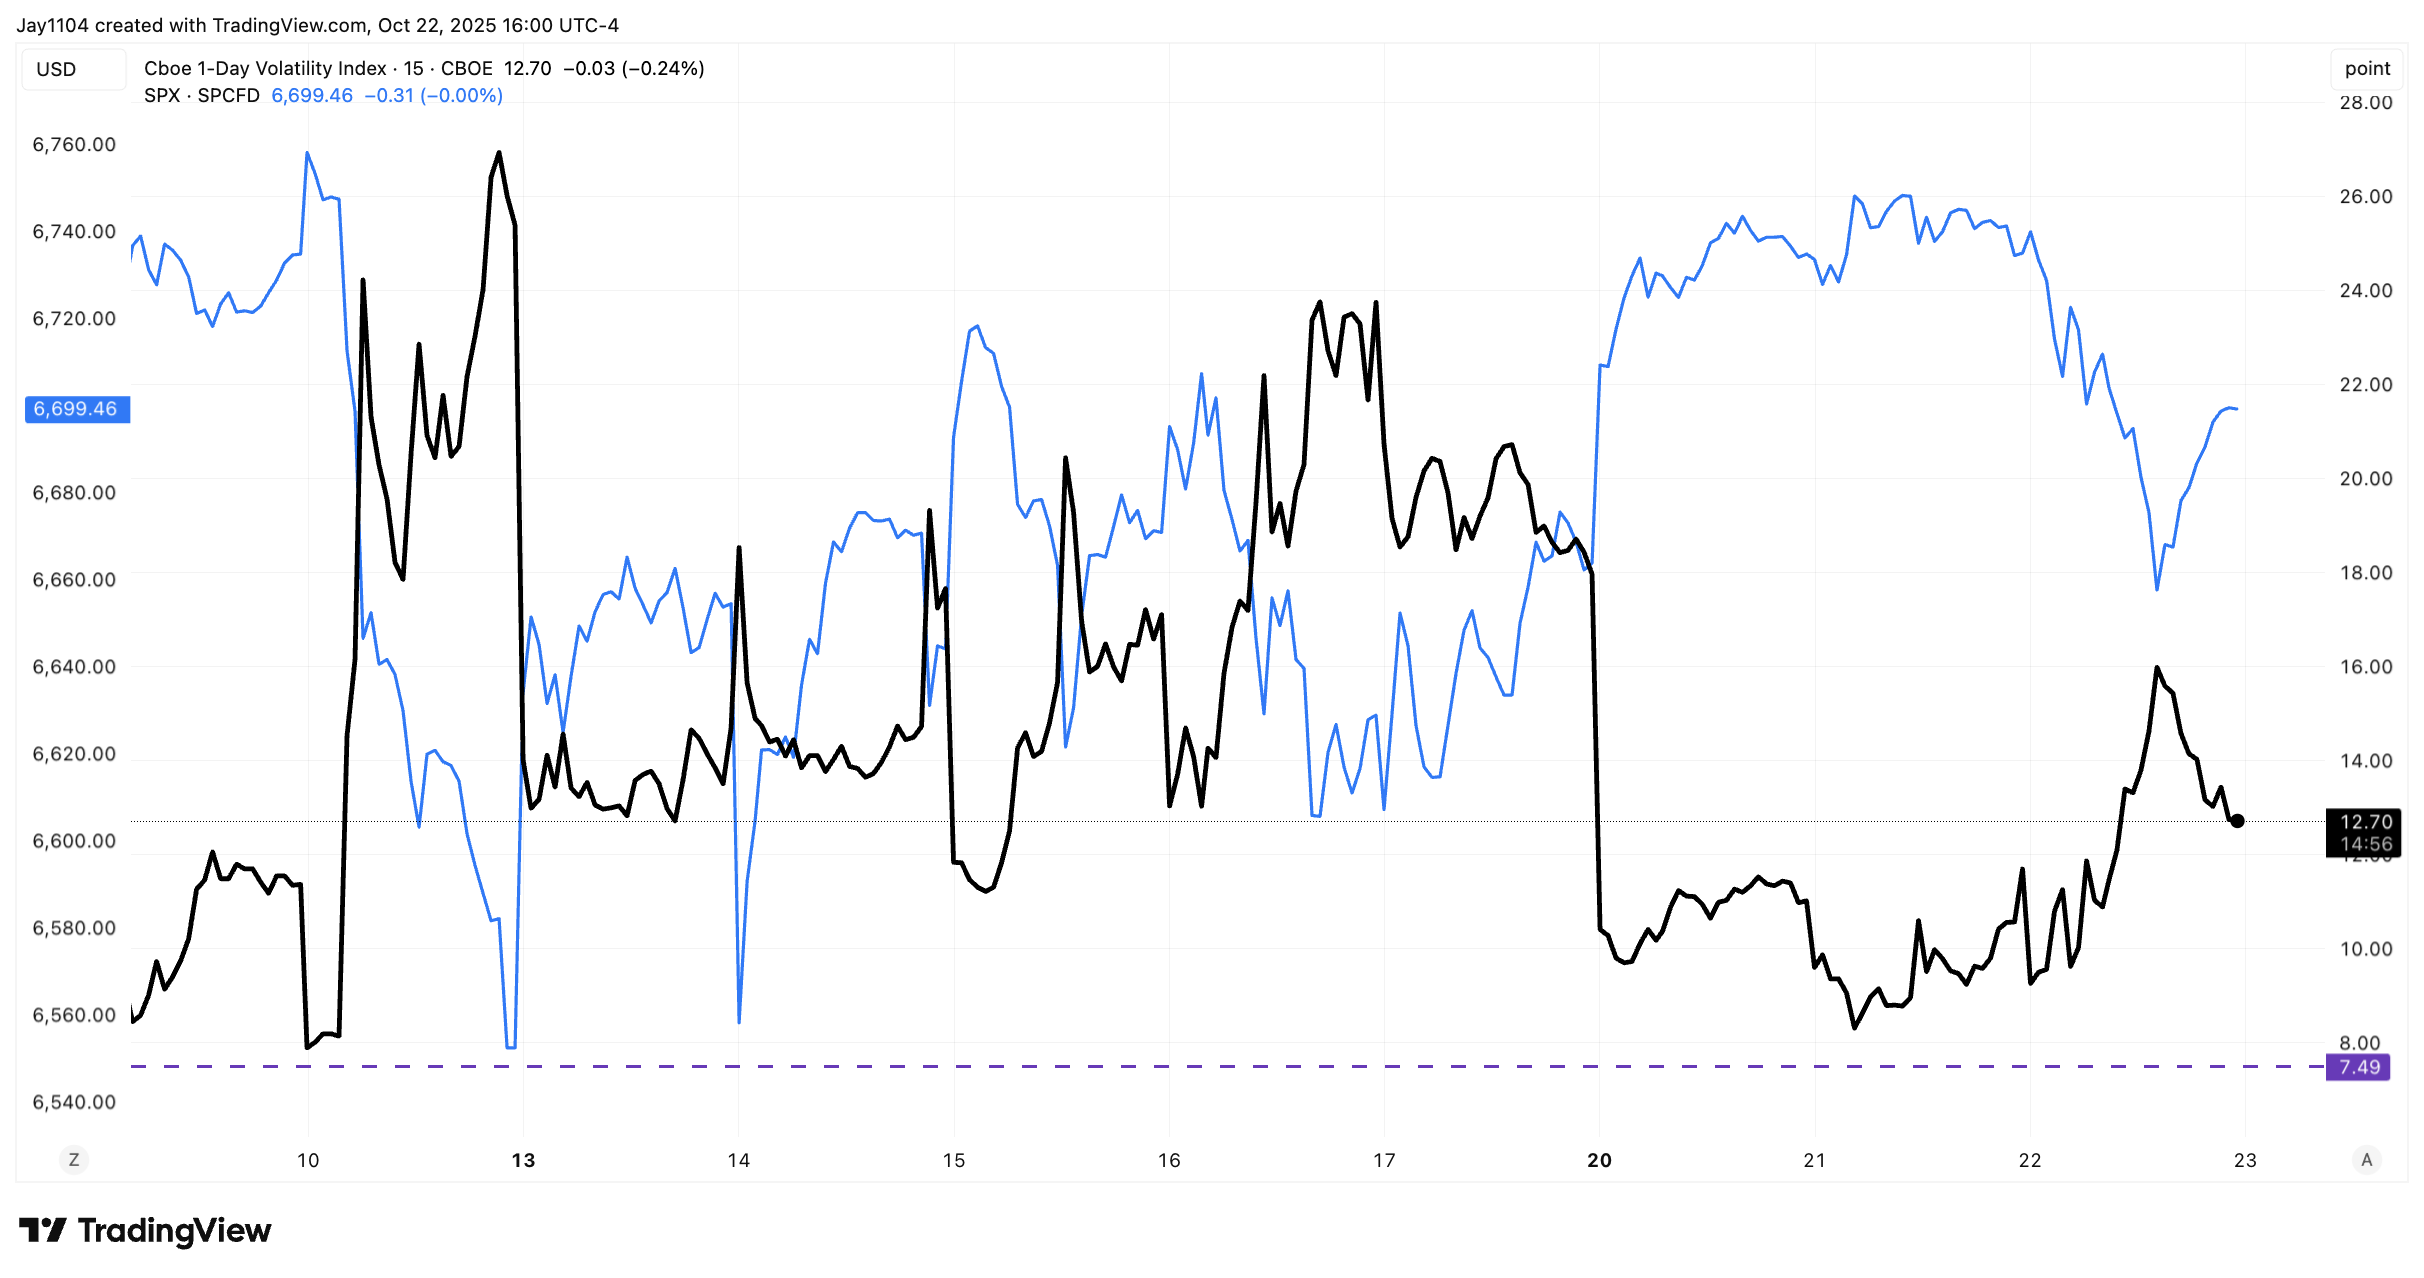
Also, with the CPI report due to be released in the U.S. on Friday, 24 October at 8:30 a.m. Eastern Time, traders should pay very close attention to the VIX 1-Day on Thursday, 23 October. The higher the VIX 1-Day rises heading into the report on Friday morning, the greater the likelihood that the S&P 500 will stage a strong rebound following the release, as historically observed in previous S&P 500 scenarios where rebounds coincided. Although it should be noted that this may not always be the case.
We’ve seen this pattern play out a few times recently. There was a sharp decline in the S&P 500 on Friday, 10 October, which sent the VIX 1-Day surging to around 25.7. The VIX 1-Day also rose to 17.9 on Friday, 17 October, which was followed by a 1.6% rally in the S&P 500 on Monday, 13 October, and another 1% gain on Monday, 20 October.
 (Source: TradingView)
(Past performance is not a reliable indicator of future results)
It’s worth keeping an eye on the VIX 1-Day, because the higher implied volatility becomes ahead of the CPI report, the more likely it is that equities will experience a meaningful rebound after ward the report, potentially regardless of whether the data comes in hot or cold.
Netflix Drops
To no surprise, Netflix fell by around 10% on Wednesday after reporting earnings on the afternoon of Tuesday, 21 October. The stock dropped below the $1,150 gamma support level, reaching a low of $1,109 on Wednesday, 22 October, indicating that the $1,100 gamma level remained sufficient to prevent further decline.
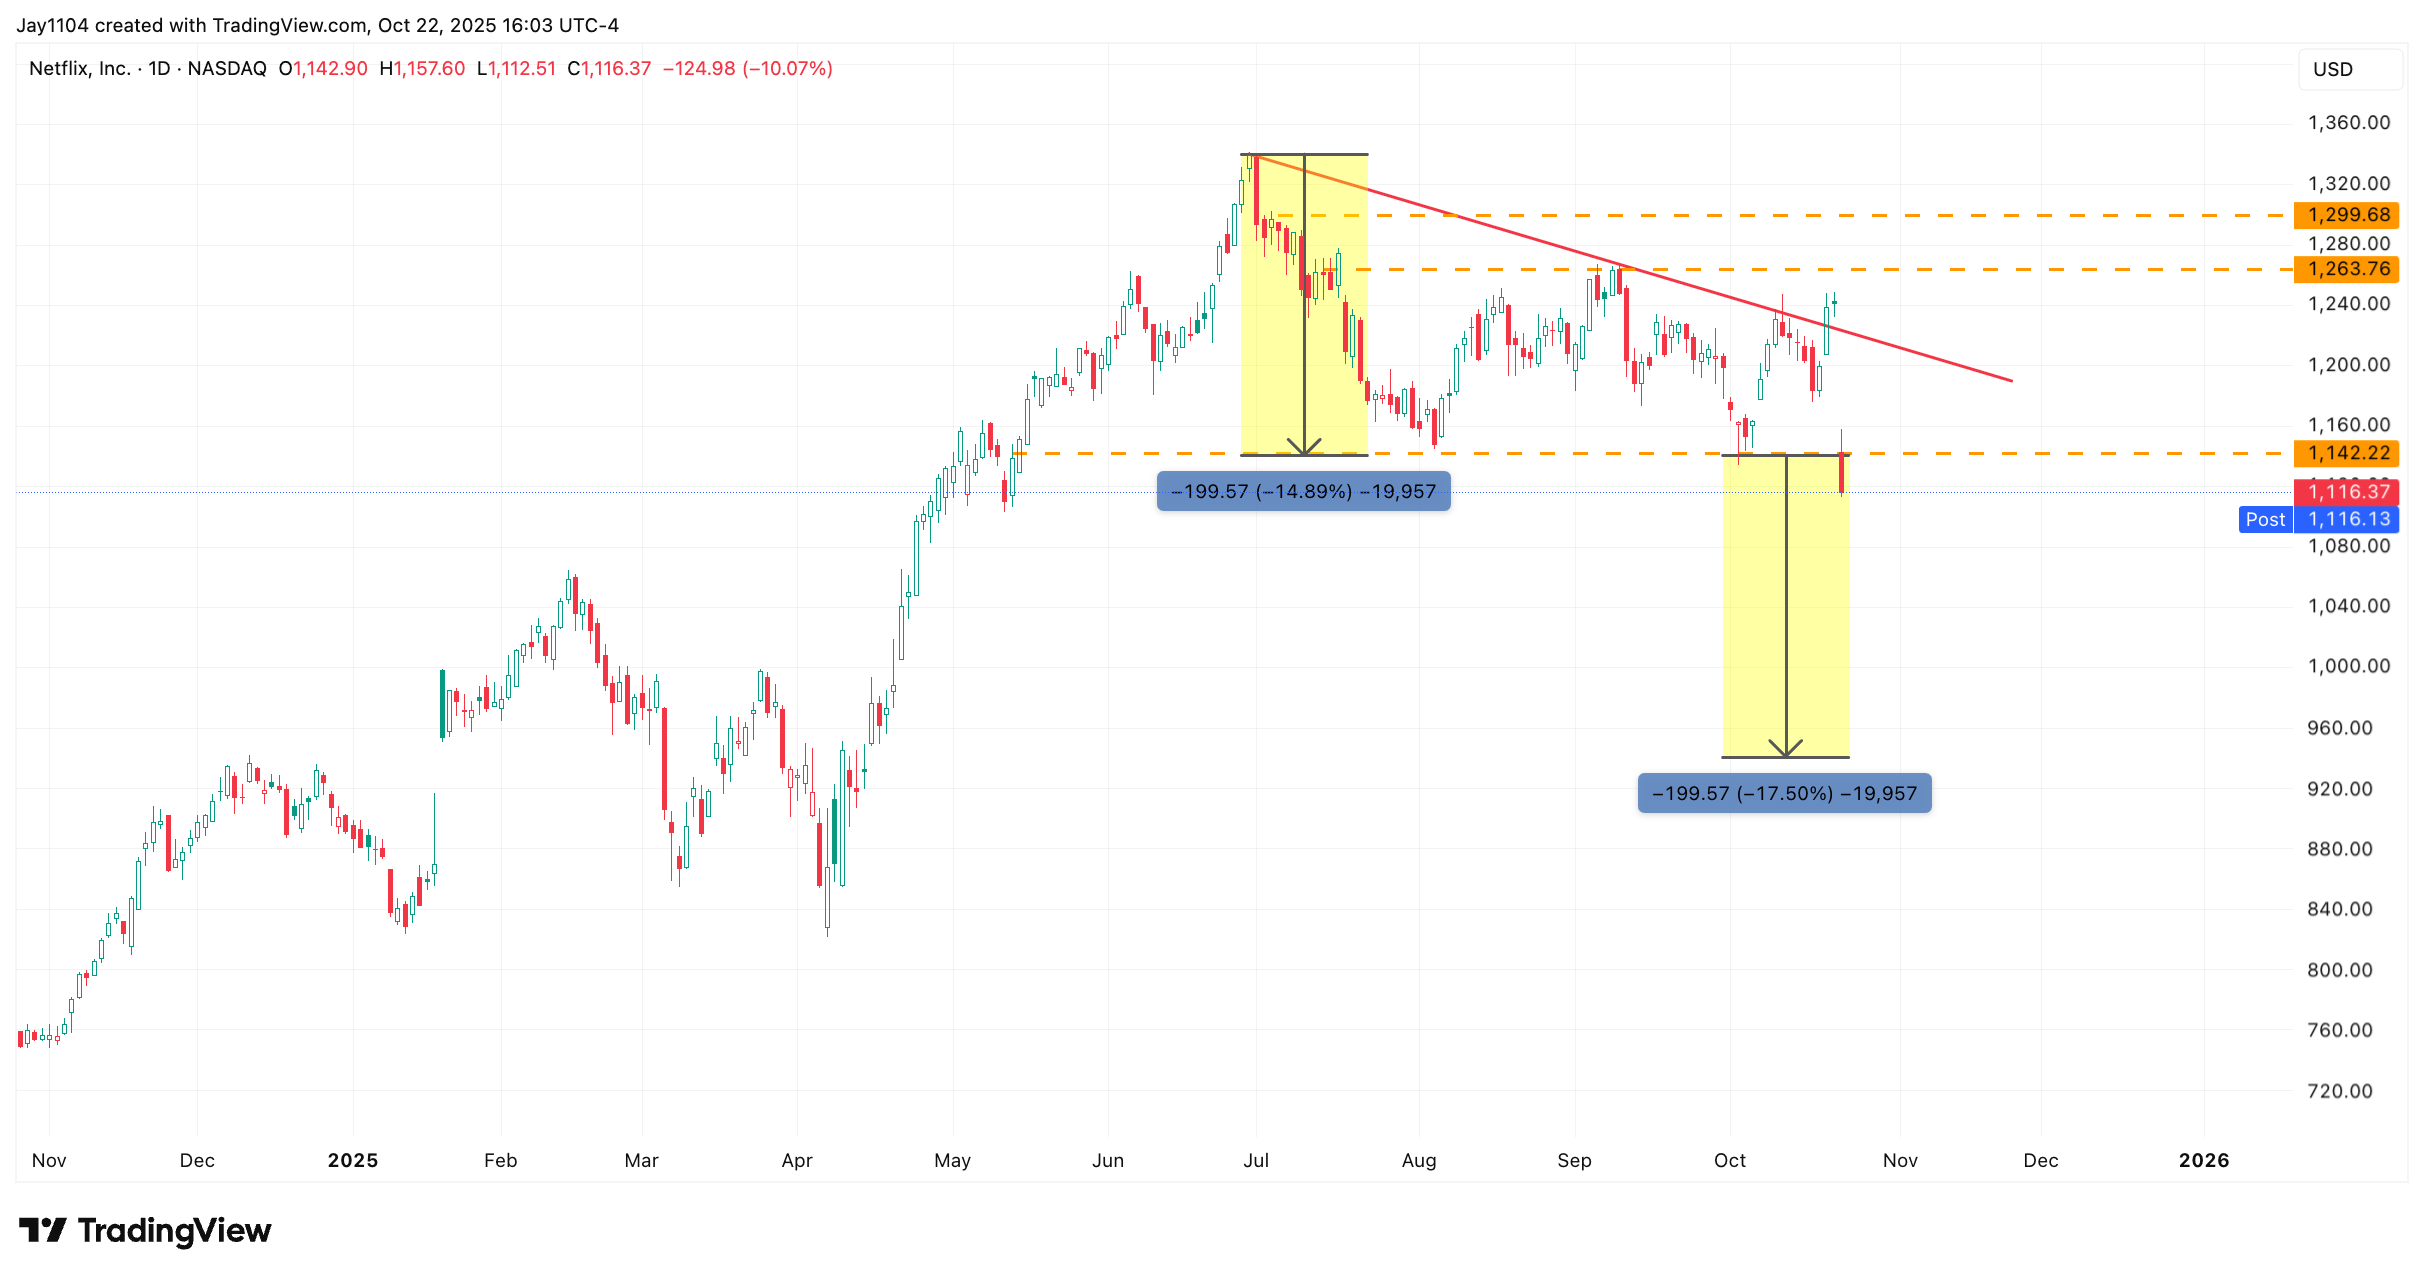 (Source: TradingView)
(Past performance is not a reliable indicator of future results)
Of course, these option gamma levels are expected to adjustwill now change following the company’s results, as implied volatility has declined sharply and open interest has reshuffled. From a technical standpoint, a break below $1,100 could pave the way for further weakness toward the $1,000 areafor a much steeper decline in Netflix’s share price, potentially back towards the $1,000 range, where there remains an open gap created on 22 April. Such a move would represent a very sharp drop, but given the stock’s straight-line advance following April earnings, a breach of $1,100 might lead to additional selling pressure.a break below $1,100 could indeed trigger further weakness. For now, resistance appears likely to remain firm around $1,150.
Additionally, a descending triangle appears to have formed, and the lower boundary of that pattern was broken today. Based on the projected move following the breakdown, this could imply a potential decline in the stock towards the $940 level.
Gold
Gold fell by another 1% on Wednesday, reaching a low of around $4,004. Interestingly, the metal is finding notable support near the 20-day simple moving average, while also encountering resistance around the 10-day exponential moving average. This suggests that gold may currently be entering a period of consolidation.
Another noteworthy development is that, as gold declined today, implied volatility for the metal also fell. This could signal that demand for call options is starting to fade, indicating a continued unwinding of the gamma squeeze that likely propelled gold sharply higher over the past couple of weeks.
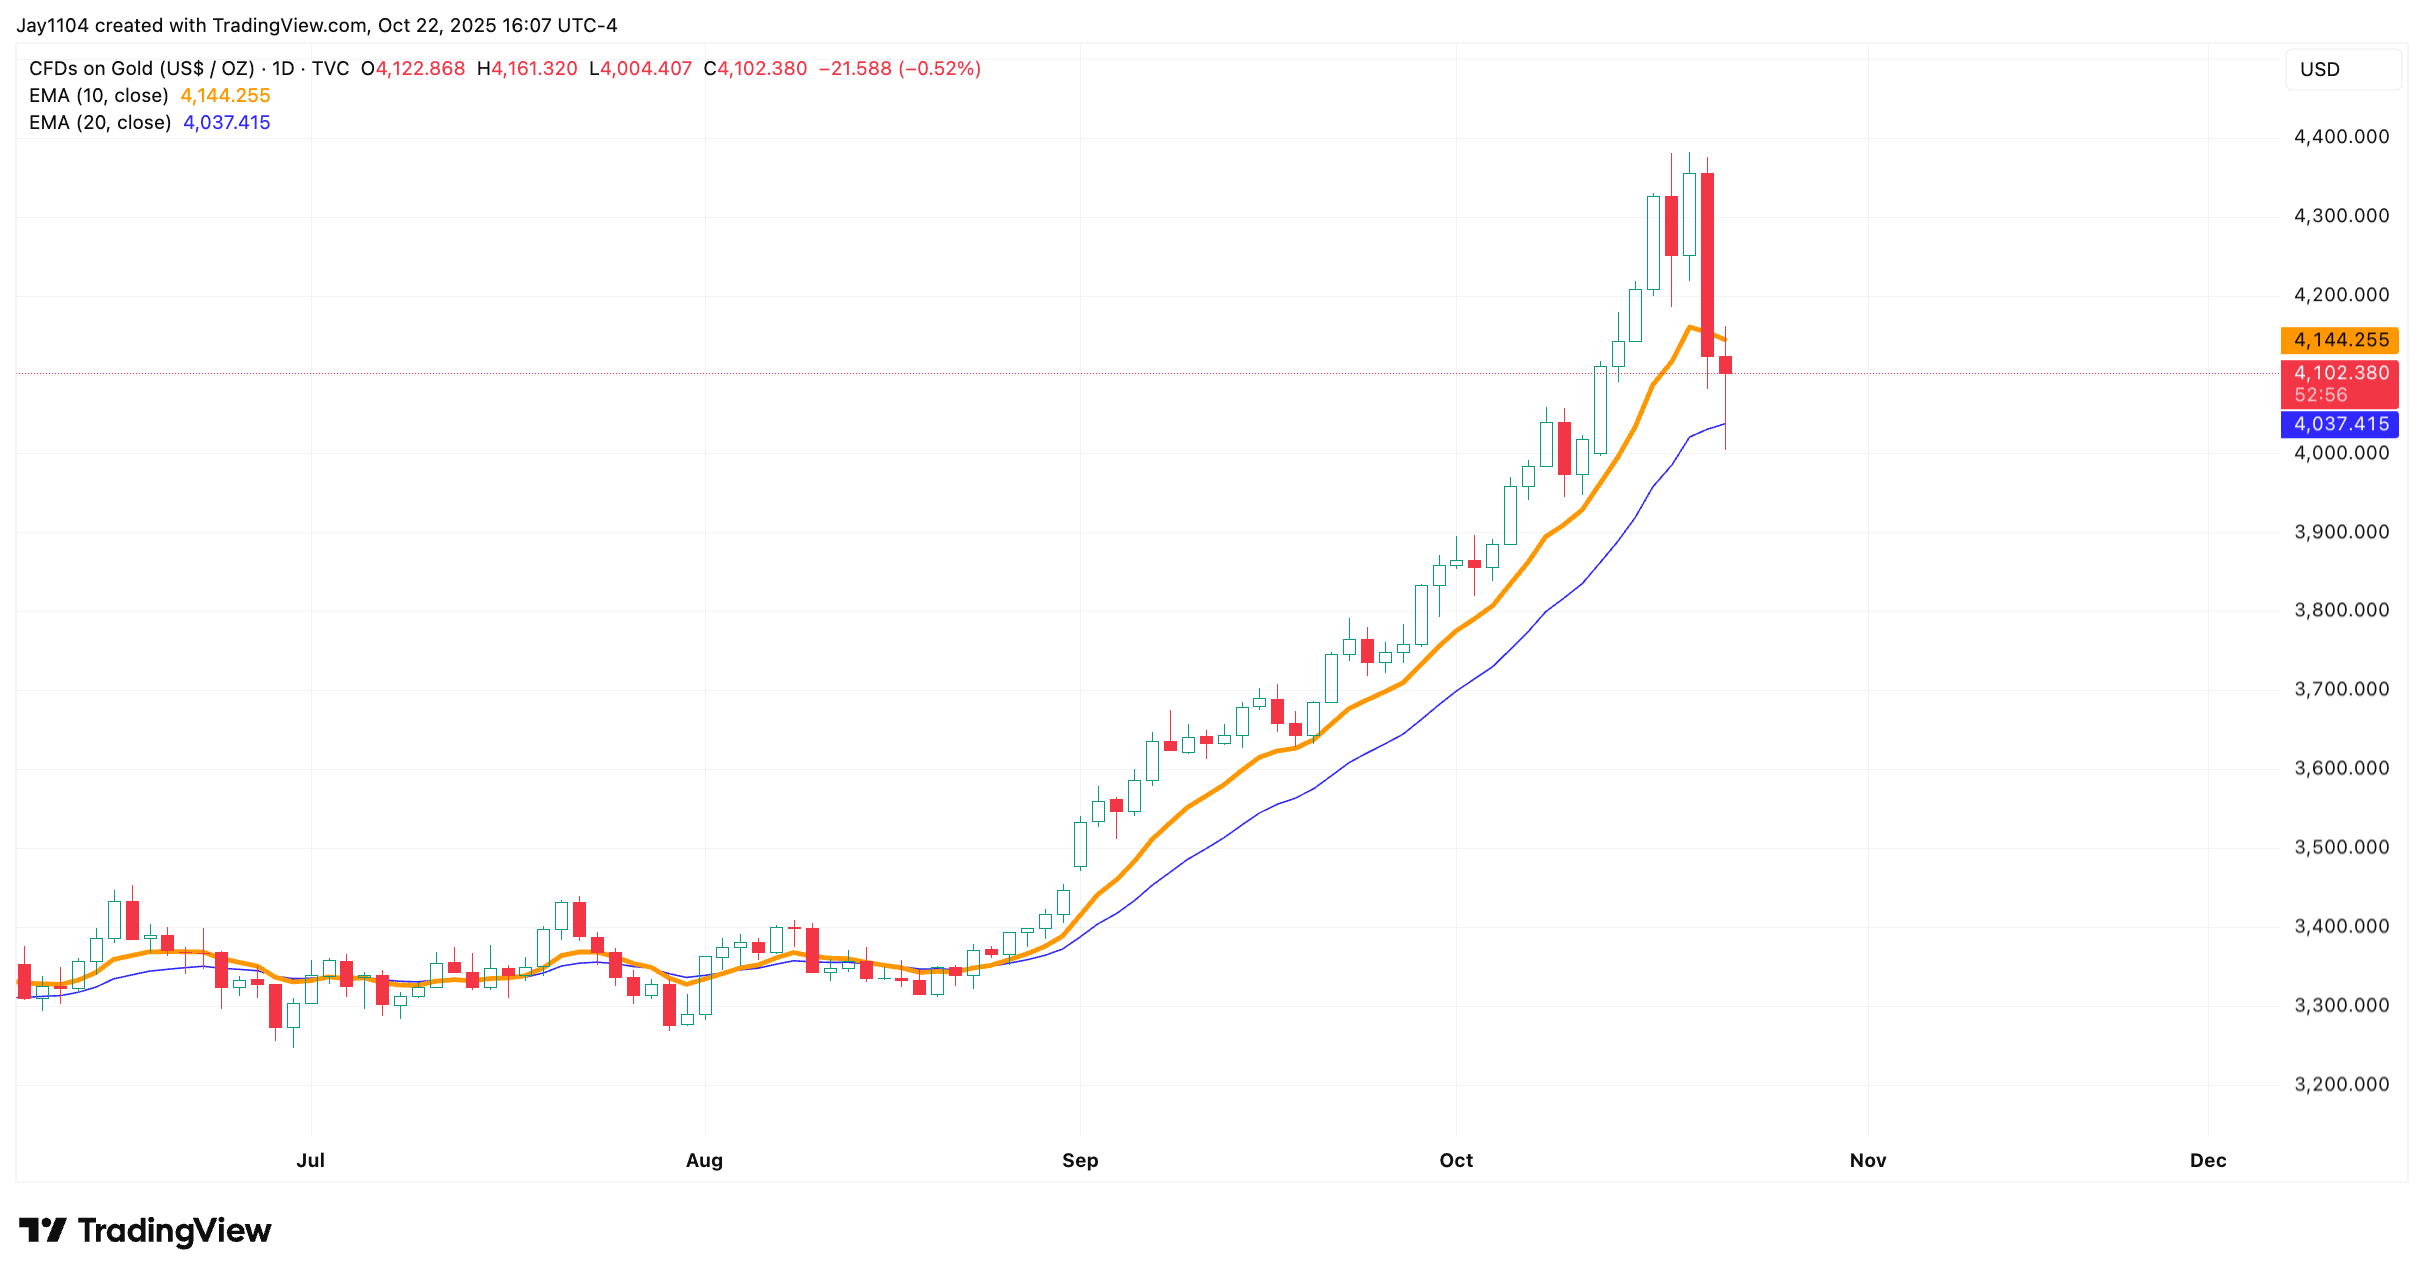
(Source: TradingView)
(Past performance is not a reliable indicator of future results)
Silver
Silver prices finished flat on Wednesday, following a 7% decline on Tuesday. Interestingly, the metal is now finding some technical support around the $48 level, while also encountering resistance at the 20-day simple moving average.
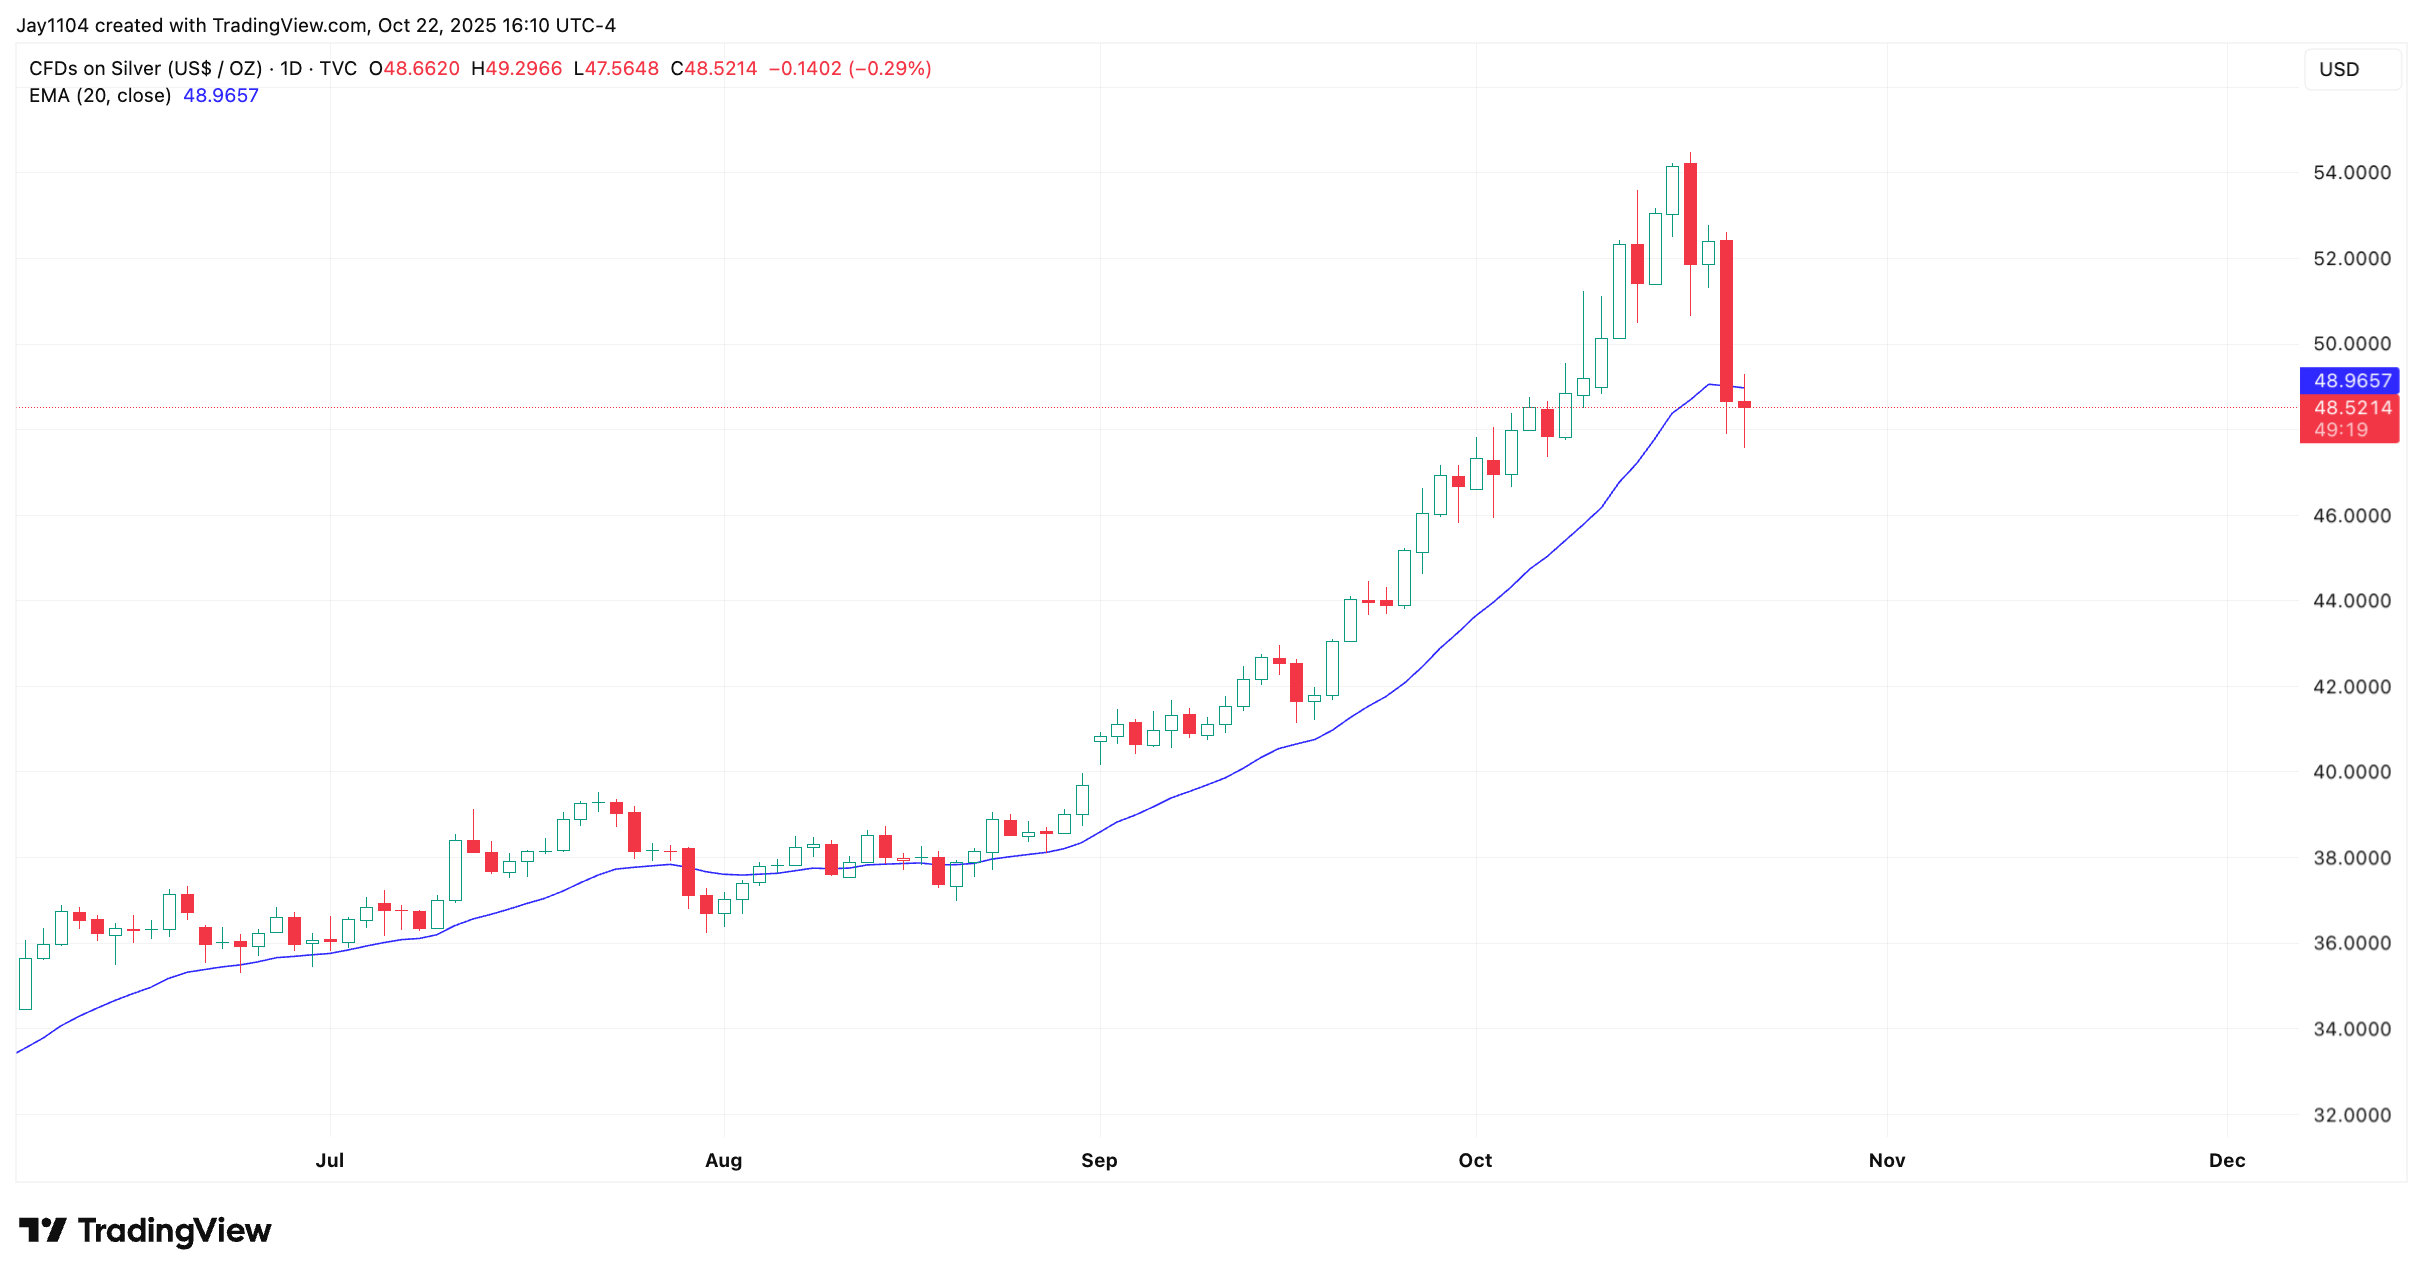 (Source: TradingView)
(Past performance is not a reliable indicator of future results)
What makes this particularly significant is that the $48 level also corresponds with the previous all-time highs in silver, reached in both April 2011 and January 1980. Losing that level could therefore deal a major blow to the metal and potentially lead to a further decline in prices.
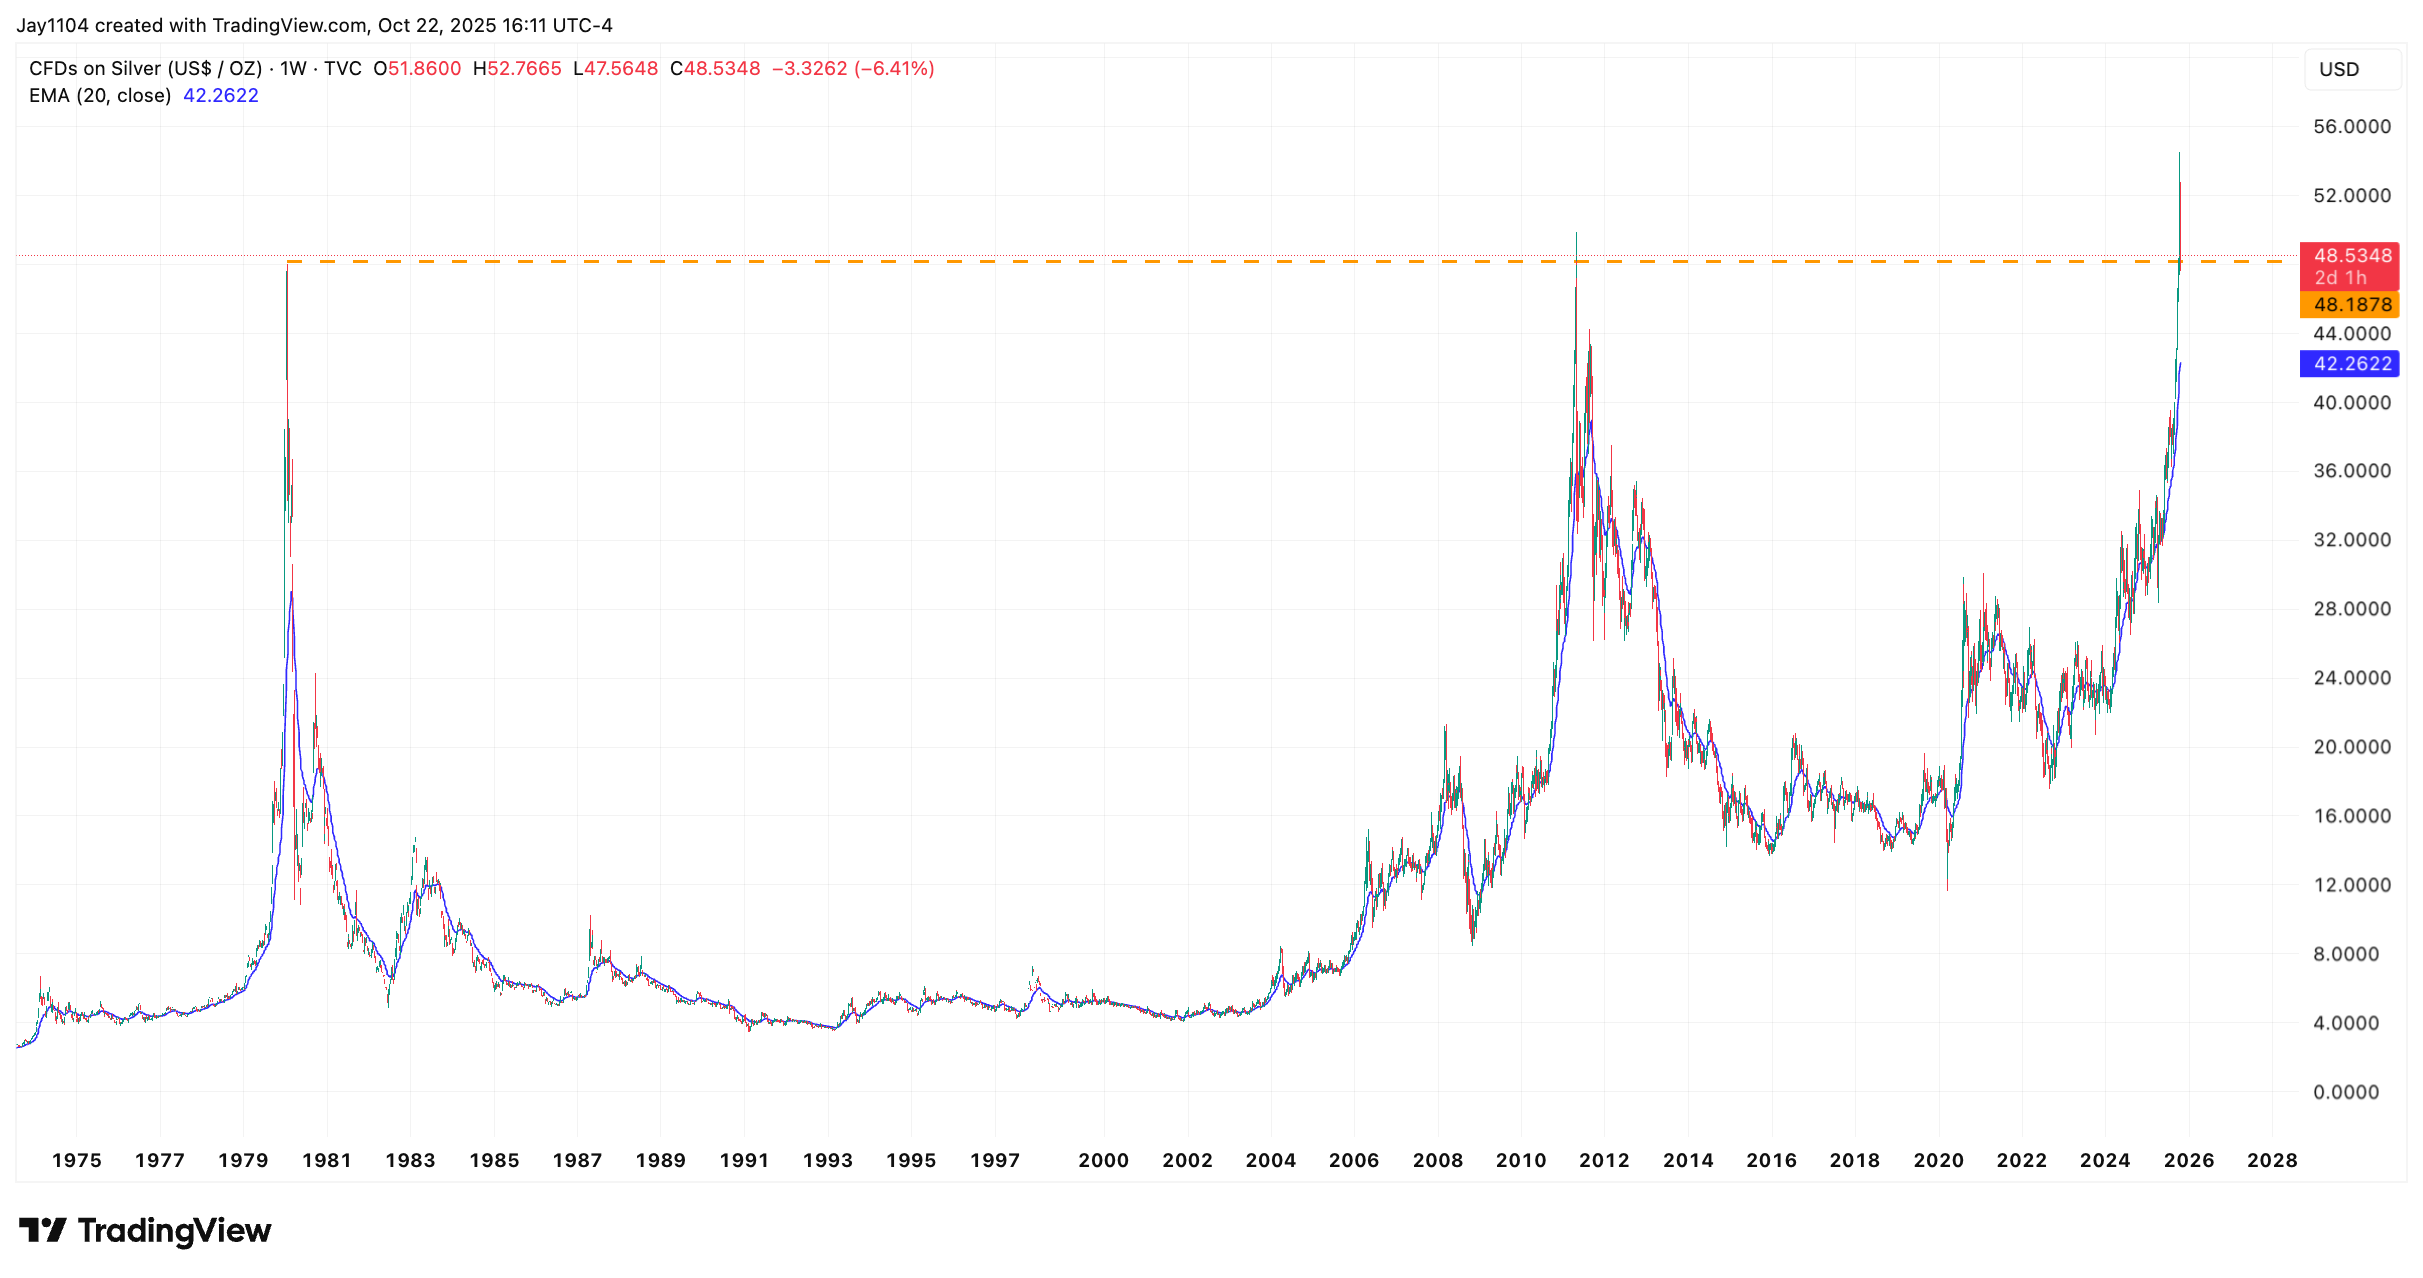
(Source: TradingView)
(Past performance is not a reliable indicator of future results)