IonQ stock forecast: Third-party price targets
IonQ (IONQ) was trading at $67.35 as of 3:13pm (UTC) on 26 September 2025, hovering near the intraday low of $66.13 after earlier reaching $73.52.
The stock declined amid profit-taking after the company reported achieving an algorithmic qubit score of AQ64 on its Tempo system three months ahead of schedule. This came as US 10-year Treasury yields approached 4.2%, weighing on technology sentiment (Reuters, 26 September 2025).
IonQ stock forecast: Analyst price target view
DA Davidson (neutral)
DA Davidson set a 12-month price target of $35 for IonQ on 7 August 2025, moving to a neutral stance after Q2 revenue exceeded expectations but operating expenses rose sharply (MarketBeat, 26 September 2025).
Cantor Fitzgerald (overweight)
Cantor Fitzgerald raised its 12-month target to $60 from $45, citing 81.6% year-on-year revenue growth and strategic acquisitions supporting IonQ’s commercial roadmap (AInvest, 15 September 2025).
Needham Securities (buy)
Needham Securities lifted its 12-month target to $80, citing feedback from IonQ’s Analyst Day and confidence in growing cloud subscription revenues (MLQ.ai, 16 September 2025).
Benchmark Securities (buy)
Benchmark Securities increased its 12-month target to $75 on 16 September 2025, citing the Oxford Ionics acquisition and ambitious qubit-scaling targets as momentum drivers (MarketBeat, 26 September 2025).
B. Riley Securities (buy)
B. Riley Securities raised its 12-month price target to $100, maintaining a buy rating as growing commercial demand and US Department of Energy partnerships underpin scalability (GuruFocus, 22 September 2025).
Forecasts and third-party predictions are often inaccurate, as they cannot account for unforeseen market developments. Past performance should not be relied on as an indicator of future results.
IONQ stock price: Technical overview
On the daily chart, IONQ is trading above its key moving average cluster – the 20-, 50-, 100- and 200-day moving averages (DMAs) at around $60, $47, $43 and $38 – with the 20-over-50 alignment intact. Momentum is positive: the 14-day RSI is at 72.8, indicating stretched conditions, while the ADX (14) at 43.7 signals an established trend.
The nearest resistance is the intraday high of $73.52; a daily close above that level would bring the $75 area into view. On pullbacks, initial support is at the 50-DMA near $47, followed by the pivot at $41.44. A break below this level would open the way to the next support zone (TradingView, 26 September 2025).
This technical analysis is for informational purposes only and does not constitute financial advice or a recommendation to trade.
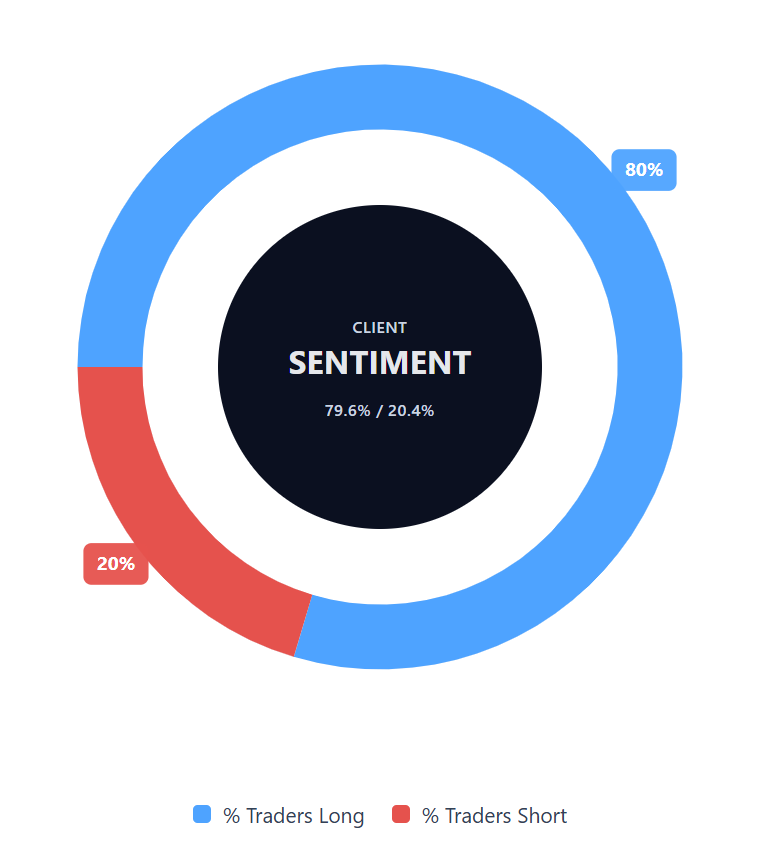
Capital.com’s client sentiment for IonQ CFDs
Buyers account for 79.6% compared with sellers at 20.4% on IonQ CFDs, a difference of 59.2 percentage points, indicating a strong long-side bias (26 September 2025). This snapshot reflects open positions on Capital.com and is subject to change.
FAQ
What is IonQ’s current share price?
As of 26 September 2025, IonQ was priced at $67.35, with an intraday high of $73.52 and a low of $66.13.
What are analysts’ 12-month price targets for IonQ?
Recent targets span $35–$100, with firms including DA Davidson, Cantor Fitzgerald, Needham, Benchmark and B. Riley Securities publishes estimates based on commercial progress, acquisitions, and qubit development plans.
What is Capital.com’s client sentiment on IonQ CFDs?
At the latest reading, buyers accounted for 79.6% compared with sellers at 20.4%, a gap of 59.2 percentage points in favour of long positions.
Are forecasts reliable for trading decisions?
Forecasts and third-party projections are often inaccurate, as they cannot factor in unforeseen events. Past performance should not be relied on as an indicator of future outcomes.