Implied Volatility May Surge Ahead of the Fed Meeting
The highlight of the week of 8 December will be Wednesday, 10 December, at 2 p.m. Eastern Time, when the Fed releases its highly anticipated decision on interest rates.
Expectations point to more than an 80% probability that the Fed will cut rates by 25 basis points at this week’s meeting, lowering the target range to 3.50% to 3.75%.
While the market appears confident about the rate decision itself, this meeting will also include the release of the Summary of Economic Projections, which is likely to offer guidance on where rates may head over the coming year. It will also provide updated views on inflation, the unemployment rate, and economic growth, giving investors a clearer sense of how the Fed sees the economic backdrop, even as data remain incomplete due to the lingering effects of the government shutdown. In essence, the market will be looking to the Fed for direction and hoping for a more unambiguous indication of its policy outlook.
Because there appears to be a meaningful divide among Fed participants, as noted in the recent release of the minutes, there is good reason to pay close attention to any caveats that emerge from the meeting, whether through dissents or through Chair Powell’s remarks about the committee’s sentiment during the press conference. This will be important for markets, as a significant number of participants resisting further rate cuts could unsettle investors who have been expecting more easing at least through the remainder of Powell’s term. If that expectation is not met, the market may wait for a newly appointed Fed Chair before anticipating additional policy support in May.
Elevated Implied Volatility
Because of this uncertainty and the unpredictability surrounding some of the meeting’s nuances, S&P 500 implied volatility levels will likely be elevated heading into the event. The best gauge for this day-to-day volatility is the VIX 1-Day, which finished the week around 9.9. That is a very low reading, and we have been focused on the decline in implied volatility since before Thanksgiving. At this point, it appears that very short-dated implied volatility has, for the most part, reached a bottom. As we move through the week, implied volatility as measured by the VIX 1-Day could begin to creep higher into the meeting, ultimately peaking around 2 p.m. Eastern on 10 December when the news is released, before potentially collapsing once the press conference begins at around 2:45 to 3 p.m. Eastern.
As implied volatility comes down following the Fed meeting, it is likely to give the equity market a boost. Lower implied volatility reduces option premiums, which may prompt market makers to unwind some of the hedge positioning they had put on ahead of the meeting.
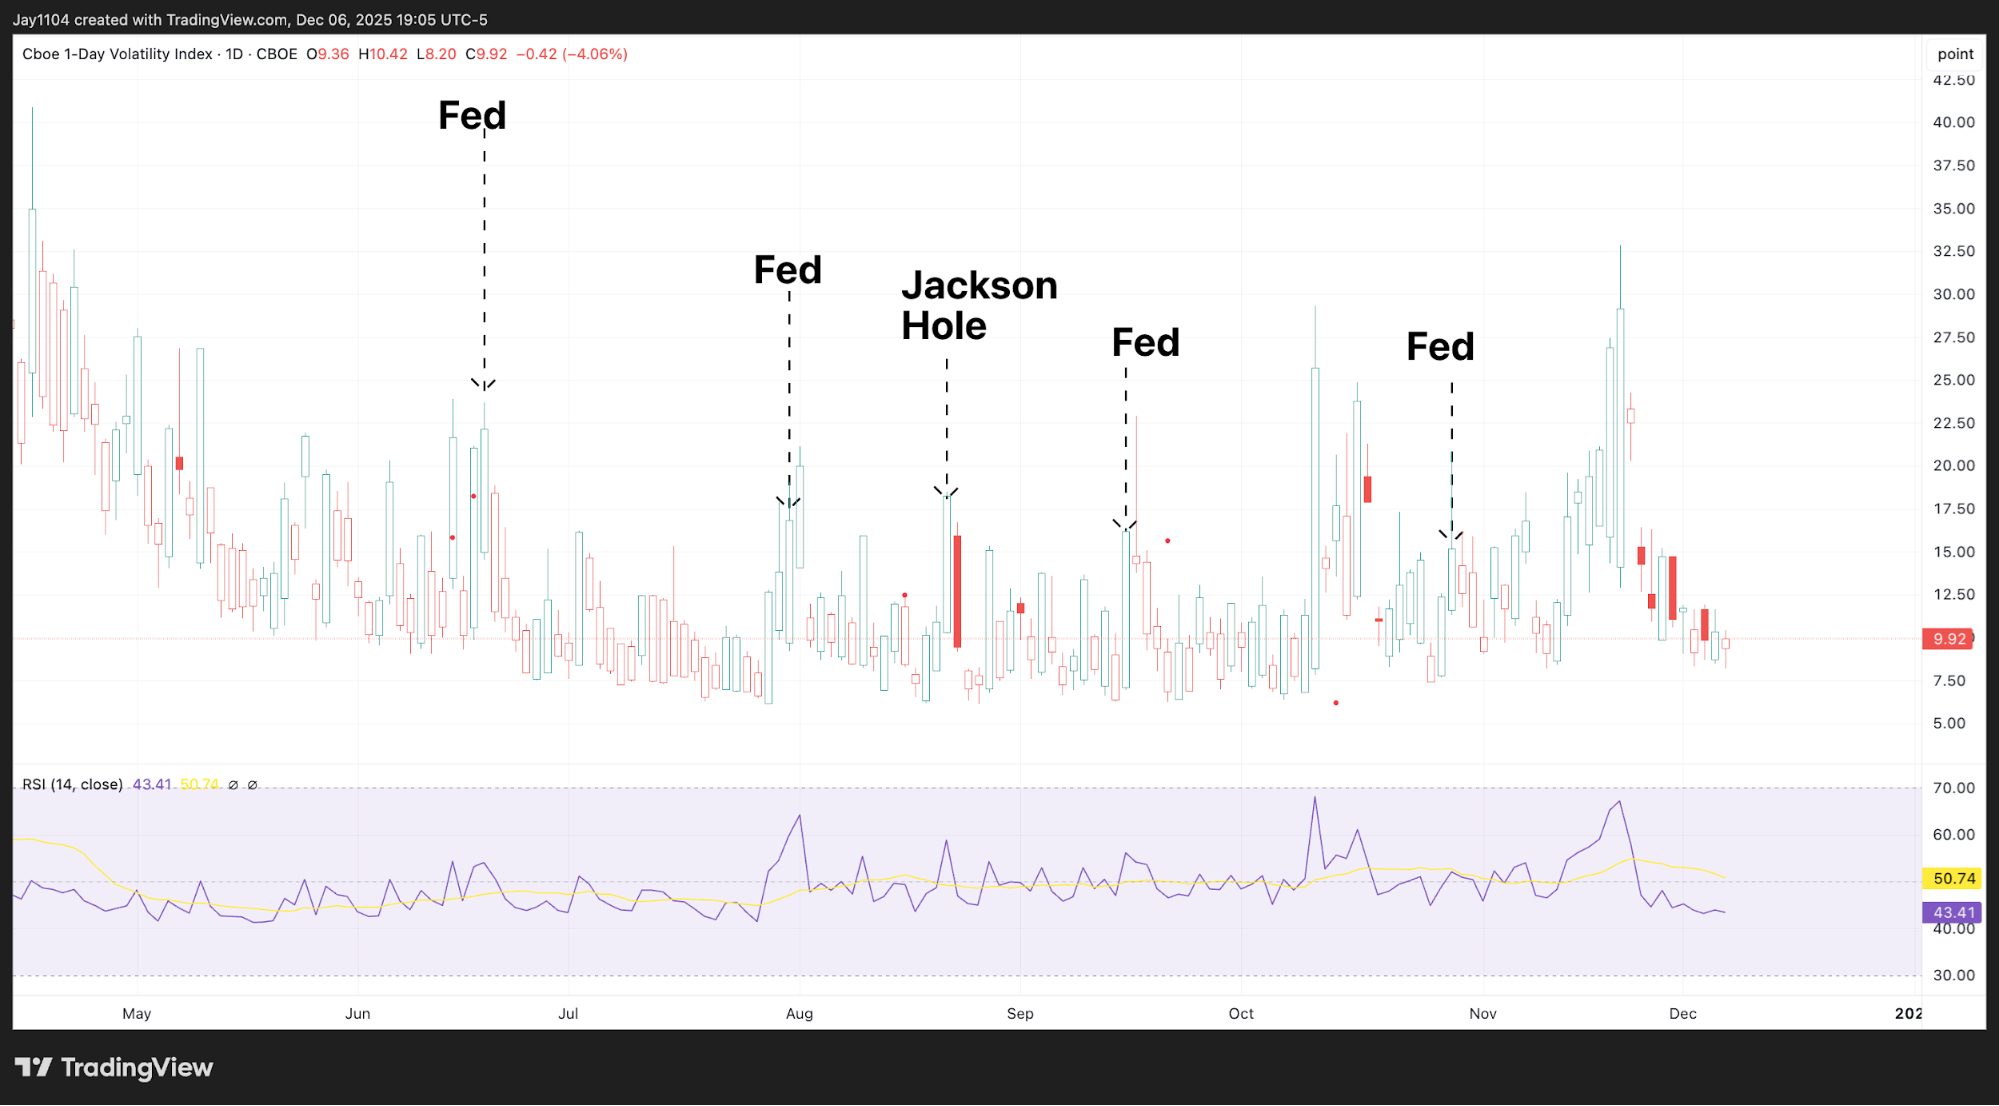
(Source: TradingView)
Past performance is not a reliable indicator of future results
This is why the tight trading range in the equity market—and in the S&P 500 in particular—over the past week and a half has been so important. Heading into the Fed announcement, implied volatility is likely to rise first and then fall afterwards. Consequently, there is a risk that pressure builds on the stock market in the lead-up to the meeting, with a break below 6,800 potentially marking a key support breach that could open the door to a steeper decline. This would be especially true if there is any repositioning around the market’s expectations for whether the Fed will cut rates before the meeting on Wednesday.
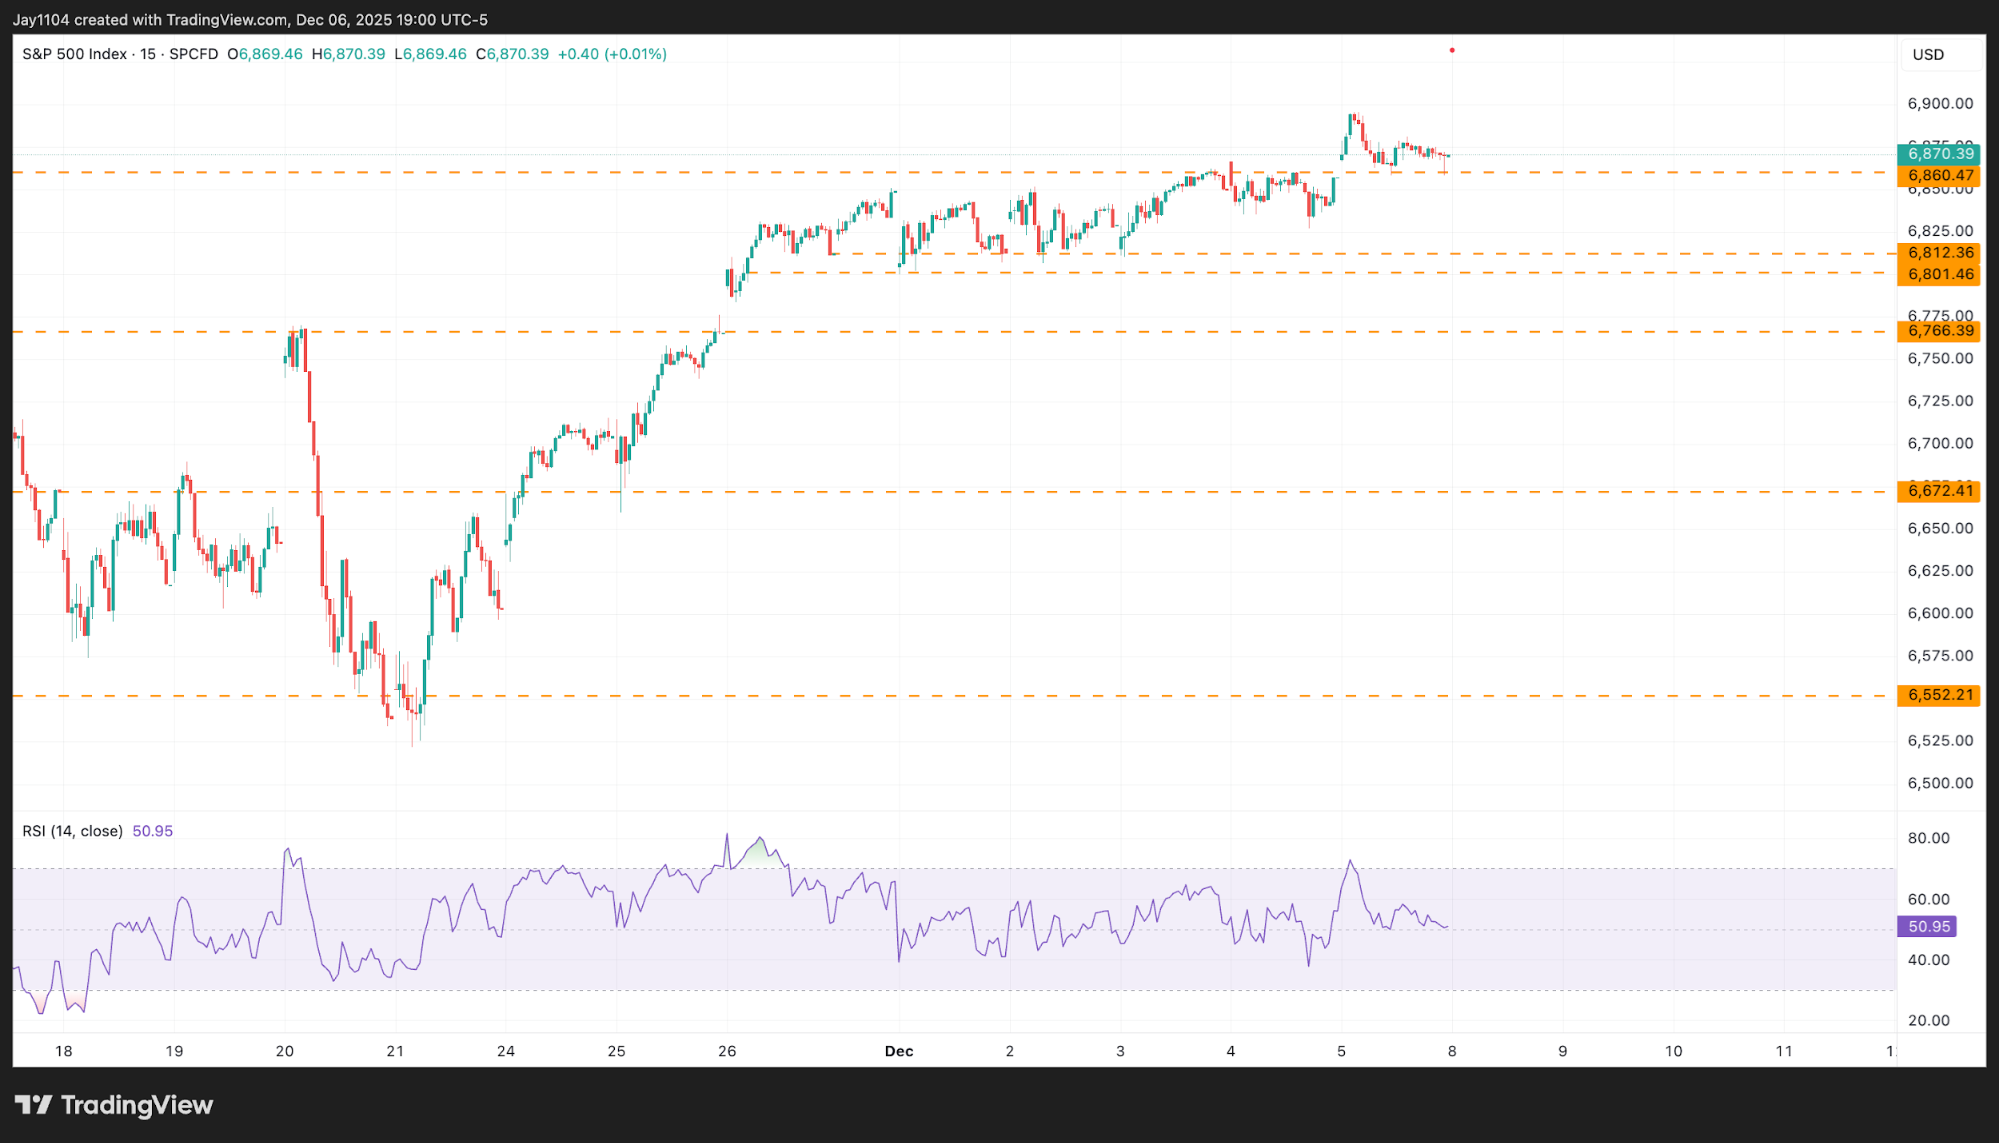 (Source: TradingView)
Past performance is not a reliable indicator of future results
10-Yr Breakout Momentum Builds
Interest rates have also begun to rise, which is rather notable. The exact reason for the rise is hard to pin down, but the increase in Japanese yields has undoubtedly been a contributing factor. Another possibility is that the market is starting to consider the prospect of a new Fed Chair arriving in May who could be perceived as too aggressive in cutting rates, raising concerns about future inflation.2 It may also be the case that the yield curve is too flat at present and will need to steepen as the Fed approaches its neutral policy rate. For now, if the 10-year Treasury yield breaks above the 4.15% area, it could trade back up towards the 4.30-4.35% region in the not-too-distant future.3
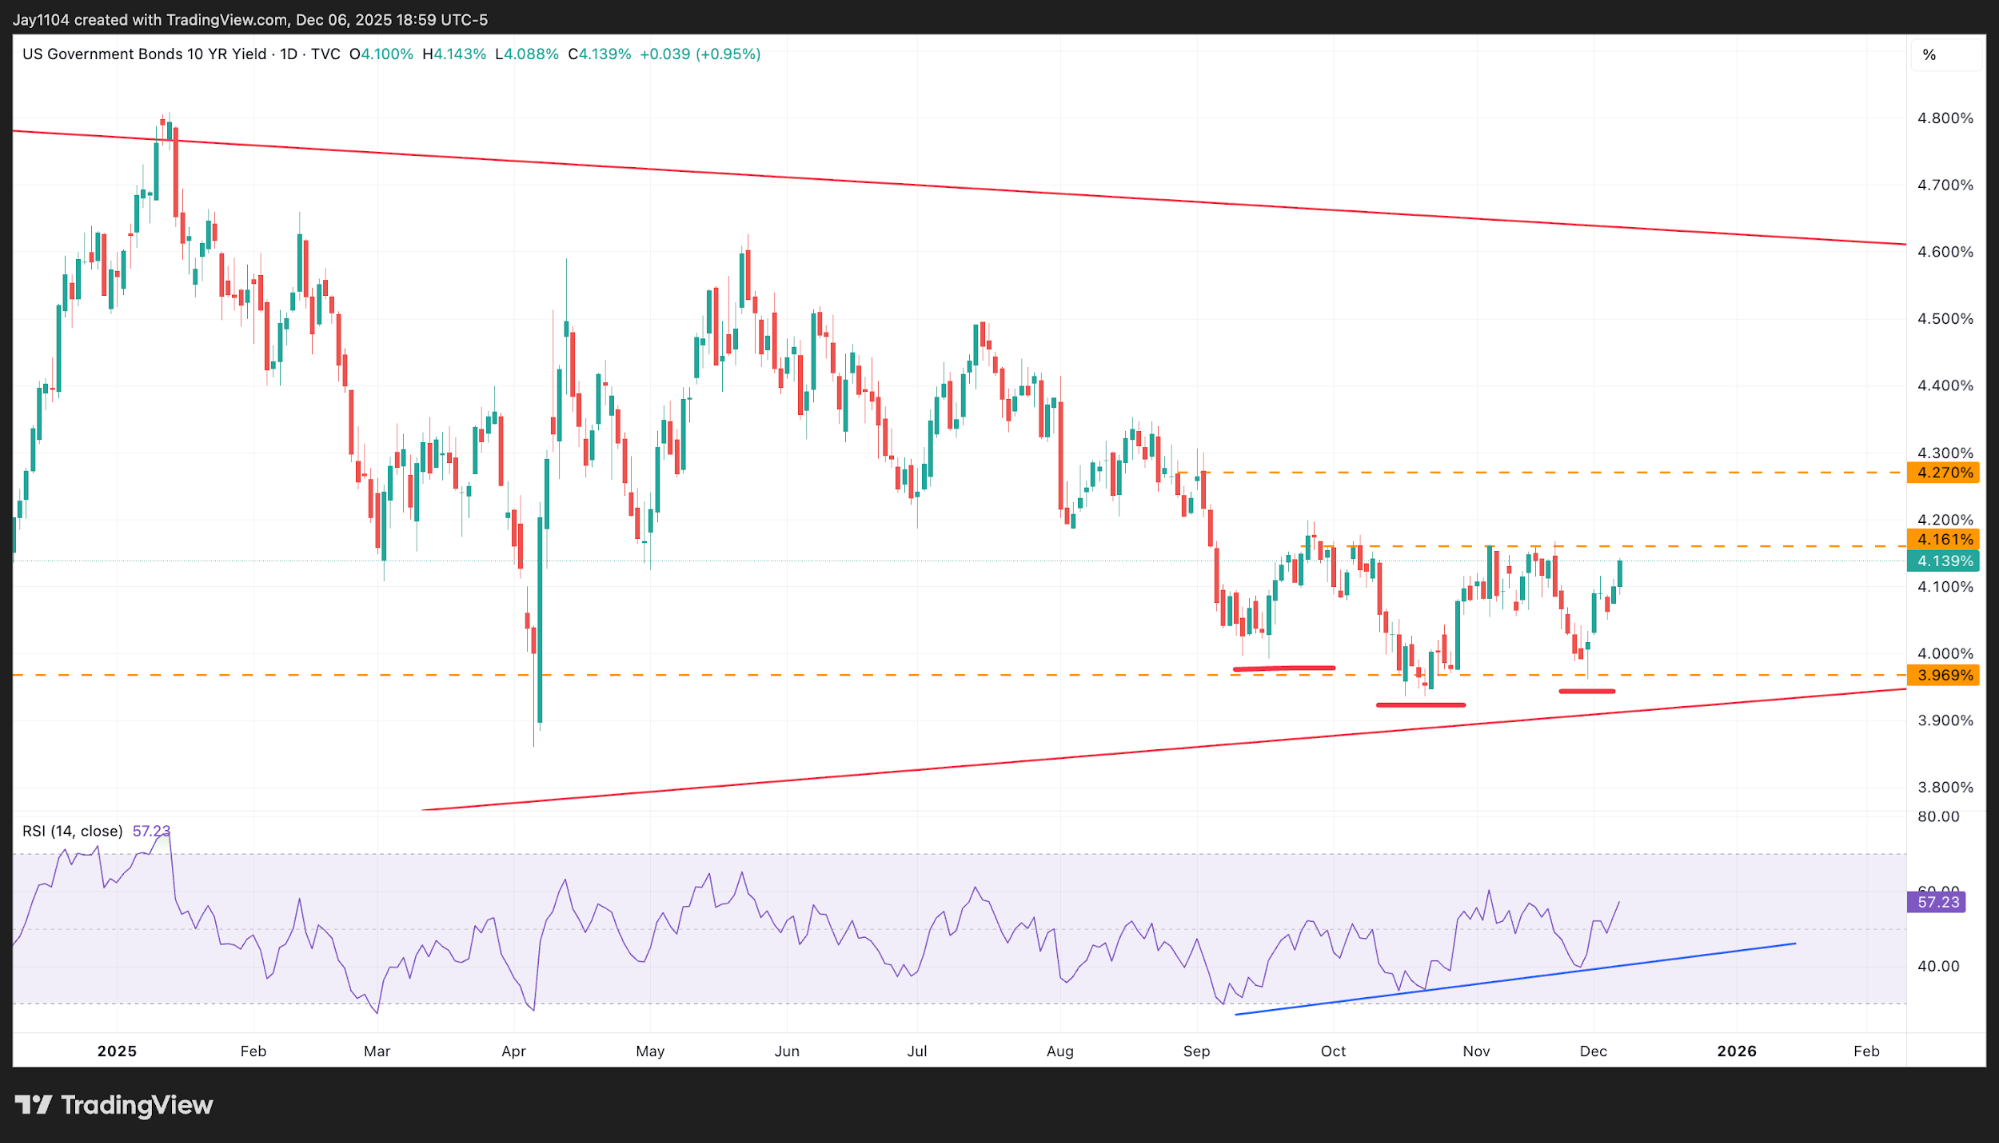 (Source: TradingView)
Past performance is not a reliable indicator of future results
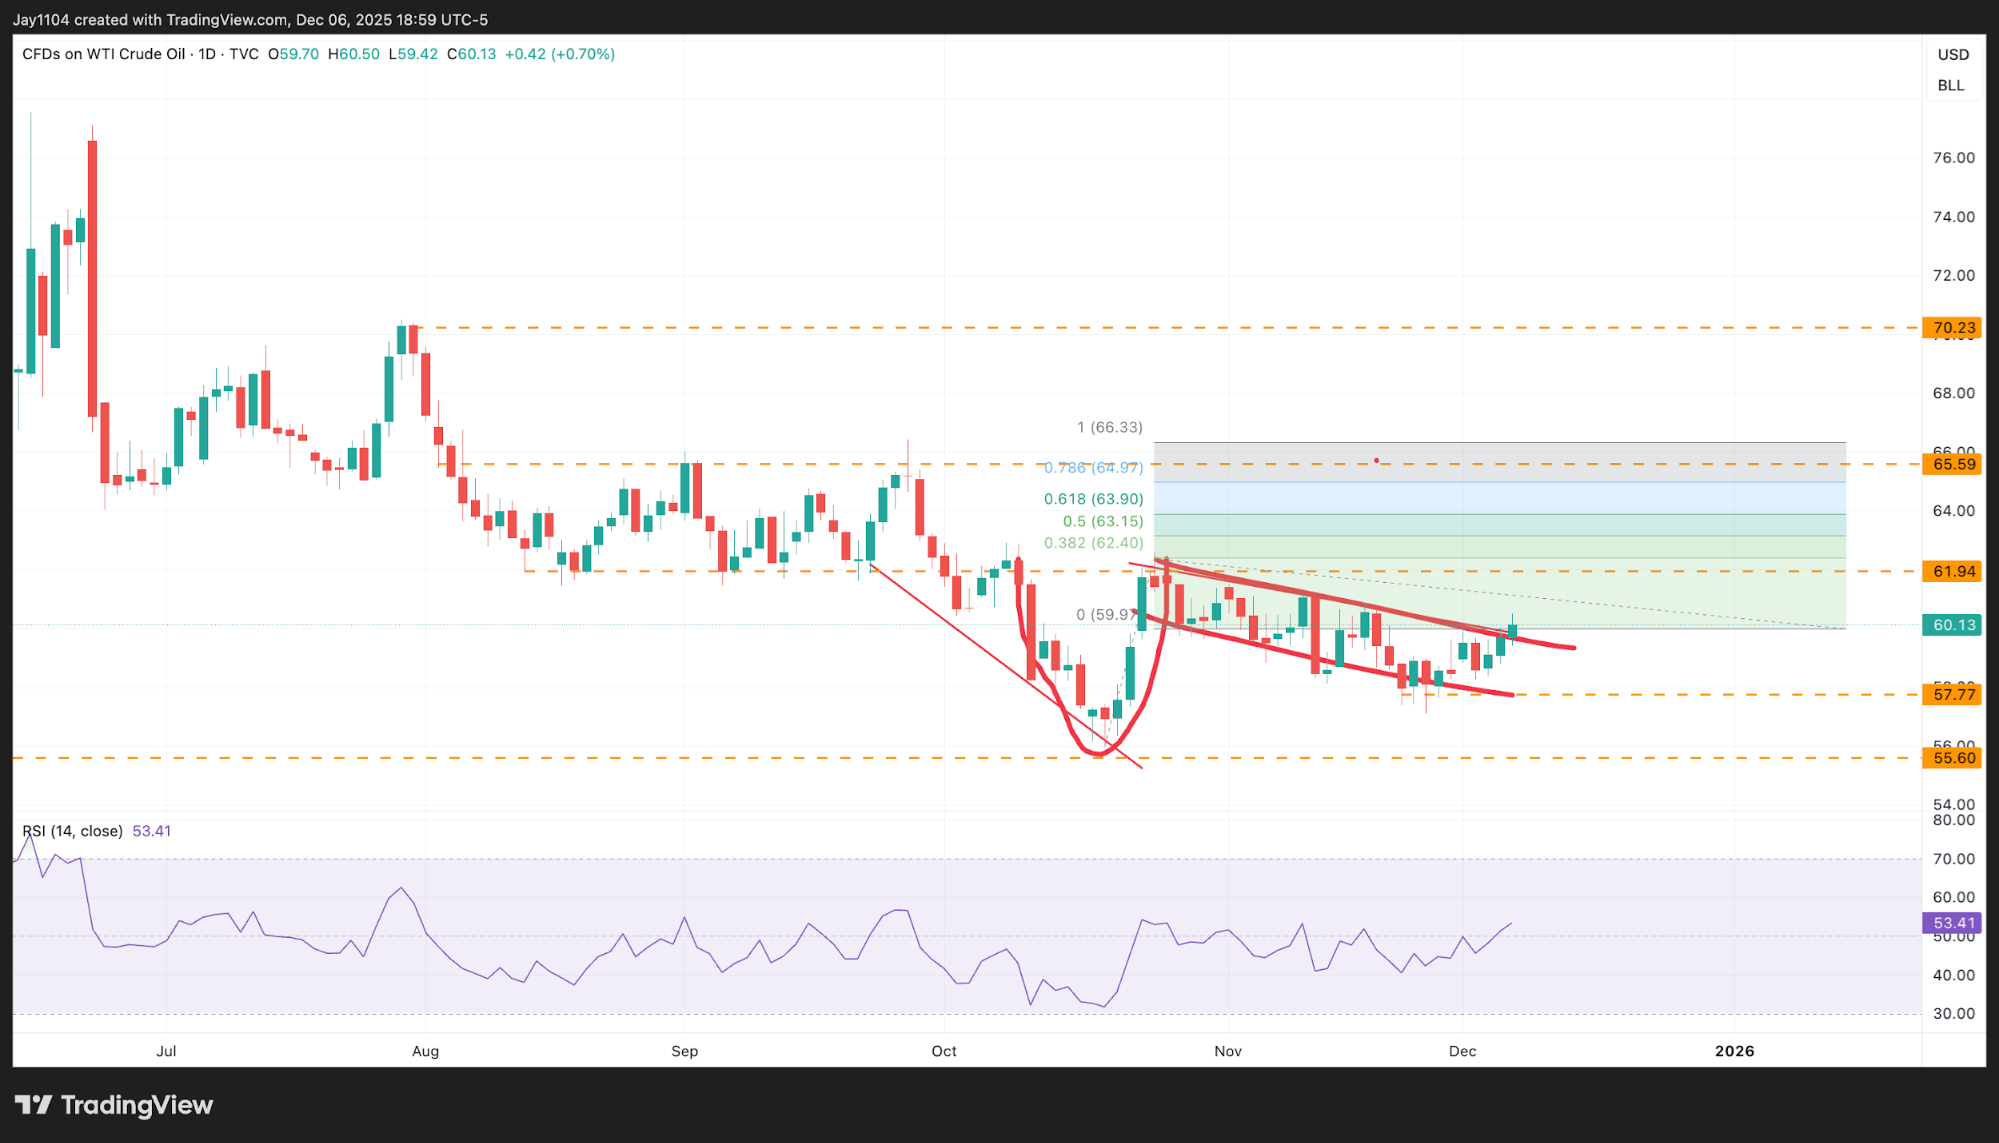
Oil Breaks Above Downtrend
Oil may also be playing a key role in the 10-year rate rise, given the strong correlation between oil prices and long-end Treasury yields. Oil may finally have broken out of the downtrend noted a couple of weeks ago, moving above $60 and, more importantly, breaking its descending channel. In fact, oil may have formed a bullish continuation pattern known as a cup-and-handle. A breakout could suggest a move towards the $65.50 level. If oil manages to clear this resistance, the price could edge closer to $70 – a shift that may add upward pressure to long-end rates.
 (Source: TradingView)
Past performance is not a reliable indicator of future results