EU50 forecast: Third-party price targets
EU Stocks 50 (EU50) was trading around 5,721.0 as of 1:59pm (UTC) on 4 December 2025, within an intraday range of 5,687.4–5,729.9 on Capital.com’s platform. Prices remain close to recent Euro area benchmark levels, with related EU50 measures reported near 5,714.0 in early December.
As of 4 December 2025, recent EU50 sessions have taken place alongside steadier European equity benchmarks, where Euro area indices have edged higher in line with broader STOXX 50 and STOXX 600 moves (Trading Economics, 4 December 2025). The backdrop includes a run of firmer macro signals, such as recent business-activity readings showing the fastest expansion in roughly 30 months (Reuters, 3 December 2025) and a slight pickup in euro area inflation to about 2.2% year on year (CNBC, 2 December 2025). These data points form part of the environment in which EU50 price action has unfolded.
Past performance is not a reliable indicator of future results.
Euro Stoxx 50 forecast 2026–2030: Analyst price target view
Third-party Euro Stoxx 50 forecasts point to moderate upside potential over the next one to two years, framed by expectations for relative valuation support and a benign macro backdrop for European equities. Forecasts referenced below generally use index-point targets or percentage gains for broad benchmarks such as the Euro Stoxx 50 or STOXX 600, which are commonly used proxies for the underlying equity exposure in EU50.
AXA IM (European equity outlook)
AXA Investment Managers notes in an October 2025 market update that European equities, represented by the Euro Stoxx 600, have delivered about a 25% year-to-date return in 2025 in US dollar terms, outpacing major global indices and highlighting what it sees as ongoing value in the region as of 6 October 2025. The house links this performance to supportive monetary policy, relatively attractive valuations and diversified sector exposure, as European indices trade at a discount to US benchmarks amid solid earnings trends (AXA, 7 October 2025).
Rothschild & Co Asset Management (strategy view)
Rothschild & Co Asset Management reports in its Q3 2025 European equities strategy that while earnings-per-share growth in Europe is expected to be close to zero for 2025, analysts anticipate EPS growth of around 12.4% for 2026, which the firm cites as a key pillar for a constructive medium-term stance on regional equity benchmarks including large-cap indices. The outlook ties prospective earnings recovery to improving economic growth, fiscal support and positioning that remains lighter than in US markets (Rothschild & Co, 20 October 2025).
J.P. Morgan (European stocks outlook)
J.P. Morgan Global Research indicates in a September 2025 European stocks outlook that consensus points to stronger earnings growth for European companies in 2026 than in 2025, and projects that European stocks could deliver comparatively better performance in 2026, using indices such as the STOXX 600 and Euro Stoxx 50 as key references. The bank attributes this view to relatively low valuations versus US peers, expectations for stabilising monetary policy from the European Central Bank and a gradual improvement in the regional growth backdrop (JP Morgan, 7 November 2025).
Reuters (equity strategist poll)
Reuters reports in a late-November 2025 equity strategist poll that the pan-European STOXX 600 is forecast to reach about 623 points by the end of 2026, implying roughly an 11% gain from prevailing levels, while the Euro Stoxx 50 is projected to rise around 6.7% to about 5,900 over the next year and toward roughly 5,955 by mid-2027. The survey cites comparatively cheap valuations, expectations for continued fiscal support in key economies and a view that European indices could prove more resilient than US benchmarks if technology-led gains moderate (Reuters, 26 November 2025).
AInvest / Goldman Sachs / Reuters (combined projections reference)
AInvest summarises in a November 2025 article that Goldman Sachs Research sees the STOXX 600 rising about 5% to roughly 580 by 2026, while Reuters’ polling referenced in the same piece points to an approximate 11% projected gain for the index, highlighting a broadly supportive stance on European equity benchmarks encompassing the Euro Stoxx 50 universe. The article notes that this optimism rests on structural diversification benefits, an ongoing valuation discount to US stocks and macroeconomic tailwinds from fiscal stimulus and green investment spending (AInvest, 26 November 2025).
Predictions and third-party forecasts are inherently uncertain, as they cannot fully account for unexpected market developments. Past performance is not a reliable indicator of future results.
Euro Stoxx 50: Technical overview
EU50 traded near 5,721 as of 1:59pm (UTC) on 4 December 2025, holding above a rising cluster of daily moving averages and tracking close to the short-term Hull Moving Average around 5,717. The 20/50/100/200-day simple moving averages sit near 5,642 / 5,635 / 5,505 / 5,400 respectively, with the 20-over-50 alignment intact while price remains above this broader MA band.
Momentum indicators show the 14-day RSI around 59.7 in the upper-neutral zone, while the ADX near 11.3 reflects a weak trend backdrop, indicating that momentum is positive but not strongly directional.
Key reference levels include the classic pivot R1 around 5,832, with R2 near 5,998 becoming relevant only after a sustained daily close above R1. On the downside, initial support sits near the pivot at 5,653, followed by the 100-day SMA around 5,505. A decisive break below this area could expose the S1 region near 5,489 as a deeper reference point (TradingView, 4 December 2025).
This technical analysis is for information only and is not financial advice or a recommendation to buy or sell any instrument.
EU50 history
EU50 has moved higher over the past two years, rising from around 4,470 at the start of January 2024 to above 5,700 by early December 2025. During this period, the index experienced swings including a dip toward 4,560 in early August 2024, a recovery into the 5,000s, and a sharper pullback into the 4,500–4,900 range in April 2025 before climbing steadily through the summer.
Since June 2025, the index has continued to push higher, with closes rising from about 5,355 on 1 June to approximately 5,722 on 4 December, leaving the index up roughly a quarter from early January 2024 levels and about 8–9% above late-2024 readings.
Past performance is not a reliable indicator of future results. Share prices are indicative and may differ from live market prices.
Capital.com analyst view
EU50 has delivered a strong two-year performance, rising from the mid-4,000s in late 2023 to above 5,700 by early December 2025 on Capital.com’s platform. Movements have unfolded in stages, with periods of consolidation and setbacks – such as the April 2025 pullback – followed by recoveries into new highs. These moves reflect shifting expectations around Eurozone growth, earnings and central-bank policy.
While the advance highlights resilience in Eurozone blue-chip equities, it also means valuations start from a comparatively higher base, potentially limiting scope for further gains if macro or earnings data weaken.
From mid-2025 onwards, EU50 has generally trended higher, with daily closes rising from around 5,300 in early June to above 5,700 by early December. Supportive inputs – such as steadier business-activity data or contained inflation – may help underpin prices, whereas weaker growth, renewed policy uncertainty or broad risk-off sentiment could drive reversals and add to volatility.
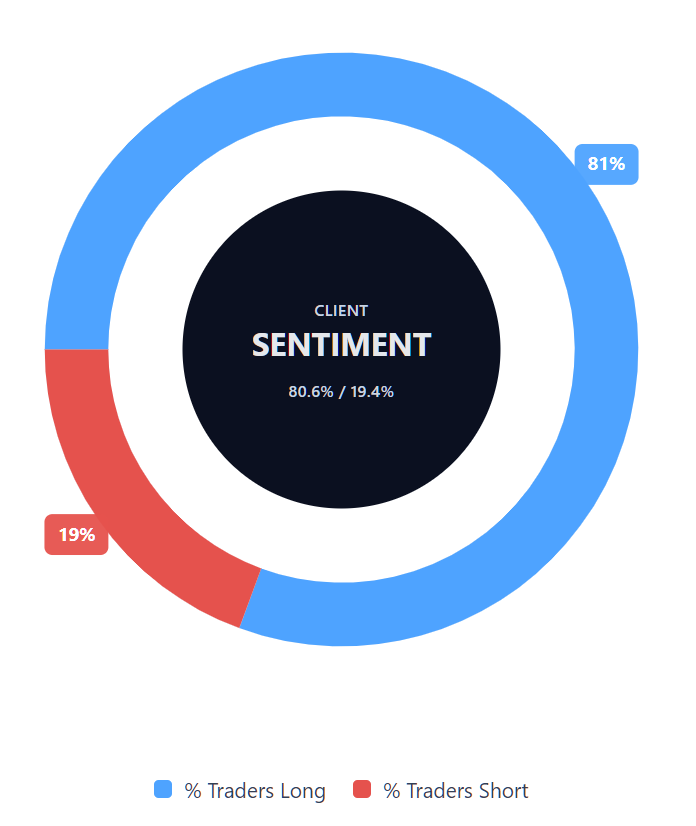
Capital.com’s client sentiment for EU50 CFDs
As of 4 December 2025, EU50 CFD client positioning on Capital.com currently shows 80.6% buyers and 19.4% sellers, indicating a one-sided skew towards long positions. This snapshot reflects open positions on the platform at the time of reporting and can shift as traders adjust their exposure. Positioning data is not a reliable indicator of future price movements.
Summary – EU50 2025
- EU50 has moved higher through 2025, rising from the low-5,000s in January to above 5,700 by early December.
- The year included a sharp April pullback into the mid-4,000s before a steady recovery into new cycle highs in the second half of 2025.
- Technical conditions remain broadly constructive, with price above key daily moving averages and momentum indicators in upper-neutral territory.
- Eurozone growth data, inflation trends and central-bank policy shifts have contributed to swings in EU50.
- Client sentiment on Capital.com shows a heavy long skew, though such data should not be used as a forecast.
Past performance is not a reliable indicator of future results.
FAQ
What is the Euro Stoxx 50 forecast?
Analyst and model-based projections for Eurozone blue-chip equities in late 2025 generally point to modest single- to low-double-digit upside scenarios into 2026. These views relate to broader Euro Stoxx benchmarks rather than specific EU50 CFD prices. Forecasts typically draw on assumptions around earnings, valuations, fiscal policy and potential macro or tariff-related risks, and they can change quickly as new information becomes available. These projections are not predictions or recommendations. Past performance is not a reliable indicator of future results.
Why has EU50 been dropping or rising?
EU50 price movements reflect changes in market sentiment, macroeconomic data, sector trends and shifting expectations around Eurozone growth, corporate earnings and central-bank policy. Recent swings have aligned with developments in business-activity indicators, inflation data and broader European equity benchmarks. Pullbacks may occur when growth expectations weaken or when risk appetite falls, while recoveries can coincide with steadier macro readings or adjustments in broader market conditions. Influences evolve over time, so no single factor accounts for every move.
Could EU50 go up or down?
EU50 can move in either direction as markets respond to new data, changing expectations and shifts in risk appetite. Stronger macro signals, stable policy conditions or sector-specific improvements may support prices, whereas weaker growth, policy uncertainty or broad market volatility may place downward pressure on the index. Because market conditions change continuously, future movements are uncertain and cannot be predicted. Past performance and positioning data should not be relied upon as indicators of future results.
How can I trade EU50 CFDs on Capital.com?
You can trade EU50 CFDs on Capital.com’s platform or app. CFD trading lets you speculate on price movements without owning the underlying index, with the option to go long or short. However, contracts for difference (CFDs) are traded on margin – leverage amplifies both profits and losses.