Costco stock forecast: Third-party price targets
Costco (COST) was trading at $946.95 at 2:56pm UTC on 22 September 2025, after moving within an intraday range of $935.25-$942.44.
Shares remain supported by a resilient US consumer backdrop, following stronger-than-expected August retail sales. Broader equity markets are trading close to record levels, though volume is subdued in late European sessions (Reuters, 16 September 2025).
Costco stock predictions: Analyst price target view
Investopedia (average view)
The average 12-month price target for Costco is $1,058.40, representing the consensus of multi-analyst estimates for fiscal year-end 2025. Analysts expect steady membership revenue growth following the September fee increase, supported by resilient margins (Investopedia, 28 May 2025).
Goldman Sachs (post-earnings note)
Goldman Sachs raised its price target on Costco to $1,133 from $1,118 after Q3 FY2025 results. Same-store sales exceeded forecasts, helped by strong performance in fresh-food categories and targeted pricing strategies (The Fly, 30 May 2025).
UBS (strategic update)
UBS reaffirmed its Buy rating and $1,205 price target for Costco. It highlighted the retailer’s extended shopping-hours pilot and membership economics as key growth drivers in a high-valuation environment (Yahoo Finance, 4 July 2025).
Morgan Stanley (maintained outlook)
Morgan Stanley maintained its Overweight rating on Costco with a $1,225 price target. It noted ongoing momentum in e-commerce and membership fee income as support for long-term fundamentals (Futunn, 18 September 2025).
Benzinga (consensus snapshot)
Benzinga reported a consensus price target of $1,047.26 for Costco based on 28 analysts, with forecasts ranging from $890 to $1,225. This reflects differing views on valuation multiples versus growth prospects (Benzinga, 22 September 2025).
CFDs are complex instruments and come with a high risk of losing money rapidly due to leverage.
COST stock price: Technical overview
On the daily chart, Costco (COST) remains below its key moving-average cluster – 20-, 50-, 100- and 200-day moving averages (DMAs) at approximately 955, 958, 976 and 981 – with shorter-term averages positioned beneath longer-term ones. Momentum is subdued: the 14-day RSI is around 43.7, indicating a neutral stance, while the ADX at 10.9 signals a weak trend.
On the upside, a daily close above the 955–958 band would bring the 1,090 pivot into focus. On declines, initial support is near S1 at 917.94; a break below this level could extend the move towards the 976–981 DMA shelf (TradingView, 22 September 2025).
This is technical analysis for informational purposes only and does not constitute financial advice or a recommendation to buy or sell any instrument.
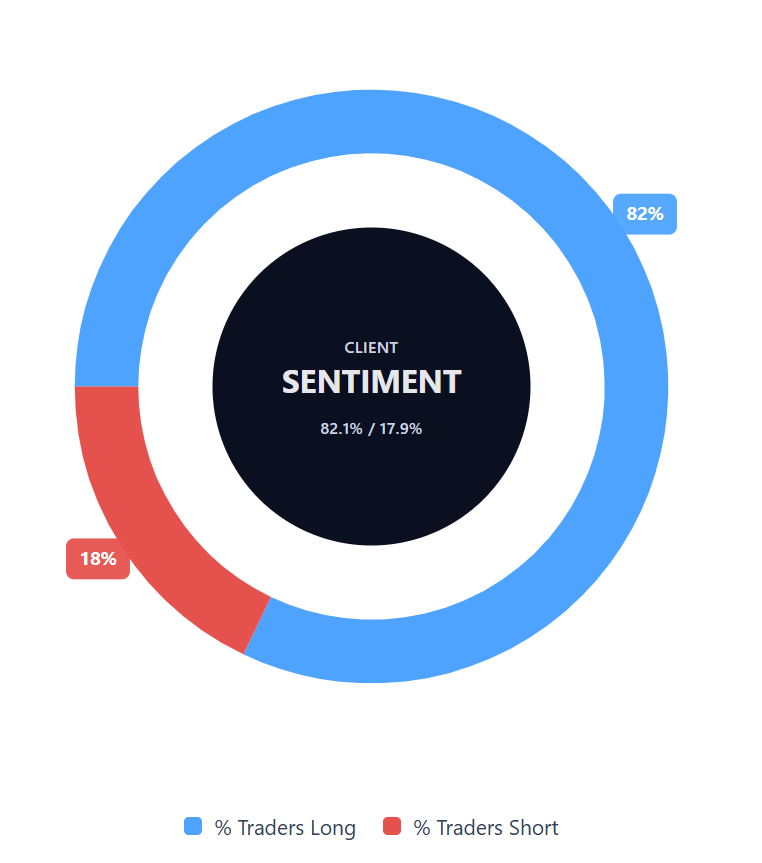
Capital.com’s client sentiment for Costco CFDs
Costco CFD buyers account for 82.1% of positions versus 17.9% sellers, showing a strong tilt towards the long side, with buyers ahead by 64.1 percentage points (22 September 2025). This snapshot reflects open positions on Capital.com and is subject to change.
FAQ
Who owns the most Costco stock?
The largest institutional shareholder of Costco is The Vanguard Group, holding about 9.8% of the outstanding shares (Yahoo Finance, 22 September 2025).
Is Costco a good stock to buy?
The largest institutional shareholder of Costco is The Vanguard Group, holding about 9.8% of the outstanding shares (Yahoo Finance, 22 September 2025).
Could Costco stock go up or down?
This content does not provide investment advice or suitability recommendations. Readers should carry out their own research and seek professional guidance if needed.
Should I invest in Costco stock?
No suitability or appropriateness claims are made here. Any investment decision should be based on individual circumstances and risk considerations. CFDs are traded on margin. Leverage amplifies gains and losses.