Apple stock forecast: Third-party price targets
Apple is one of the most widely followed US shares, with its price often responding to earnings updates, product cycles, interest-rate expectations and regulatory developments. Read on for the latest third-party AAPL predictions…
Apple (AAPL) is trading around $257.47 in intraday trading on 8 January 2026, having moved between an intraday low of $257.21 and a high of $262.44 on Capital.com’s platform as of 11:49am UTC. Past performance is not a reliable indicator of future results.
Price action comes amid a modest uptick in US Treasury yields, with the 10-year note trading near 4.16% as investors look ahead to key US employment data (CNBC, 8 January 2026). Apple shares are also trading in the wake of the company’s fiscal fourth-quarter 2025 results, where Apple reported September-quarter revenue of $102.5bn, up 8% year on year, and record full-year revenue of $416bn (Apple, 30 October 2025). Apple is also navigating ongoing regulatory developments, including Apple’s December 2025 announcement of changes to iOS in Japan to comply with the Mobile Software Competition Act, which affects app distribution and payment options (Apple, 17 December 2025).
Apple stock forecast 2026–2030: Third-party price targets
As of 8 January 2026, third-party Apple stock predictions cluster in the high-$200s to mid-$300s range as institutions update views to reflect the iPhone 17 cycle, services growth and AI-related plans. These targets are indicative 12-month objectives based on each institution’s valuation framework, not guarantees or precise year-end levels.
UBS (broker research note)
UBS reiterates a 12-month AAPL stock forecast of $280, keeping a neutral stance and framing the level as modest upside from the then spot price. The bank cites mid-single-digit App Store revenue growth and mixed survey signals on iPhone purchase intent, amid ongoing interest in Apple’s new intelligence features and regional divergences in demand (Investing.com, 9 December 2025).
Morgan Stanley (IT hardware outlook)
Morgan Stanley raises its Apple 12-month price target to $315 from $305, maintaining the stock as an overweight, high-conviction idea into the 2026 product cycle. The firm points to higher assumed fiscal 2027 earnings power as iPhone unit volumes and pricing offset memory cost inflation, with Apple seen as one of the few hardware names where demand elasticity remains relatively limited (AppleInsider, 17 December 2025).
Citi (upgrade-cycle analysis)
Citi lifts its 12-month Apple share price forecast to $330 from $315, keeping a positive stance as analysts highlight stronger-than-expected momentum for the iPhone 17 upgrade cycle. Citi notes that a large cohort of iPhone 12 and 13 users is entering a replacement window, with services and advertising also supporting forecasts for higher earnings and a premium valuation multiple amid a firmer upgrade pool into 2026 and 2027 (Investing.com, 9 December 2025).
Goldman Sachs (App Store and services focus)
Goldman Sachs maintains a $320 12-month price target for Apple, alongside a positive rating on the shares. The bank flags resilient services and App Store trends even as December App Store spending dipped slightly, with services mix, margin profile and balance sheet strength cited as key supports for the existing valuation stance (Moomoo, 6 January 2026).
Wedbush (AI and iPhone 17 thesis)
Wedbush lifts its Apple 12-month price target to $350 from $320, reiterating an outperform view as the firm frames Apple as a potential beneficiary of AI-related product developments alongside the iPhone 17 cycle. The research cites expectations that 2026 will mark a more formal entry into expanded AI features, with a possible Google Gemini partnership and robust iPhone demand seen as drivers for higher monetisation over time (Yahoo Finance, 10 December 2025).
Predictions and third-party forecasts can be inaccurate, as they cannot account for unforeseen market developments and should not be relied upon as a definitive guide to future performance.
AAPL stock price: Technical overview
Apple (AAPL) is trading around $257.47 as of 11:49am UTC on 8 January 2026, sitting below a tight moving-average cluster, with the 20/50/100/200-day SMAs roughly at $272, $273, $259 and $233 respectively, suggesting price is currently under its medium-term trend band. The 14-day RSI is near 27.6, a level some traders interpret as oversold, while an ADX reading around 17.7 points to a relatively weak directional trend rather than a strong impulse move.
Above the current price, traders often use the classic pivot near 275.8 and the R1 pivot around 284.7 as reference levels, with the R2 area near 297.5 higher up. Below the current price, the 100-day SMA around 258.6 is a nearby moving-average level to monitor; a sustained move below it could bring lower pivot levels into view (TradingView, 8 January 2026).
This is technical analysis for informational purposes only and does not constitute financial advice or a recommendation to buy or sell any instrument.
Apple share price history
Apple (AAPL)’s share price has risen over the past two years, moving from the low-to-mid $180s in early 2024 to trade above $250 for much of late 2025 and into January 2026. Over that period, the stock dipped below $170 at times in spring 2024 before moving higher through the second half of the year and then posting further gains in 2025, closing above $270 in December as the market reacted to earnings, product updates and broader moves in US technology stocks.
Looking at more recent moves, Apple has traded in a relatively tight band since autumn 2025, with pullbacks toward the mid-$250s followed at times by moves back into the $260–$280 area as of early January 2026. On 8 January 2026, the stock closed at $257.57, modestly below late-December levels near $272–$274 but still well above the sub-$200 prices seen in the first half of 2024, showing the scale of the move over the period even as day-to-day volatility remains part of trading individual shares.
Past performance is not a reliable indicator of future results. Share prices are indicative and may differ from live market prices.
Capital.com analyst view
The AAPL stock price has trended higher over the past two years, moving from the high-$100s in early 2024 to trade in the mid-$200s by January 2026, with several sharp swings along the way as markets reacted to earnings releases, macro data and broader moves in US technology stocks. This kind of path may be of interest to traders who look for liquid, well-known names with active news flow, but the same characteristics also mean Apple can experience rapid repricing when sentiment towards growth stocks, interest-rate expectations or company-specific headlines shifts.
From a trading perspective, some market participants focus on Apple as a way to express views on themes such as consumer demand, AI adoption and the wider US equity market, while others see the recent pullbacks and rallies as evidence that even large-capitalisation stocks can be volatile. Volatility can create larger short-term price swings for both long and short strategies, but it also increases the likelihood of larger losses if price moves against a position, particularly when using leverage or concentrating too much risk in a single name.
CFDs are complex instruments and carry a high risk of losing money rapidly due to leverage.
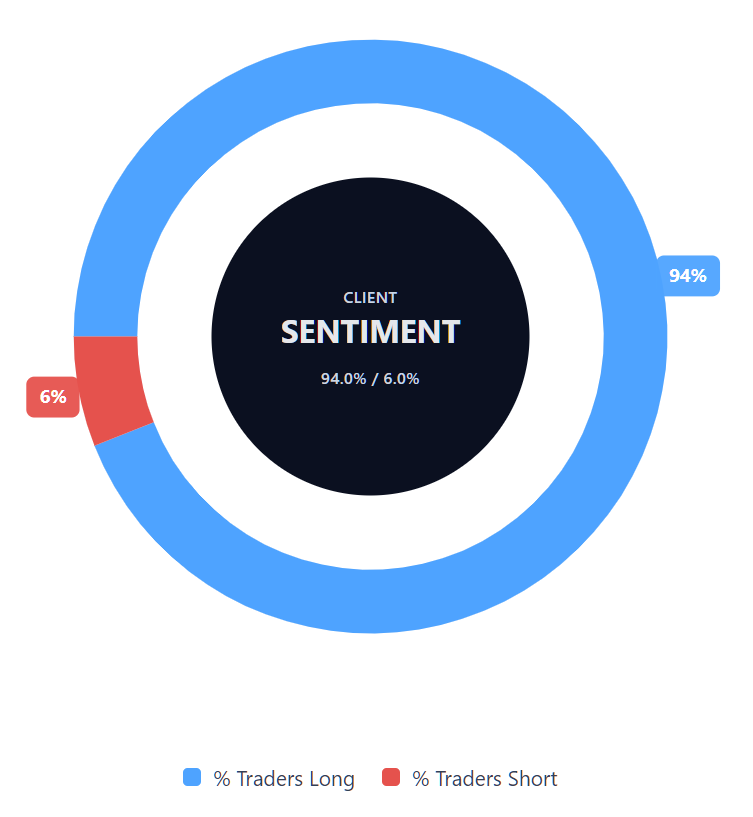
Capital.com’s client sentiment for Apple CFDs
As of 8 January 2026, Capital.com client positioning in Apple CFDs shows 94% buyers versus 6% sellers, a heavy-buy skew that puts buyers ahead by 88 percentage points. This one-sided tilt toward longs shows how positioning is currently concentrated on the buy side, rather than being balanced between the two directions. This snapshot reflects open Apple positions on Capital.com and can change over time as traders adjust their exposure.
Summary – Apple price 2025
- Apple’s share price moved from the low-$180s in early 2024 to trade mostly in the mid-$200s to high-$270s range through late 2025, before trading near $257–$262 in early January 2026.
- Intraday on 8 January 2026, Apple traded between a low of $257.21 and a high of $262.44 on Capital.com’s platform, with the last price at $257.47 as of 11:49am UTC.
- Technical readings show price sitting below clustered 20- and 50-day moving averages near $272–$273, while longer-term 100- and 200-day averages around $259 and $233 still suggest a longer-term upward bias over the past year, based on those measures.
- Analyst 12-month price targets published in late 2025 and early 2026 span roughly $280 to $350, with different institutions citing factors such as the iPhone 17 upgrade cycle, services growth and AI-related plans, while acknowledging uncertainties around demand and regulation.
Past performance is not a reliable indicator of future results.
FAQ
Who owns the most Apple stock?
What is the five-year AAPL stock forecast?
Is Apple a good stock to buy?
Could Apple stock go up or down?
Should I invest in Apple stock?
How can I trade Apple CFDs on Capital.com?
With Capital.com, you can trade Apple CFDs to speculate on price moves without owning the underlying shares. Contracts for difference (CFDs) let you take long or short positions, depending on your outlook. However, CFDs are traded on margin, and leverage amplifies both your profits and your losses.